Estimated zip code population in 2022: 48,226 Zip code population in 2010: 40,755 Zip code population in 2000: 37,119
Houses and condos: 21,302 Renter-occupied apartments: 7,252
% of renters here:
36%
State:
33%
March 2022 cost of living index in zip code 27513: 95.2 (less than average, U.S. average is 100)
Land area: 15.8 sq. mi. Water area: 0.4 sq. mi.
Population density: 3,051 people per square mile
(average).
OSM Map
General Map
Google Map
MSN Map
OSM Map
General Map
Google Map
MSN Map
OSM Map
General Map
Google Map
MSN Map
OSM Map
General Map
Google Map
MSN Map
Please wait while loading the map...
Real estate property taxes paid for housing units in 2022:
This zip code:
0.7% ($3,568)
North Carolina:
0.6% ($1,769)
Median real estate property taxes paid for housing units with mortgages in 2022: $3,538 (0.7%) Median real estate property taxes paid for housing units with no mortgage in 2022: $3,603 (0.7%)
Estimated median house/condo value in 2022: $516,643
27513:
$516,643
North Carolina:
$280,600
According to our research of North Carolina and other state lists, there were 15 registered sex offenders living in 27513 zip code as of May 23, 2024. The ratio of all residents to sex offenders in zip code 27513 is 2,937 to 1. The ratio of registered sex offenders to all residents in this zip code is much lower than the state average.
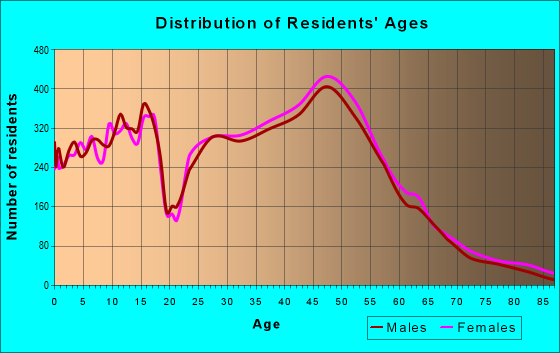
Median resident age:
This zip code:
40.0 years
North Carolina median age:
39.2 years
Average household size:
This zip code:
2.4 people
North Carolina:
2.4 people
Averages for the 2020 tax year for zip code 27513, filed in 2021:
Average Adjusted Gross Income (AGI) in 2020: $121,481 (Individual Income Tax Returns)
Here:
$121,481
State:
$70,020
Salary/wage: $95,598 (reported on 85.7% of returns)
Here:
$95,598
State:
$58,387
(% of AGI for various income ranges: 1210.8% for AGIs below $25k, 3926.5% for AGIs $25k-50k, 6890.9% for AGIs $50k-75k, 9998.6% for AGIs $75k-100k, 21083.0% for AGIs $100k-200k, 87719.5% for AGIs over 200k)
Taxable interest for individuals: $2,092 (reported on 44.3% of returns)
This zip code:
$2,092
North Carolina:
$1,479
(% of AGI for various income ranges: 23.3% for AGIs below $25k, 24.7% for AGIs $25k-50k, 45.9% for AGIs $50k-75k, 77.9% for AGIs $75k-100k, 138.5% for AGIs $100k-200k, 1437.3% for AGIs over 200k)
Ordinary dividends: $12,742 (reported on 34.0% of returns)
Here:
$12,742
State:
$7,888
(% of AGI for various income ranges: 43.8% for AGIs below $25k, 53.3% for AGIs $25k-50k, 115.9% for AGIs $50k-75k, 215.6% for AGIs $75k-100k, 413.9% for AGIs $100k-200k, 8282.2% for AGIs over 200k)
Net capital gain/loss in AGI: +$23,234 (reported on 31.3% of returns)
Here:
+$23,234
State:
+$23,652
(% of AGI for various income ranges: 22.7% for AGIs below $25k, 34.4% for AGIs $25k-50k, 114.9% for AGIs $50k-75k, 268.9% for AGIs $75k-100k, 606.3% for AGIs $100k-200k, 14913.6% for AGIs over 200k)
Profit/loss from business: +$17,841 (reported on 16.7% of returns)
Here:
+$17,841
State:
+$11,710
(% of AGI for various income ranges: 154.9% for AGIs below $25k, 174.7% for AGIs $25k-50k, 203.7% for AGIs $50k-75k, 235.5% for AGIs $75k-100k, 598.2% for AGIs $100k-200k, 3449.1% for AGIs over 200k)
Taxable individual retirement arrangement distribution: $25,214 (reported on 9.5% of returns)
27513:
$25,214
North Carolina:
$20,247
(% of AGI for various income ranges: 61.9% for AGIs below $25k, 98.6% for AGIs $25k-50k, 268.2% for AGIs $50k-75k, 409.1% for AGIs $75k-100k, 757.6% for AGIs $100k-200k, 1801.9% for AGIs over 200k)
Self-employed (Keogh) retirement plans: $25,344 (reported on 1.2% of returns)
27513:
$25,344
North Carolina:
$26,749
(% of AGI for various income ranges: 15.5% for AGIs $50k-75k, 50.4% for AGIs $100k-200k, 528.7% for AGIs over 200k)
Total itemized deductions: $33,849 (reported on 13.0% of returns)
Here:
$33,849
State:
$34,549
(% of AGI for various income ranges: 83.7% for AGIs below $25k, 124.6% for AGIs $25k-50k, 271.2% for AGIs $50k-75k, 572.7% for AGIs $75k-100k, 1141.6% for AGIs $100k-200k, 5052.9% for AGIs over 200k)
Charity contributions: $11,938 (reported on 10.8% of returns)
Here:
$11,938
State:
$13,360
(% of AGI for various income ranges: 5.3% for AGIs below $25k, 13.3% for AGIs $25k-50k, 39.9% for AGIs $50k-75k, 97.4% for AGIs $75k-100k, 282.5% for AGIs $100k-200k, 1984.4% for AGIs over 200k)
Taxes paid: $8,727 (reported on 12.9% of returns)
27513:
$8,727
State:
$7,586
(% of AGI for various income ranges: 12.5% for AGIs below $25k, 20.5% for AGIs $25k-50k, 67.5% for AGIs $50k-75k, 154.8% for AGIs $75k-100k, 346.4% for AGIs $100k-200k, 1217.5% for AGIs over 200k)
Earned income credit: $1,863 (reported on 8.2% of returns)
Here:
$1,863
State:
$2,337
(% of AGI for various income ranges: 56.3% for AGIs below $25k, 43.5% for AGIs $25k-50k)
Percentage of individuals using paid preparers for their 2020 taxes: 92.5%
Here:
93%
State:
93%
(% for various income ranges: 90.7% for AGIs below $25k, 93.3% for AGIs $25k-50k, 92.9% for AGIs $50k-75k, 91.6% for AGIs $75k-100k, 93.4% for AGIs $100k-200k, 93.8% for AGIs over 200k)
Averages for the 2012 tax year for zip code 27513, filed in 2013:
Average Adjusted Gross Income (AGI) in 2012: $101,327 (Individual Income Tax Returns)
Here:
$101,327
State:
$54,937
Salary/wage: $78,353 (reported on 89.6% of returns)
Here:
$78,353
State:
$46,336
(% of AGI for various income ranges: 80.0% for AGIs below $25k, 85.0% for AGIs $25k-50k, 83.0% for AGIs $50k-75k, 83.0% for AGIs $75k-100k, 87.0% for AGIs $100k-200k, 50.2% for AGIs over 200k)
Taxable interest for individuals: $996 (reported on 47.0% of returns)
This zip code:
$996
North Carolina:
$1,298
(% of AGI for various income ranges: 1.2% for AGIs below $25k, 0.6% for AGIs $25k-50k, 0.6% for AGIs $50k-75k, 0.6% for AGIs $75k-100k, 0.5% for AGIs $100k-200k, 0.3% for AGIs over 200k)
Ordinary dividends: $4,617 (reported on 31.1% of returns)
Here:
$4,617
State:
$6,213
(% of AGI for various income ranges: 1.8% for AGIs below $25k, 0.9% for AGIs $25k-50k, 1.1% for AGIs $50k-75k, 1.1% for AGIs $75k-100k, 1.2% for AGIs $100k-200k, 1.7% for AGIs over 200k)
Net capital gain/loss in AGI: +$15,572 (reported on 26.0% of returns)
Here:
+$15,572
State:
+$12,740
(% of AGI for various income ranges: 0.1% for AGIs below $25k, 0.2% for AGIs $25k-50k, 0.2% for AGIs $50k-75k, 0.5% for AGIs $75k-100k, 0.8% for AGIs $100k-200k, 8.1% for AGIs over 200k)
Profit/loss from business: +$13,639 (reported on 16.1% of returns)
Here:
+$13,639
State:
+$10,311
(% of AGI for various income ranges: 8.0% for AGIs below $25k, 3.0% for AGIs $25k-50k, 3.0% for AGIs $50k-75k, 2.2% for AGIs $75k-100k, 1.9% for AGIs $100k-200k, 1.6% for AGIs over 200k)
Taxable individual retirement arrangement distribution: $16,920 (reported on 8.5% of returns)
27513:
$16,920
North Carolina:
$15,575
(% of AGI for various income ranges: 2.2% for AGIs below $25k, 1.8% for AGIs $25k-50k, 2.2% for AGIs $50k-75k, 2.2% for AGIs $75k-100k, 1.7% for AGIs $100k-200k, 0.8% for AGIs over 200k)
Self-employment retirement plans: $21,409 (reported on 1.1% of returns)
27513:
$21,409
North Carolina:
$21,078
(% of AGI for various income ranges: 0.2% for AGIs $25k-50k, 0.1% for AGIs $75k-100k, 0.2% for AGIs $100k-200k, 0.3% for AGIs over 200k)
Total itemized deductions: $25,972 (15% of AGI, reported on 47.8% of returns)
Here:
$25,972
State:
$23,438
Here:
14.7% of AGI
State:
21.5% of AGI
(% of AGI for various income ranges: 10.5% for AGIs below $25k, 10.7% for AGIs $25k-50k, 13.7% for AGIs $50k-75k, 15.5% for AGIs $75k-100k, 16.1% for AGIs $100k-200k, 9.4% for AGIs over 200k)
Charity contributions: $4,226 (reported on 41.1% of returns)
Here:
$4,226
State:
$4,687
(% of AGI for various income ranges: 0.7% for AGIs below $25k, 1.1% for AGIs $25k-50k, 1.7% for AGIs $50k-75k, 2.1% for AGIs $75k-100k, 2.2% for AGIs $100k-200k, 1.6% for AGIs over 200k)
Taxes paid: $12,796 (reported on 47.6% of returns)
27513:
$12,796
State:
$8,823
(% of AGI for various income ranges: 1.9% for AGIs below $25k, 2.8% for AGIs $25k-50k, 4.4% for AGIs $50k-75k, 6.0% for AGIs $75k-100k, 7.7% for AGIs $100k-200k, 6.0% for AGIs over 200k)
Earned income credit: $1,924 (reported on 9.6% of returns)
Here:
$1,924
State:
$2,376
(% of AGI for various income ranges: 4.1% for AGIs below $25k, 0.7% for AGIs $25k-50k)
Percentage of individuals using paid preparers for their 2012 taxes: 39.0%
Here:
39%
State:
53%
(% for various income ranges: 36.8% for AGIs below $25k, 36.2% for AGIs $25k-50k, 37.8% for AGIs $50k-75k, 37.8% for AGIs $75k-100k, 38.5% for AGIs $100k-200k, 57.1% for AGIs over 200k)
Averages for the 2004 tax year for zip code 27513, filed in 2005:
Average Adjusted Gross Income (AGI) in 2004: $71,574 (Individual Income Tax Returns)
Here:
$71,574
State:
$45,376
Salary/wage: $67,073 (reported on 91.2% of returns)
Here:
$67,073
State:
$39,442
(% of AGI for various income ranges: 1089.9% for AGIs below $10k, 86.2% for AGIs $10k-25k, 88.5% for AGIs $25k-50k, 87.6% for AGIs $50k-75k, 89.4% for AGIs $75k-100k, 82.0% for AGIs over 100k)
Taxable interest for individuals: $1,165 (reported on 57.4% of returns)
This zip code:
$1,165
North Carolina:
$1,515
(% of AGI for various income ranges: 58.1% for AGIs below $10k, 1.5% for AGIs $10k-25k, 1.0% for AGIs $25k-50k, 0.7% for AGIs $50k-75k, 0.7% for AGIs $75k-100k, 0.9% for AGIs over 100k)
Taxable dividends: $2,190 (reported on 36.4% of returns)
Here:
$2,190
State:
$4,016
(% of AGI for various income ranges: 46.1% for AGIs below $10k, 1.2% for AGIs $10k-25k, 0.8% for AGIs $25k-50k, 0.7% for AGIs $50k-75k, 0.7% for AGIs $75k-100k, 1.3% for AGIs over 100k)
Net capital gain/loss: +$8,741 (reported on 31.5% of returns)
Here:
+$8,741
State:
+$11,152
(% of AGI for various income ranges: -14.8% for AGIs below $10k, 0.4% for AGIs $10k-25k, 0.4% for AGIs $25k-50k, 0.5% for AGIs $50k-75k, 0.6% for AGIs $75k-100k, 6.2% for AGIs over 100k)
Profit/loss from business: +$11,792 (reported on 14.0% of returns)
Here:
+$11,792
State:
+$9,490
(% of AGI for various income ranges: -40.8% for AGIs below $10k, 3.1% for AGIs $10k-25k, 2.3% for AGIs $25k-50k, 2.5% for AGIs $50k-75k, 1.9% for AGIs $75k-100k, 2.4% for AGIs over 100k)
IRA payment deduction: $3,109 (reported on 3.3% of returns)
27513:
$3,109
North Carolina:
$2,967
(% of AGI for various income ranges: 3.5% for AGIs below $10k, 0.3% for AGIs $10k-25k, 0.3% for AGIs $25k-50k, 0.3% for AGIs $50k-75k, 0.2% for AGIs $75k-100k, 0.1% for AGIs over 100k)
Self-employed pension: $14,223 (reported on 1.3% of returns)
Here:
$14,223
North Carolina:
$14,754
(% of AGI for various income ranges: 0.1% for AGIs $25k-50k, 0.1% for AGIs $50k-75k, 0.2% for AGIs $75k-100k, 0.4% for AGIs over 100k)
Total itemized deductions: $21,769 (19% of AGI, reported on 53.6% of returns)
Here:
$21,769
State:
$19,464
Here:
19.4% of AGI
State:
22.7% of AGI
(% of AGI for various income ranges: 141.4% for AGIs below $10k, 12.9% for AGIs $10k-25k, 13.5% for AGIs $25k-50k, 17.3% for AGIs $50k-75k, 19.1% for AGIs $75k-100k, 15.9% for AGIs over 100k)
Charity contributions deductions: $3,405 (3% of AGI, reported on 48.3% of returns)
Here:
$3,405
State:
$4,035
Here:
2.9% of AGI
State:
4.5% of AGI
(% of AGI for various income ranges: 7.2% for AGIs below $10k, 1.1% for AGIs $10k-25k, 1.5% for AGIs $25k-50k, 2.1% for AGIs $50k-75k, 2.5% for AGIs $75k-100k, 2.5% for AGIs over 100k)
Total tax: $11,997 (reported on 83.2% of returns)
27513:
$11,997
State:
$7,257
(% of AGI for various income ranges: 29.1% for AGIs below $10k, 4.5% for AGIs $10k-25k, 7.8% for AGIs $25k-50k, 9.6% for AGIs $50k-75k, 10.3% for AGIs $75k-100k, 17.4% for AGIs over 100k)
Earned income credit: $1,533 (reported on 6.5% of returns)
Here:
$1,533
State:
$1,851
Percentage of individuals using paid preparers for their 2004 taxes: 39.6%
Here:
40%
State:
62%
(% for various income ranges: 34.1% for AGIs below $10k, 43.9% for AGIs $10k-25k, 39.3% for AGIs $25k-50k, 39.7% for AGIs $50k-75k, 35.1% for AGIs $75k-100k, 43.4% for AGIs over 100k)
Likely homosexual households (counted as self-reported same-sex unmarried-partner households)
Lesbian couples: 0.1% of all households
Gay men: 0.3% of all households
Household received Food Stamps/SNAP in the past 12 months: 653 Household did not receive Food Stamps/SNAP in the past 12 months: 19,190
Women who had a birth in the past 12 months: 548 (520 now married, 39 unmarried) Women who did not have a birth in the past 12 months: 10,901 (5,566 now married, 5,352 unmarried)
Housing units in zip code 27513 with a mortgage: 9,180 (1,159 second mortgage, 52 home equity loan, 1,069 both second mortgage and home equity loan) Houses without a mortgage: 304
Median monthly owner costs for units with a mortgage: $1,966 Median monthly owner costs for units without a mortgage: $658
Residents with income below the poverty level in 2022:
This zip code:
4.7%
Whole state:
12.8%
Residents with income below 50% of the poverty level in 2022:
This zip code:
2.4%
Whole state:
6.8%
Median number of rooms in houses and condos:
Here:
7.9
State:
6.4
Median number of rooms in apartments:
Here:
3.9
State:
4.4
Notable locations in this zip code not listed on our city pages
Churches in zip code 27513 include: Sree Venkateswara Temple of North Carolina (A), Cary Church (B), Reedy Creek Church (C). Display/hide their locations on the map
7,757 married couples with children.
1,445 single-parent households (649 men, 796 women).
78.2% of residents of 27513 zip code speak English at home.
6.4% of residents speak Spanish at home (62% very well, 25% well, 6% not well, 6% not at all).
7.6% of residents speak other Indo-European language at home (77% very well, 16% well, 4% not well, 3% not at all).
6.0% of residents speak Asian or Pacific Island language at home (75% very well, 16% well, 8% not well, 2% not at all).
2.6% of residents speak other language at home (94% very well, 3% well, 3% not well).
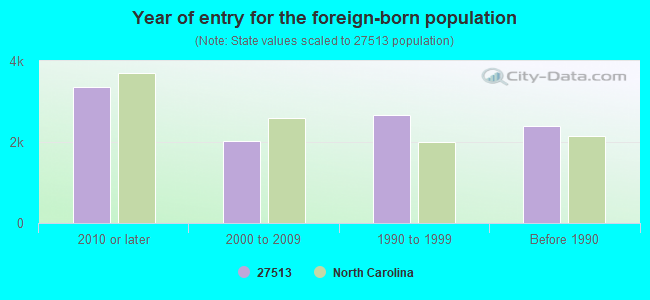
Foreign born population: 9,614 (19.9%) (64.2% of them are naturalized citizens)
Facilities with environmental interests located in this zip code:
CARY ACADEMY (1500 N HARRISON AVE in CARY, NC)
AIR MINOR (AIRS/AFS) STATE MASTER (North Carolina facility info) - AIR PROGRAM Business SIC classification: ELEMENTARY AND SECONDARY SCHOOLS
CHANDLER CONCRETE COMPANY INCORPORATED (4601 NELSON ROAD ROAD in CARY, NC)
AIR MINOR (AIRS/AFS) STATE MASTER (North Carolina facility info) - AIR PROGRAM Business SIC classification: READY-MIXED CONCRETE
CARY ELEMENTARY (930 REEDY CREEK ROAD in CARY, NC)
(National Center for Education Statistics) - STATE ID-364 Organizations: WAKE COUNTY SCHOOLS (SCHOOL DISTRICT)
CAROLINA AUTO BODY OF CARY INCORPORATED (200 TOWERVIEW COURT in CARY, NC)
(Resource Conservation and Recovery Act (tracking hazardous waste)) Organizations: DAVID & LINDA PRANCE (CONTACT/OWNER)
CARECHEM CORPORATION (8120 CHAPEL HILL ROAD in CARY, NC)
(Resource Conservation and Recovery Act (tracking hazardous waste))
DIOSYNTH-RTP INCORPORATED (3000 WESTON PARKWAY in CARY, NC)
HAZARDOUS WASTE BIENNIAL REPORTER (Resource Conservation and Recovery Act (tracking hazardous waste)) Small Quantity Generators, between 100 kg and 1000 kg of hazardous waste/month (Resource Conservation and Recovery Act (tracking hazardous waste)) - notification Organizations: UNIVERSITY OF CHICAGO (CONTACT/OWNER)
Alternative names: IEA INCORPORATED
ASHLEY A. ANSARI, DVM, PHD (102 BOLTSTONE CT in CARY, NC)
COMPLIANCE ACTIVITY (Tracking inspections of insecticide, fungicide, and rodenticide, and toxic substances)
CHARLES RIVER PATHOLOGY ASSOCIATES (11000 WESTON PKWAY in CARY, NC)
Small Quantity Generators, between 100 kg and 1000 kg of hazardous waste/month (Resource Conservation and Recovery Act (tracking hazardous waste))
DIESEL INJECTION OF CARY INC (233 E JOHNSON ST in CARY, NC)
Conditionally Exempt Small Quantity Generators, less than 100 kg/month of hazardous waste (Resource Conservation and Recovery Act (tracking hazardous waste)) - notification Organizations: MCKAY PETTUS (CONTACT/OWNER)
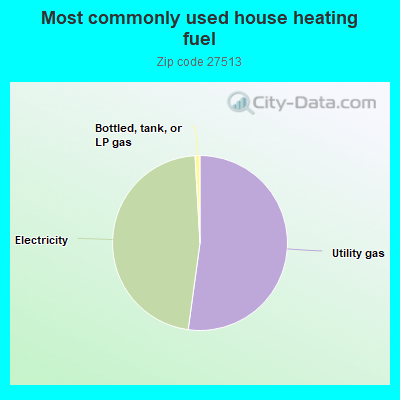
Housing units lacking complete plumbing facilities: 0.1% Housing units lacking complete kitchen facilities: 0.2%
51.9%Utility gas
46.7%Electricity
0.9%Bottled, tank, or LP gas
Population in 1990: 15,082. Population change in the 1990s: +22,037 (+146.1%).
Place of birth for U.S.-born residents:
This state: 13,929
Northeast: 9,004
Midwest: 5,638
South: 6,992
West: 2,804
40% of the 27513 zip code residents lived in the same house 5 years ago. Out of people who lived in different houses, 35% lived in this county. Out of people who lived in different counties, 50% lived in North Carolina.
86% of the 27513 zip code residents lived in the same house 1 year ago. Out of people who lived in different houses, 44% moved from this county. Out of people who lived in different houses, 12% moved from different county within same state. Out of people who lived in different houses, 34% moved from different state. Out of people who lived in different houses, 7% moved from abroad.
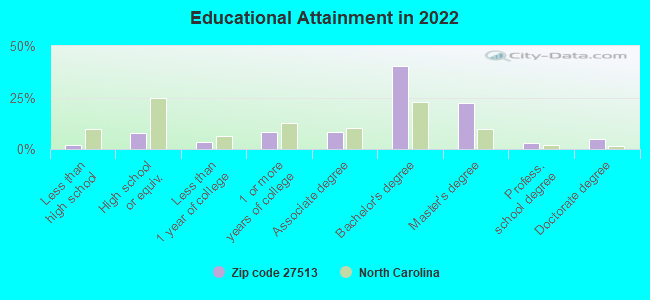
Private vs. public school enrollment:
Students in private schools in grades 1 to 8 (elementary and middle school): 551
Here:
12.5%
North Carolina:
13.8%
Students in private schools in grades 9 to 12 (high school): 360
Here:
15.3%
North Carolina:
11.9%
Students in private undergraduate colleges: 124
Here:
7.2%
North Carolina:
19.3%
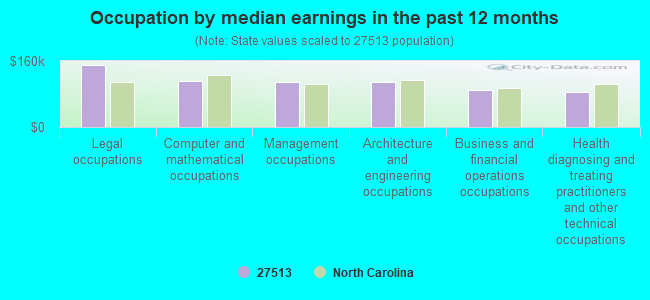
Occupation by median earnings in the past 12 months ($)
149,484Legal occupations
110,754Computer and mathematical occupations
109,167Management occupations
108,111Architecture and engineering occupations
88,543Business and financial operations occupations
85,066Health diagnosing and treating practitioners and other technical occupations
Companies with biggest federal contracts located in this zip code (CARY, NC):
SMARTNET, INC (SAS CAMPUS DR; small business) 9166 employees, $1180000000 revenue. Hist. Underutilized Business Zone (HUBZone) Firm, Woman Owned Business: $42,835,561 in 398 contractsfrom 1999 to 2006
Contracts for Other ADP and Telecommunications Services (includes data storage on tapes, compact disks, etc.), Maintenance, Repair and Rebuilding of Equipment -- Automatic Data Processing Equipment (Including Firmware), Software, Supplies and Support Equipment, Maintenance, Repair and Rebuilding of Equipment -- Miscellaneous, ADP Software, and moreby Defense Information Systems Agency, Department of Defense, Bureau of the Census, Internal Revenue Service, and others Signed by year:2000: $4,928,287; 2001: $2,653,228; 2002: $8,148,391; 2003: $3,417,971; 2004: $6,494,881; 2005: $7,416,006; 2006: $2,030,837.
Biggest contracts:
$3,885,598 with Defense Information Systems Agency for Other ADP and Telecommunications Services (includes data storage on tapes, compact disks, etc.). Taking place in PA. Signed on 2005-12-20. Completion date: 2006-12-31.
$3,409,929 with Department of Defense for Other ADP and Telecommunications Services (includes data storage on tapes, compact disks, etc.). Signed on 2004-12-29. Completion date: 2005-12-31.
$2,200,000 with Bureau of the Census for Other ADP and Telecommunications Services (includes data storage on tapes, compact disks, etc.). Signed on 1999-12-15. Completion date: 2000-09-15.
$988,997 with Department of Defense for Other ADP and Telecommunications Services (includes data storage on tapes, compact disks, etc.). Signed on 2002-10-01. Completion date: 2003-09-30.
INI POWER SYSTEMS INC (136 QUADE DR; small business) : $849,843 in 3 contractsfrom 2003 to 2005
$498,533 with Army for Other Research and Development -- Basic Research (R&D). Signed on 2004-08-30. Completion date: 2005-08-31.
$251,452, same as above.Signed on 2005-07-28. Completion date: 2006-03-06.
$99,858 with Army for Other Research and Development -- Basic Research (R&D). Taking place in CA. Signed on 2003-08-01. Completion date: 2004-02-06.
PROTEAN DEVICES INC (15401 WESTON PKWY STE 175; small business) : $295,000 in 2 contractsin 2003
$200,000 with Air Force for Defense Electronics and Communication Equipment -- Applied Research and Exploratory Development (R&D). Signed on 2003-05-09. Completion date: 2005-03-16.
$95,000, same as above.Signed on 2003-12-02. Completion date: 2005-02-28.
MTS SYSTEMS CORPORATION (3001 SHELDON DR; small business) : $291,173 in 15 contractsfrom 2003 to 2006
Contracts for Electrical and Electronic Properties Measuring and Testing Instruments, Miscellaneous Communication Equipment, Communications Security Equipment and Components, Liquid and Gas Flow, Liquid Level, and Mechanical Motion Measuring Instruments, and moreby Navy Signed by year:2000: $0; 2001: $0; 2002: $0; 2003: $166,648; 2004: $4,347; 2005: $77,068; 2006: $43,110.
Biggest contracts:
$70,398 with Navy for Electrical and Electronic Properties Measuring and Testing Instruments. Taking place in MD. Signed on 2003-12-18. Completion date: 2004-01-15.
$57,750 with Navy for Electrical and Electronic Properties Measuring and Testing Instruments. Signed on 2003-11-20. Completion date: 2004-02-12.
$38,500, same as above.Signed on 2003-11-20. Completion date: 2004-02-12.
$37,101 with Navy for Miscellaneous Communication Equipment. Signed on 2005-01-27. Completion date: 2005-02-24.
ULTIMUS INC (15200 WESTON PARKWAY, SUIT) : $202,242 in 5 contractsfrom 2001 to 2004
Contracts for Maintenance, Repair and Rebuilding of Equipment -- Miscellaneous, ADP Software, Maintenance, Repair and Rebuilding of Equipment -- Automatic Data Processing Equipment (Including Firmware), Software, Supplies and Support Equipment, ADP System Acquisition Support Services. Includes preparation of statement of work, benchmarks, specifications, etc. by National Institutes of Health, Army Signed by year:2000: $0; 2001: $177,330; 2002: $9,500; 2003: $8,322; 2004: $7,090; 2005: $0; 2006: $0.
Biggest contracts:
$129,000 with National Institutes of Health for Maintenance, Repair and Rebuilding of Equipment -- Miscellaneous. Signed on 2001-08-15. Completion date: 2002-09-15.
$48,330 with Army for ADP Software. Signed on 2001-11-16. Completion date: 2001-11-30.
$9,500 with Army for Maintenance, Repair and Rebuilding of Equipment -- Automatic Data Processing Equipment (Including Firmware), Software, Supplies and Support Equipment. Signed on 2002-09-12. Completion date: 2002-10-01.
$8,322 with Army for ADP System Acquisition Support Services. Includes preparation of statement of work, benchmarks, specifications, etc.. Signed on 2003-10-30. Completion date: 2004-09-30.
POLYGENEX INTERNATIONAL, INC (220 JAMES JACKSON AVE; small business) : $145,724 in 5 contractsfrom 2003 to 2005
Contracts for Clothing, Special Purpose by Army, Navy Signed by year:2000: $0; 2001: $0; 2002: $0; 2003: $143,979; 2004: $0; 2005: $1,745; 2006: $0.
Biggest contracts:
$80,000 with Army for Clothing, Special Purpose. Signed on 2003-06-27. Completion date: 2003-10-21.
$40,313, same as above.Signed on 2003-06-27. Completion date: 2003-10-21.
$23,666, same as above.Signed on 2003-04-08. Completion date: 2003-04-25.
$1,147 with Navy for Clothing, Special Purpose. Taking place in VA. Signed on 2005-06-20. Completion date: 2005-07-01.
AUSTIN QUALITY FOODS INC (1 QUALITY LANE) : $93,099 in 3 contractsfrom 1999 to 2000
$35,395 with Department of Defense for Food Items For Resale. Signed on 1999-12-31. Completion date: 2000-01-31.
$30,037 with Department of Defense for Food Items For Resale. Taking place in VA. Signed on 2000-04-30. Completion date: 2000-04-30.
$27,667 with Department of Defense for Food Items For Resale. Signed on 2000-10-02. Completion date: 2000-11-30.
SCRIPTORIUM PUBLISHING SERVICE (1911 EVANS ROAD; small business)
$58,057 with Air Force for ADP Software. Taking place in NM. Signed on 2004-09-08. Completion date: 2005-04-10.
EMBASSY SUITES HTL (201 HARRISON OAKS BLVD) : $55,888 in 6 contractsfrom 2004 to 2006
Contracts for Lodging - Hotel/Motel, Construction of Structures and Facilities -- Other Residential Buildings by Army, Corporation for National and Community Service, Navy Signed by year:2000: $0; 2001: $0; 2002: $0; 2003: $0; 2004: $10,666; 2005: $15,740; 2006: $29,482.
Biggest contracts:
$20,069 with Army for Lodging - Hotel/Motel. Signed on 2006-01-25. Completion date: 2006-01-29.
$11,603 with Corporation for National and Community Service for Lodging - Hotel/Motel. Signed on 2006-08-18. Completion date: 2006-08-21.
$10,666 with Navy for Construction of Structures and Facilities -- Other Residential Buildings. Signed on 2004-11-10. Completion date: 2004-11-20.
$7,870 with Army for Lodging - Hotel/Motel. Signed on 2005-02-09. Completion date: 2005-02-21.
COR TECHNOLOGIES (103 QUARTERMAINE CT; small business) : $26,992 in 2 contractsin 2005
$17,700 with Army for Laboratory Equipment and Supplies. Signed on 2005-12-21. Completion date: 2006-12-31.
$9,292 with National Institutes of Health for . Taking place in MD. Signed on 2005-09-13. Completion date: 2005-09-13.
Top industries in this zip code by the number of employees in 2005:
Arts, Entertainment, and Recreation: Fitness and Recreational Sports Centers (250-499: 1, 20-49: 1, 5-9: 1, 1-4: 4)
Professional, Scientific, and Technical Services: Research and Development in the Physical, Engineering, and Life Sciences (100-249: 1, 50-99: 2, 20-49: 2, 1-4: 7)
People in group quarters in 2010:
7 people in residential treatment centers for juveniles (non-correctional)
People in group quarters in 2000:
189 people in nursing homes
6 people in homes for the mentally retarded
Fatal accident statistics in 2012:
Fatal accident count: 2
Vehicles involved in fatal accidents: 3
Fatal accidents caused by drunken drivers: 0
Fatalities: 3
Persons involved in fatal accidents: 4
Pedestrians involved in fatal accidents: 0
Fatal accident statistics in 2010:
Fatal accident count: 2
Vehicles involved in fatal accidents: 8
Fatal accidents caused by drunken drivers: 1
Fatalities: 2
Persons involved in fatal accidents: 9
Pedestrians involved in fatal accidents: 0
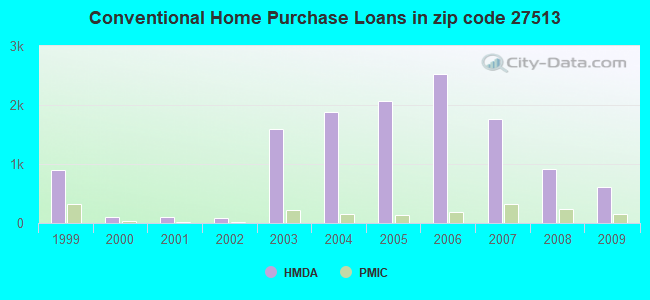
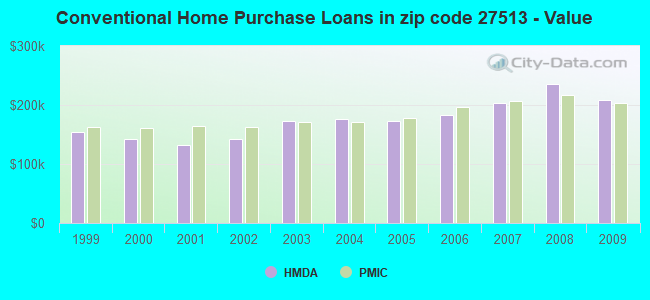
Home Mortgage Disclosure Act Aggregated Statistics For Year 2009 (Based on 7 full and 6 partial tracts)
A) FHA, FSA/RHS & VA Home Purchase Loans
B) Conventional Home Purchase Loans
C) Refinancings
D) Home Improvement Loans
E) Loans on Dwellings For 5+ Families
F) Non-occupant Loans on < 5 Family Dwellings (A B C & D)
G) Loans On Manufactured Home Dwelling (A B C & D)
Number
Average Value
Number
Average Value
Number
Average Value
Number
Average Value
Number
Average Value
Number
Average Value
Number
Average Value
LOANS ORIGINATED
293
$190,937
612
$208,176
3,121
$223,520
58
$138,457
0
$0
103
$172,594
3
$218,040
APPLICATIONS APPROVED, NOT ACCEPTED
8
$180,572
26
$202,270
183
$256,927
16
$89,613
0
$0
6
$145,632
0
$0
APPLICATIONS DENIED
27
$188,497
44
$172,070
392
$234,734
36
$44,023
1
$22,250,000
28
$180,913
0
$0
APPLICATIONS WITHDRAWN
50
$179,805
98
$222,011
387
$216,140
6
$127,135
1
$4,873,000
22
$152,893
0
$0
FILES CLOSED FOR INCOMPLETENESS
1
$238,100
8
$188,962
105
$233,342
8
$97,376
0
$0
5
$147,226
0
$0
Aggregated Statistics For Year 2008 (Based on 7 full and 6 partial tracts)
A) FHA, FSA/RHS & VA Home Purchase Loans
B) Conventional Home Purchase Loans
C) Refinancings
D) Home Improvement Loans
E) Loans on Dwellings For 5+ Families
F) Non-occupant Loans on < 5 Family Dwellings (A B C & D)
G) Loans On Manufactured Home Dwelling (A B C & D)
Number
Average Value
Number
Average Value
Number
Average Value
Number
Average Value
Number
Average Value
Number
Average Value
Number
Average Value
LOANS ORIGINATED
157
$196,852
919
$235,206
1,453
$210,320
92
$101,547
6
$4,578,472
161
$154,900
0
$0
APPLICATIONS APPROVED, NOT ACCEPTED
6
$228,812
144
$235,493
198
$198,358
22
$121,674
1
$1,500,000
25
$207,574
0
$0
APPLICATIONS DENIED
12
$234,407
79
$211,376
424
$207,228
97
$73,789
0
$0
37
$123,412
1
$69,120
APPLICATIONS WITHDRAWN
24
$185,858
146
$253,393
262
$222,776
24
$97,909
0
$0
16
$138,671
0
$0
FILES CLOSED FOR INCOMPLETENESS
2
$185,165
14
$295,671
45
$191,341
7
$65,730
0
$0
2
$201,310
0
$0
Aggregated Statistics For Year 2007 (Based on 7 full and 6 partial tracts)
A) FHA, FSA/RHS & VA Home Purchase Loans
B) Conventional Home Purchase Loans
C) Refinancings
D) Home Improvement Loans
E) Loans on Dwellings For 5+ Families
F) Non-occupant Loans on < 5 Family Dwellings (A B C & D)
G) Loans On Manufactured Home Dwelling (A B C & D)
Number
Average Value
Number
Average Value
Number
Average Value
Number
Average Value
Number
Average Value
Number
Average Value
Number
Average Value
LOANS ORIGINATED
31
$176,732
1,756
$203,578
1,055
$182,851
133
$60,534
0
$0
211
$161,981
2
$81,190
APPLICATIONS APPROVED, NOT ACCEPTED
5
$206,322
174
$211,271
158
$151,742
46
$62,880
1
$29,380
22
$123,069
0
$0
APPLICATIONS DENIED
11
$163,065
134
$208,895
446
$157,946
78
$116,235
0
$0
35
$171,121
1
$80,000
APPLICATIONS WITHDRAWN
4
$141,252
261
$238,449
247
$180,836
47
$86,830
0
$0
22
$173,270
2
$120,385
FILES CLOSED FOR INCOMPLETENESS
0
$0
32
$226,274
60
$174,406
3
$77,690
0
$0
5
$186,238
0
$0
Aggregated Statistics For Year 2006 (Based on 7 full and 6 partial tracts)
A) FHA, FSA/RHS & VA Home Purchase Loans
B) Conventional Home Purchase Loans
C) Refinancings
D) Home Improvement Loans
E) Loans on Dwellings For 5+ Families
F) Non-occupant Loans on < 5 Family Dwellings (A B C & D)
G) Loans On Manufactured Home Dwelling (A B C & D)
Number
Average Value
Number
Average Value
Number
Average Value
Number
Average Value
Number
Average Value
Number
Average Value
Number
Average Value
LOANS ORIGINATED
57
$163,110
2,530
$182,429
1,055
$160,825
126
$58,972
2
$237,330
333
$137,899
3
$70,507
APPLICATIONS APPROVED, NOT ACCEPTED
1
$198,010
258
$185,640
185
$137,263
24
$31,320
0
$0
40
$113,560
0
$0
APPLICATIONS DENIED
5
$198,838
237
$168,280
420
$142,036
84
$77,117
0
$0
51
$148,023
6
$58,198
APPLICATIONS WITHDRAWN
11
$213,875
374
$202,689
214
$174,696
43
$95,173
0
$0
51
$165,597
0
$0
FILES CLOSED FOR INCOMPLETENESS
0
$0
42
$181,759
84
$231,639
6
$32,992
0
$0
7
$149,171
0
$0
Aggregated Statistics For Year 2005 (Based on 7 full and 6 partial tracts)
A) FHA, FSA/RHS & VA Home Purchase Loans
B) Conventional Home Purchase Loans
C) Refinancings
D) Home Improvement Loans
E) Loans on Dwellings For 5+ Families
F) Non-occupant Loans on < 5 Family Dwellings (A B C & D)
G) Loans On Manufactured Home Dwelling (A B C & D)
Number
Average Value
Number
Average Value
Number
Average Value
Number
Average Value
Number
Average Value
Number
Average Value
Number
Average Value
LOANS ORIGINATED
84
$154,332
2,073
$173,230
1,321
$165,040
78
$62,198
3
$11,583,757
262
$122,148
0
$0
APPLICATIONS APPROVED, NOT ACCEPTED
0
$0
172
$177,463
201
$159,128
23
$51,141
0
$0
13
$125,354
4
$88,138
APPLICATIONS DENIED
11
$145,329
165
$152,375
435
$153,775
69
$80,260
0
$0
43
$102,240
12
$57,521
APPLICATIONS WITHDRAWN
0
$0
309
$221,859
290
$198,676
38
$101,104
0
$0
36
$269,879
0
$0
FILES CLOSED FOR INCOMPLETENESS
2
$114,850
22
$220,647
139
$184,546
12
$51,948
0
$0
7
$120,033
0
$0
Aggregated Statistics For Year 2004 (Based on 7 full and 6 partial tracts)
A) FHA, FSA/RHS & VA Home Purchase Loans
B) Conventional Home Purchase Loans
C) Refinancings
D) Home Improvement Loans
F) Non-occupant Loans on < 5 Family Dwellings (A B C & D)
G) Loans On Manufactured Home Dwelling (A B C & D)
Number
Average Value
Number
Average Value
Number
Average Value
Number
Average Value
Number
Average Value
Number
Average Value
LOANS ORIGINATED
73
$136,551
1,882
$176,941
1,807
$170,238
63
$78,359
200
$122,208
0
$0
APPLICATIONS APPROVED, NOT ACCEPTED
6
$103,170
123
$180,966
169
$155,912
17
$103,725
10
$130,141
4
$14,410
APPLICATIONS DENIED
13
$149,146
125
$155,795
387
$157,673
61
$61,444
36
$150,062
8
$53,629
APPLICATIONS WITHDRAWN
6
$171,257
192
$171,098
347
$164,123
22
$44,455
24
$117,747
0
$0
FILES CLOSED FOR INCOMPLETENESS
0
$0
23
$156,251
100
$165,895
6
$123,542
2
$120,790
0
$0
Aggregated Statistics For Year 2003 (Based on 7 full and 6 partial tracts)
A) FHA, FSA/RHS & VA Home Purchase Loans
B) Conventional Home Purchase Loans
C) Refinancings
D) Home Improvement Loans
E) Loans on Dwellings For 5+ Families
F) Non-occupant Loans on < 5 Family Dwellings (A B C & D)
Number
Average Value
Number
Average Value
Number
Average Value
Number
Average Value
Number
Average Value
Number
Average Value
LOANS ORIGINATED
140
$139,260
1,587
$172,945
5,596
$164,883
80
$34,878
0
$0
250
$111,302
APPLICATIONS APPROVED, NOT ACCEPTED
9
$164,840
67
$174,217
361
$158,719
17
$56,059
0
$0
15
$134,162
APPLICATIONS DENIED
10
$134,418
57
$144,524
493
$156,279
44
$33,965
2
$6,769,400
19
$103,454
APPLICATIONS WITHDRAWN
6
$157,308
173
$164,662
475
$156,479
4
$11,505
0
$0
41
$122,534
FILES CLOSED FOR INCOMPLETENESS
0
$0
20
$177,183
115
$161,479
13
$39,272
0
$0
9
$139,841
Aggregated Statistics For Year 2002 (Based on 2 partial tracts)
A) FHA, FSA/RHS & VA Home Purchase Loans
B) Conventional Home Purchase Loans
C) Refinancings
D) Home Improvement Loans
F) Non-occupant Loans on < 5 Family Dwellings (A B C & D)
Number
Average Value
Number
Average Value
Number
Average Value
Number
Average Value
Number
Average Value
LOANS ORIGINATED
20
$145,368
86
$142,490
332
$138,563
6
$27,360
27
$112,448
APPLICATIONS APPROVED, NOT ACCEPTED
0
$0
10
$104,717
27
$139,680
3
$20,160
1
$57,020
APPLICATIONS DENIED
1
$115,780
8
$100,008
41
$114,764
5
$18,490
4
$171,072
APPLICATIONS WITHDRAWN
3
$93,600
10
$126,749
33
$123,212
2
$15,550
2
$160,705
FILES CLOSED FOR INCOMPLETENESS
0
$0
3
$103,393
8
$120,312
0
$0
2
$76,030
Aggregated Statistics For Year 2001 (Based on 2 partial tracts)
A) FHA, FSA/RHS & VA Home Purchase Loans
B) Conventional Home Purchase Loans
C) Refinancings
D) Home Improvement Loans
E) Loans on Dwellings For 5+ Families
F) Non-occupant Loans on < 5 Family Dwellings (A B C & D)
Number
Average Value
Number
Average Value
Number
Average Value
Number
Average Value
Number
Average Value
Number
Average Value
LOANS ORIGINATED
10
$144,893
107
$132,628
234
$147,094
14
$31,166
1
$4,786,560
14
$103,556
APPLICATIONS APPROVED, NOT ACCEPTED
0
$0
10
$111,197
14
$127,440
4
$28,295
0
$0
2
$84,240
APPLICATIONS DENIED
0
$0
20
$99,965
33
$114,179
3
$17,857
0
$0
2
$82,945
APPLICATIONS WITHDRAWN
0
$0
11
$136,984
30
$147,370
1
$15,550
0
$0
2
$184,030
FILES CLOSED FOR INCOMPLETENESS
1
$132,190
1
$13,820
7
$106,889
0
$0
0
$0
0
$0
Aggregated Statistics For Year 2000 (Based on 2 partial tracts)
A) FHA, FSA/RHS & VA Home Purchase Loans
B) Conventional Home Purchase Loans
C) Refinancings
D) Home Improvement Loans
F) Non-occupant Loans on < 5 Family Dwellings (A B C & D)
Number
Average Value
Number
Average Value
Number
Average Value
Number
Average Value
Number
Average Value
LOANS ORIGINATED
21
$132,686
109
$143,036
25
$105,650
10
$19,354
6
$109,583
APPLICATIONS APPROVED, NOT ACCEPTED
0
$0
5
$134,612
8
$91,476
5
$29,894
0
$0
APPLICATIONS DENIED
1
$30,240
22
$104,073
12
$194,544
5
$49,594
3
$135,647
APPLICATIONS WITHDRAWN
1
$120,960
8
$129,708
7
$74,674
0
$0
1
$86,400
FILES CLOSED FOR INCOMPLETENESS
0
$0
2
$153,790
4
$111,672
0
$0
0
$0
Aggregated Statistics For Year 1999 (Based on 1 full and 2 partial tracts)
A) FHA, FSA/RHS & VA Home Purchase Loans
B) Conventional Home Purchase Loans
C) Refinancings
D) Home Improvement Loans
E) Loans on Dwellings For 5+ Families
F) Non-occupant Loans on < 5 Family Dwellings (A B C & D)
2002 - 2018 National Fire Incident Reporting System (NFIRS) incidents
Based on the data from the years 2002 - 2018 the average number of fires per year is 66. The highest number of fires - 116 took place in 2004, and the least - 1 in 2007. The data has a growing trend.
When looking into fire subcategories, the most incidents belonged to: Structure Fires (44.8%), and Outside Fires (36.2%).
Fire incident types reported to NFIRS in Zip Code 27513


 Nearest zip codes: 27511, 27560, 27518, 27519, 27607, 27606.


 Based on the data from the years 2002 - 2018 the average number of fires per year is 66. The highest number of fires - 116 took place in 2004, and the least - 1 in 2007. The data has a growing trend.
 When looking into fire subcategories, the most incidents belonged to: Structure Fires (44.8%), and Outside Fires (36.2%).