Estimated zip code population in 2022: 1,417 Zip code population in 2010: 1,734 Zip code population in 2000: 1,710
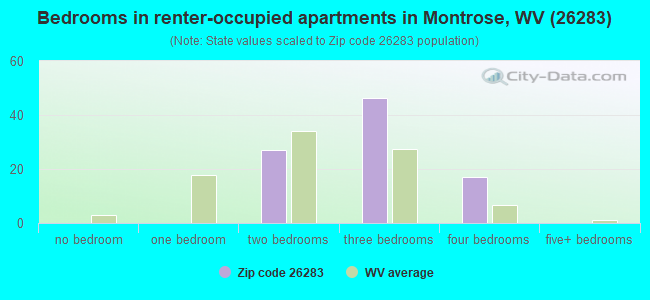
Houses and condos: 777 Renter-occupied apartments: 87
% of renters here:
14%
State:
26%
March 2022 cost of living index in zip code 26283: 84.9 (less than average, U.S. average is 100)
Land area: 60.0 sq. mi. Water area: 0.1 sq. mi.
Population density: 24 people per square mile
(very low).
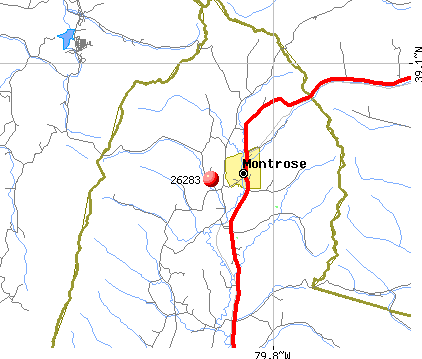
OSM Map
General Map
Google Map
MSN Map
OSM Map
General Map
Google Map
MSN Map
OSM Map
General Map
Google Map
MSN Map
OSM Map
General Map
Google Map
MSN Map
Please wait while loading the map...
Real estate property taxes paid for housing units in 2022:
This zip code:
0.4% ($649)
West Virginia:
0.5% ($821)
Median real estate property taxes paid for housing units with mortgages in 2022: $641 (0.3%) Median real estate property taxes paid for housing units with no mortgage in 2022: $646 (0.5%)
Business Search- 14 Million verified businesses
Males: 828
(58.5%)
Females: 588
(41.5%)
For population 25 years and over in 26283:
High school or higher: 95.9%
Bachelor's degree or higher: 22.9%
Graduate or professional degree: 8.6%
Unemployed: 9.6%
Mean travel time to work (commute): 29.1 minutes
For population 15 years and over in 26283:
Never married: 22.3%
Now married: 55.0%
Separated: 1.3%
Widowed: 11.9%
Divorced: 9.6%
Zip code 26283 compared to state average:
Unemployed percentage above state average.
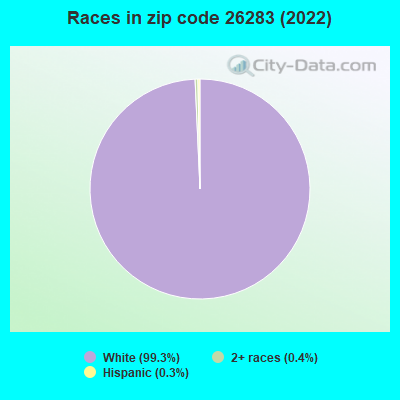
Black race population percentage significantly below state average.
Hispanic race population percentage significantly below state average.
Median age above state average.
Foreign-born population percentage below state average.
Renting percentage below state average.
Length of stay since moving in significantly above state average.
House age below state average.
Number of college students significantly below state average.
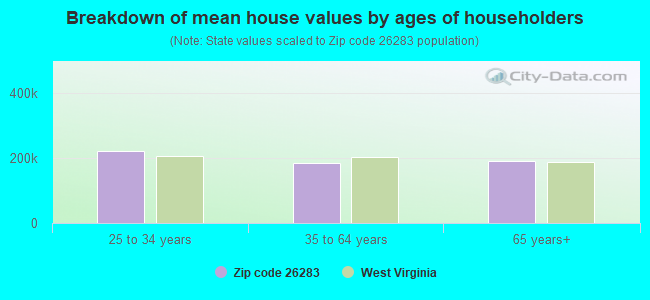
Estimated median house/condo value in 2022: $160,100
26283:
$160,100
West Virginia:
$155,100
According to our research of West Virginia and other state lists, there were 6 registered sex offenders living in 26283 zip code as of May 22, 2024. The ratio of all residents to sex offenders in zip code 26283 is 293 to 1. The ratio of registered sex offenders to all residents in this zip code is near the state average.
Median resident age:
This zip code:
49.0 years
West Virginia median age:
42.9 years
Average household size:
This zip code:
2.2 people
West Virginia:
2.3 people
Averages for the 2020 tax year for zip code 26283, filed in 2021:
Average Adjusted Gross Income (AGI) in 2020: $49,409 (Individual Income Tax Returns)
Here:
$49,409
State:
$56,292
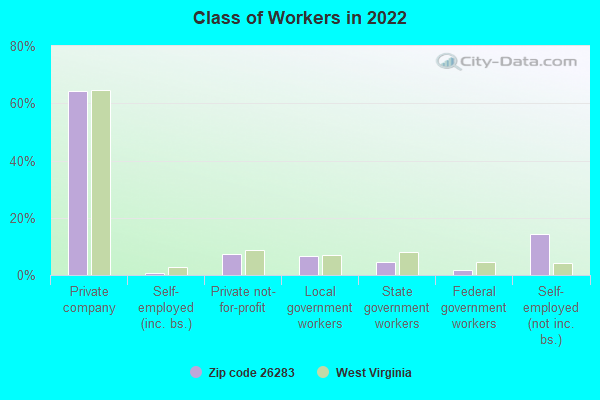
Salary/wage: $43,895 (reported on 82.6% of returns)
Here:
$43,895
State:
$49,093
(% of AGI for various income ranges: 1198.8% for AGIs below $25k, 3582.0% for AGIs $25k-50k, 5781.1% for AGIs $50k-75k, 9846.0% for AGIs $75k-100k, 14966.0% for AGIs $100k-200k)
Taxable interest for individuals: $689 (reported on 26.1% of returns)
This zip code:
$689
West Virginia:
$1,141
(% of AGI for various income ranges: 13.5% for AGIs below $25k, 8.7% for AGIs $25k-50k, 33.3% for AGIs $50k-75k, 8.0% for AGIs $75k-100k, 108.0% for AGIs $100k-200k)
Ordinary dividends: $4,100 (reported on 7.2% of returns)
Here:
$4,100
State:
$5,456
(% of AGI for various income ranges: 33.3% for AGIs $25k-50k, 310.0% for AGIs $100k-200k)
Net capital gain/loss in AGI: +$5,660 (reported on 7.2% of returns)
Here:
+$5,660
State:
+$11,656
(% of AGI for various income ranges: 52.7% for AGIs $25k-50k, 408.0% for AGIs $100k-200k)
Profit/loss from business: +$6,029 (reported on 10.1% of returns)
Here:
+$6,029
State:
+$12,084
(% of AGI for various income ranges: 62.9% for AGIs below $25k, 122.7% for AGIs $25k-50k, 145.6% for AGIs $50k-75k)
Taxable individual retirement arrangement distribution: $9,650 (reported on 8.7% of returns)
26283:
$9,650
West Virginia:
$15,311
(% of AGI for various income ranges: 131.8% for AGIs below $25k, 710.0% for AGIs $75k-100k)
Earned income credit: $1,962 (reported on 18.8% of returns)
Here:
$1,962
State:
$2,258
(% of AGI for various income ranges: 79.4% for AGIs below $25k, 80.0% for AGIs $25k-50k)
Percentage of individuals using paid preparers for their 2020 taxes: 92.8%
Here:
93%
State:
93%
(% for various income ranges: 95.8% for AGIs below $25k, 89.5% for AGIs $25k-50k, 100.0% for AGIs $50k-75k, 85.7% for AGIs $75k-100k, 87.5% for AGIs $100k-200k)
Averages for the 2012 tax year for zip code 26283, filed in 2013:
Average Adjusted Gross Income (AGI) in 2012: $39,423 (Individual Income Tax Returns)
Here:
$39,423
State:
$48,628
Salary/wage: $33,883 (reported on 84.3% of returns)
Here:
$33,883
State:
$42,328
(% of AGI for various income ranges: 73.3% for AGIs below $25k, 77.0% for AGIs $25k-50k, 78.6% for AGIs $50k-75k, 78.7% for AGIs $75k-100k, 58.5% for AGIs $100k-200k)
Taxable interest for individuals: $671 (reported on 30.0% of returns)
This zip code:
$671
West Virginia:
$1,211
(% of AGI for various income ranges: 0.9% for AGIs below $25k, 0.8% for AGIs $25k-50k, 0.2% for AGIs $50k-75k, 0.7% for AGIs $75k-100k, 0.2% for AGIs $100k-200k)
Ordinary dividends: $943 (reported on 10.0% of returns)
Here:
$943
State:
$4,262
Net capital gain/loss in AGI: +$1,300 (reported on 7.1% of returns)
Here:
+$1,300
State:
+$8,875
Profit/loss from business: +$4,789 (reported on 12.9% of returns)
Here:
+$4,789
State:
+$13,636
(% of AGI for various income ranges: 2.6% for AGIs below $25k, 4.3% for AGIs $25k-50k, 1.0% for AGIs $50k-75k)
Taxable individual retirement arrangement distribution: $6,367 (reported on 8.6% of returns)
26283:
$6,367
West Virginia:
$11,787
Total itemized deductions: $21,086 (19% of AGI, reported on 10.0% of returns)
Here:
$21,086
State:
$21,148
Here:
19.3% of AGI
State:
18.1% of AGI
Charity contributions: $4,225 (reported on 5.7% of returns)
Here:
$4,225
State:
$4,508
Taxes paid: $6,771 (reported on 10.0% of returns)
26283:
$6,771
State:
$8,103
Earned income credit: $1,747 (reported on 24.3% of returns)
Here:
$1,747
State:
$2,140
(% of AGI for various income ranges: 5.5% for AGIs below $25k, 1.2% for AGIs $25k-50k)
Percentage of individuals using paid preparers for their 2012 taxes: 51.4%
Here:
51%
State:
49%
(% for various income ranges: 47.1% for AGIs below $25k, 58.8% for AGIs $25k-50k, 50.0% for AGIs $50k-75k, 60.0% for AGIs $75k-100k, 50.0% for AGIs $100k-200k)
Averages for the 2004 tax year for zip code 26283, filed in 2005:
Average Adjusted Gross Income (AGI) in 2004: $28,705 (Individual Income Tax Returns)
Here:
$28,705
State:
$37,498
Salary/wage: $26,736 (reported on 88.4% of returns)
Here:
$26,736
State:
$33,645
(% of AGI for various income ranges: 128.7% for AGIs below $10k, 80.9% for AGIs $10k-25k, 88.1% for AGIs $25k-50k, 86.5% for AGIs $50k-75k, 85.5% for AGIs $75k-100k, 50.2% for AGIs over 100k)
Taxable interest for individuals: $984 (reported on 36.4% of returns)
This zip code:
$984
West Virginia:
$1,465
(% of AGI for various income ranges: 4.9% for AGIs below $10k, 0.9% for AGIs $10k-25k, 1.9% for AGIs $25k-50k, 0.3% for AGIs $50k-75k, 0.7% for AGIs $75k-100k, 2.0% for AGIs over 100k)
Taxable dividends: $667 (reported on 9.1% of returns)
Here:
$667
State:
$2,913
(% of AGI for various income ranges: 0.2% for AGIs $10k-25k, 0.1% for AGIs $25k-50k, 0.1% for AGIs $50k-75k, 0.9% for AGIs $75k-100k)
Net capital gain/loss: +$1,167 (reported on 6.1% of returns)
Here:
+$1,167
State:
+$6,331
Profit/loss from business: +$5,195 (reported on 12.6% of returns)
Here:
+$5,195
State:
+$11,074
(% of AGI for various income ranges: 17.8% for AGIs below $10k, 3.0% for AGIs $10k-25k, 2.3% for AGIs $25k-50k, 2.2% for AGIs $50k-75k)
IRA payment deduction: $2,727 (reported on 3.2% of returns)
26283:
$2,727
West Virginia:
$2,796
Total itemized deductions: $14,567 (21% of AGI, reported on 9.7% of returns)
Here:
$14,567
State:
$16,976
Here:
21.0% of AGI
State:
19.0% of AGI
(% of AGI for various income ranges: 4.8% for AGIs $25k-50k, 5.0% for AGIs $50k-75k, 9.7% for AGIs $75k-100k, 9.3% for AGIs over 100k)
Charity contributions deductions: $2,058 (3% of AGI, reported on 7.5% of returns)
Here:
$2,058
State:
$3,529
Here:
2.8% of AGI
State:
3.7% of AGI
Total tax: $3,610 (reported on 65.9% of returns)
26283:
$3,610
State:
$5,372
(% of AGI for various income ranges: 3.6% for AGIs below $10k, 3.4% for AGIs $10k-25k, 5.6% for AGIs $25k-50k, 9.2% for AGIs $50k-75k, 10.5% for AGIs $75k-100k, 18.5% for AGIs over 100k)
Earned income credit: $1,557 (reported on 22.9% of returns)
Here:
$1,557
State:
$1,662
Percentage of individuals using paid preparers for their 2004 taxes: 54.6%
Here:
55%
State:
55%
(% for various income ranges: 50.0% for AGIs below $10k, 58.4% for AGIs $10k-25k, 53.7% for AGIs $25k-50k, 51.2% for AGIs $50k-75k, 57.7% for AGIs $75k-100k, 76.5% for AGIs over 100k)
Household received Food Stamps/SNAP in the past 12 months: 34 Household did not receive Food Stamps/SNAP in the past 12 months: 568
Women who had a birth in the past 12 months: 20 (21 now married, 0 unmarried) Women who did not have a birth in the past 12 months: 140 (99 now married, 41 unmarried)
Housing units in zip code 26283 with a mortgage: 261 (18 second mortgage, 18 both second mortgage and home equity loan) Median monthly owner costs for units with a mortgage: $1,340 Median monthly owner costs for units without a mortgage: $328
Residents with income below the poverty level in 2022:
This zip code:
5.0%
Whole state:
17.9%
Residents with income below 50% of the poverty level in 2022:
This zip code:
2.0%
Whole state:
9.7%
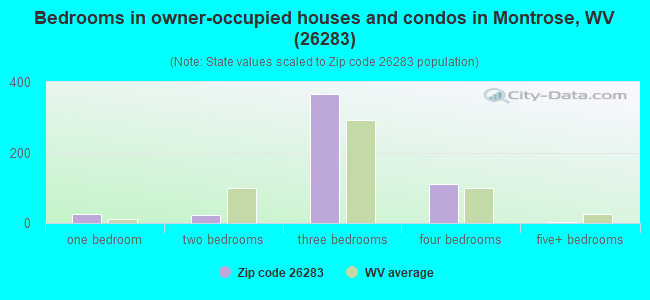
Median number of rooms in houses and condos:
Here:
6.7
State:
6.5
Median number of rooms in apartments:
Here:
5.4
State:
4.7
Notable locations in this zip code not listed on our city pages
Streams, rivers, and creeks: Laurel Run (A), Jobs Run (B), Hunting Camp Run (C), Hawk Run (D), Haddix Run (E), Grasslick Run (F), Goodwin Run (G), Fools Run (H), Cherry Fork (I). Display/hide their locations on the map
In group quarters: 49 (-1 institutionalized population)
Size of family households: 293 2-persons, 56 3-persons, 51 4-persons, 16 5-persons
Size of nonfamily households: 190 1-person
293 married couples with children.
60 single-parent households (55 men, 5 women).
100.2% of residents of 26283 zip code speak English at home.
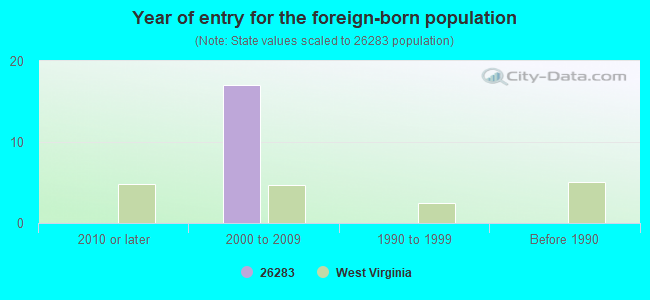
Foreign born population: 14 (1.0%) (100.0% of them are naturalized citizens)
This zip code:
1.0%
Whole state:
1.8%
92%Romania
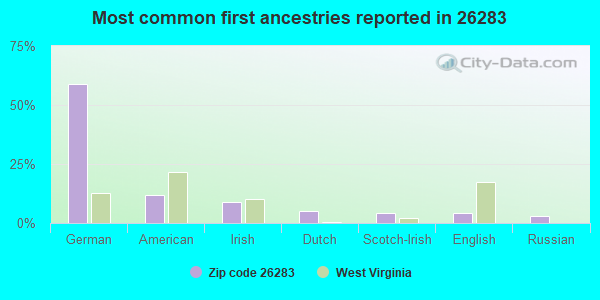
59%German
12%American
9%Irish
5%Dutch
4%Scotch-Irish
4%English
3%Russian
Year of entry for the foreign-born population
02010 or later
172000 to 2009
01990 to 1999
0Before 1990
Facilities with environmental interests located in this zip code:
JEFFRIES & CO (RT 219 N & LEADING CREEK RD in MONTROSE, WV)
(Resource Conservation and Recovery Act (tracking hazardous waste)) Organizations: JEFFRIES PHILLIP LEE (CONTACT/OWNER)
Housing units lacking complete plumbing facilities: 2.3% Housing units lacking complete kitchen facilities: 2.2%
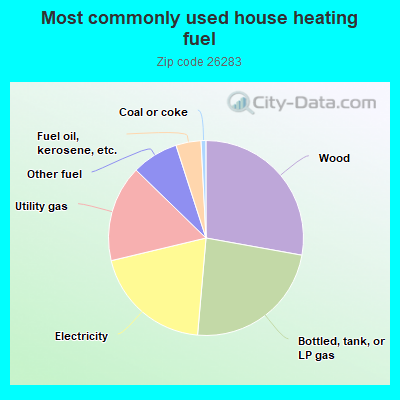
28.0%Wood
23.7%Bottled, tank, or LP gas
20.0%Electricity
16.1%Utility gas
7.8%Other fuel
4.2%Fuel oil, kerosene, etc.
0.8%Coal or coke
Population in 1990: 1,513. Population change in the 1990s: +197 (+13.0%).
Place of birth for U.S.-born residents:
This state: 1,040
Northeast: 84
Midwest: 69
South: 204
65% of the 26283 zip code residents lived in the same house 5 years ago. Out of people who lived in different houses, 76% lived in this county. Out of people who lived in different counties, 50% lived in West Virginia.
98% of the 26283 zip code residents lived in the same house 1 year ago. Out of people who lived in different houses, 35% moved from this county. Out of people who lived in different houses, 5% moved from different county within same state. Out of people who lived in different houses, 70% moved from different state.
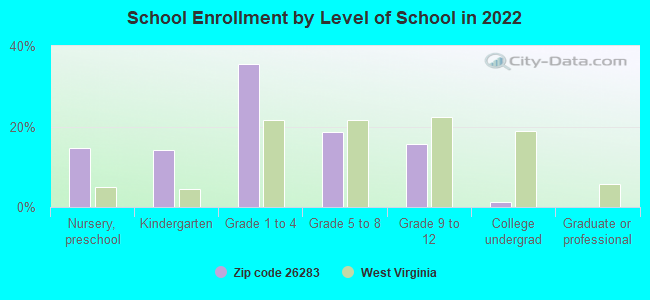
Private vs. public school enrollment:
Students in private schools in grades 1 to 8 (elementary and middle school): 32
Here:
25.8%
West Virginia:
12.2%
Students in private schools in grades 9 to 12 (high school): 9
Here:
25.9%
West Virginia:
8.8%
Students in private undergraduate colleges:
Here:
0.0%
West Virginia:
17.3%
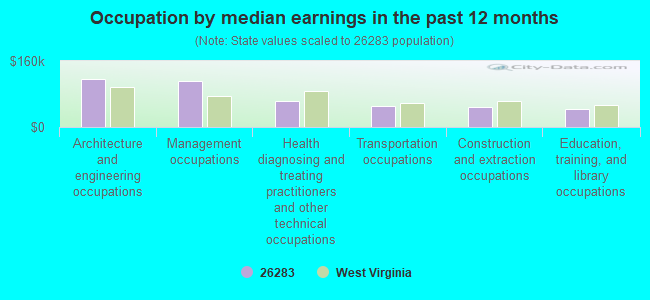
Occupation by median earnings in the past 12 months ($)
115,269Architecture and engineering occupations
110,431Management occupations
63,983Health diagnosing and treating practitioners and other technical occupations
51,375Transportation occupations
47,976Construction and extraction occupations
44,709Education, training, and library occupations
Top industries in this zip code by the number of employees in 2005:
Construction: All Other Specialty Trade Contractors (20-49 employees: 1 establishment)
Construction: New Single-Family Housing Construction (except Operative Builders) (10-19: 1, 1-4: 1)
Construction: Commercial and Institutional Building Construction (5-9: 1, 1-4: 1)
Health Care and Social Assistance: Residential Mental Retardation Facilities (5-9: 1)
Construction: Masonry Contractors (5-9: 1)
Professional, Scientific, and Technical Services: Surveying and Mapping (except Geophysical) Services (1-4: 2)
Administrative and Support and Waste Management and Remediation Services: Landscaping Services (1-4: 1)
Fatal accident statistics in 2011:
Fatal accident count: 2
Vehicles involved in fatal accidents: 3
Fatal accidents caused by drunken drivers: 1
Fatalities: 2
Persons involved in fatal accidents: 3
Pedestrians involved in fatal accidents: 0
2003 - 2018 National Fire Incident Reporting System (NFIRS) incidents
Based on the data from the years 2003 - 2018 the average number of fire incidents per year is 10. The highest number of fire incidents - 20 took place in 2009, and the least - 3 in 2004. The data has a rising trend.
When looking into fire subcategories, the most reports belonged to: Structure Fires (57.2%), and Outside Fires (22.3%).
Fire incident types reported to NFIRS in Zip Code 26283


 Nearest zip codes: 26276, 26241, 26250, 26275, 26405, 26285.
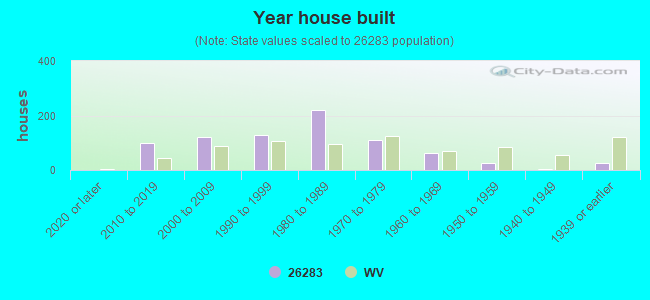


 Based on the data from the years 2003 - 2018 the average number of fire incidents per year is 10. The highest number of fire incidents - 20 took place in 2009, and the least - 3 in 2004. The data has a rising trend.
 When looking into fire subcategories, the most reports belonged to: Structure Fires (57.2%), and Outside Fires (22.3%).