Estimated zip code population in 2022: 5,384 Zip code population in 2010: 4,653 Zip code population in 2000: 3,977
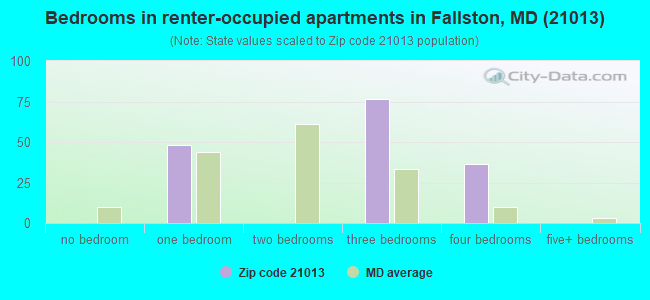
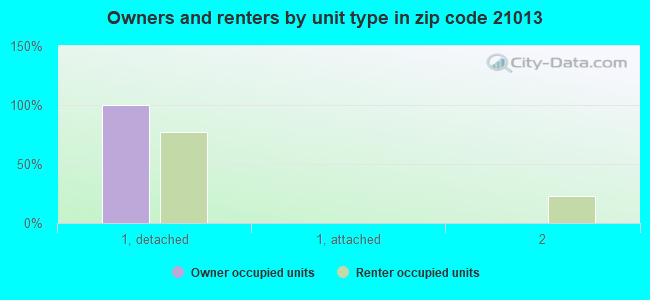
Houses and condos: 1,905 Renter-occupied apartments: 164
% of renters here:
9%
State:
32%
March 2022 cost of living index in zip code 21013: 99.1 (near average, U.S. average is 100)
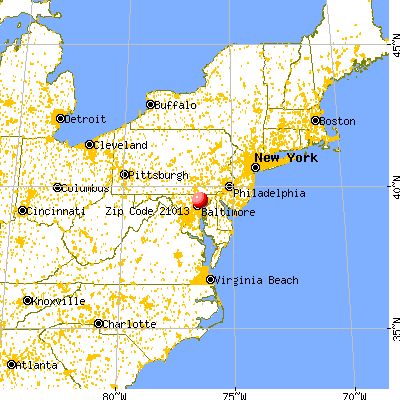
Land area: 15.1 sq. mi. Water area: 0.0 sq. mi.
Population density: 356 people per square mile
(very low).
OSM Map
General Map
Google Map
MSN Map
OSM Map
General Map
Google Map
MSN Map
OSM Map
General Map
Google Map
MSN Map
OSM Map
General Map
Google Map
MSN Map
Please wait while loading the map...
Real estate property taxes paid for housing units in 2022:
This zip code:
0.8% ($4,662)
Maryland:
0.9% ($3,777)
Median real estate property taxes paid for housing units with mortgages in 2022: $4,835 (0.8%) Median real estate property taxes paid for housing units with no mortgage in 2022: $4,429 (0.9%)
Estimated median house/condo value in 2022: $581,404
21013:
$581,404
Maryland:
$398,100
According to our research of Maryland and other state lists, there were 2 registered sex offenders living in 21013 zip code as of May 23, 2024. The ratio of all residents to sex offenders in zip code 21013 is 2,581 to 1. The ratio of registered sex offenders to all residents in this zip code is much lower than the state average.
Median resident age:
This zip code:
46.3 years
Maryland median age:
39.7 years
Average household size:
This zip code:
2.9 people
Maryland:
2.5 people
Averages for the 2020 tax year for zip code 21013, filed in 2021:
Average Adjusted Gross Income (AGI) in 2020: $159,888 (Individual Income Tax Returns)
Here:
$159,888
State:
$86,905
Salary/wage: $114,532 (reported on 77.2% of returns)
Here:
$114,532
State:
$73,953
(% of AGI for various income ranges: 1143.0% for AGIs below $25k, 3297.1% for AGIs $25k-50k, 6172.9% for AGIs $50k-75k, 7660.7% for AGIs $75k-100k, 19552.4% for AGIs $100k-200k, 75826.0% for AGIs over 200k)
Taxable interest for individuals: $1,930 (reported on 61.2% of returns)
This zip code:
$1,930
Maryland:
$1,528
(% of AGI for various income ranges: 23.7% for AGIs below $25k, 46.7% for AGIs $25k-50k, 135.0% for AGIs $50k-75k, 172.1% for AGIs $75k-100k, 241.5% for AGIs $100k-200k, 923.3% for AGIs over 200k)
Ordinary dividends: $8,551 (reported on 45.1% of returns)
Here:
$8,551
State:
$8,028
(% of AGI for various income ranges: 75.6% for AGIs below $25k, 165.7% for AGIs $25k-50k, 418.6% for AGIs $50k-75k, 376.4% for AGIs $75k-100k, 629.4% for AGIs $100k-200k, 3563.3% for AGIs over 200k)
Net capital gain/loss in AGI: +$25,884 (reported on 39.2% of returns)
Here:
+$25,884
State:
+$25,238
(% of AGI for various income ranges: 63.0% for AGIs below $25k, 71.9% for AGIs $25k-50k, 252.1% for AGIs $50k-75k, 413.6% for AGIs $75k-100k, 709.4% for AGIs $100k-200k, 13604.7% for AGIs over 200k)
Profit/loss from business: +$25,602 (reported on 16.9% of returns)
Here:
+$25,602
State:
+$11,398
(% of AGI for various income ranges: 81.1% for AGIs below $25k, 250.5% for AGIs $25k-50k, 262.1% for AGIs $50k-75k, 422.9% for AGIs $75k-100k, 798.8% for AGIs $100k-200k, 3880.7% for AGIs over 200k)
Taxable individual retirement arrangement distribution: $22,483 (reported on 17.7% of returns)
21013:
$22,483
Maryland:
$20,944
(% of AGI for various income ranges: 120.4% for AGIs below $25k, 283.8% for AGIs $25k-50k, 664.3% for AGIs $50k-75k, 507.1% for AGIs $75k-100k, 1221.2% for AGIs $100k-200k, 1820.0% for AGIs over 200k)
Self-employed (Keogh) retirement plans: $21,520 (reported on 2.1% of returns)
21013:
$21,520
Maryland:
$29,558
(% of AGI for various income ranges: 117.1% for AGIs $50k-75k, 608.0% for AGIs over 200k)
Total itemized deductions: $30,781 (reported on 29.5% of returns)
Here:
$30,781
State:
$30,672
(% of AGI for various income ranges: 670.5% for AGIs $25k-50k, 990.0% for AGIs $50k-75k, 1143.6% for AGIs $75k-100k, 2115.3% for AGIs $100k-200k, 6640.0% for AGIs over 200k)
Charity contributions: $7,300 (reported on 25.7% of returns)
Here:
$7,300
State:
$9,065
(% of AGI for various income ranges: 75.7% for AGIs $25k-50k, 96.4% for AGIs $50k-75k, 177.9% for AGIs $75k-100k, 360.3% for AGIs $100k-200k, 1790.0% for AGIs over 200k)
Taxes paid: $9,066 (reported on 29.5% of returns)
21013:
$9,066
State:
$8,475
(% of AGI for various income ranges: 155.2% for AGIs $25k-50k, 233.6% for AGIs $50k-75k, 410.0% for AGIs $75k-100k, 705.3% for AGIs $100k-200k, 1814.0% for AGIs over 200k)
Earned income credit: $1,625 (reported on 3.4% of returns)
Here:
$1,625
State:
$2,151
(% of AGI for various income ranges: 22.2% for AGIs below $25k, 33.3% for AGIs $25k-50k)
Percentage of individuals using paid preparers for their 2020 taxes: 90.3%
Here:
90%
State:
90%
(% for various income ranges: 89.4% for AGIs below $25k, 87.5% for AGIs $25k-50k, 91.3% for AGIs $50k-75k, 95.5% for AGIs $75k-100k, 89.4% for AGIs $100k-200k, 91.5% for AGIs over 200k)
Averages for the 2012 tax year for zip code 21013, filed in 2013:
Average Adjusted Gross Income (AGI) in 2012: $108,002 (Individual Income Tax Returns)
Here:
$108,002
State:
$72,703
Salary/wage: $90,433 (reported on 80.2% of returns)
Here:
$90,433
State:
$62,228
(% of AGI for various income ranges: 70.5% for AGIs below $25k, 66.2% for AGIs $25k-50k, 56.8% for AGIs $50k-75k, 59.8% for AGIs $75k-100k, 74.4% for AGIs $100k-200k, 64.4% for AGIs over 200k)
Taxable interest for individuals: $1,666 (reported on 66.8% of returns)
This zip code:
$1,666
Maryland:
$1,413
(% of AGI for various income ranges: 3.7% for AGIs below $25k, 1.7% for AGIs $25k-50k, 1.2% for AGIs $50k-75k, 1.3% for AGIs $75k-100k, 0.8% for AGIs $100k-200k, 0.9% for AGIs over 200k)
Ordinary dividends: $6,022 (reported on 46.6% of returns)
Here:
$6,022
State:
$6,933
(% of AGI for various income ranges: 5.9% for AGIs below $25k, 2.9% for AGIs $25k-50k, 3.0% for AGIs $50k-75k, 3.4% for AGIs $75k-100k, 1.9% for AGIs $100k-200k, 2.7% for AGIs over 200k)
Net capital gain/loss in AGI: +$9,680 (reported on 37.1% of returns)
Here:
+$9,680
State:
+$14,830
(% of AGI for various income ranges: 1.6% for AGIs $100k-200k, 6.5% for AGIs over 200k)
Profit/loss from business: +$21,621 (reported on 18.5% of returns)
Here:
+$21,621
State:
+$12,606
(% of AGI for various income ranges: 7.2% for AGIs below $25k, 4.2% for AGIs $25k-50k, 6.4% for AGIs $50k-75k, 3.2% for AGIs $75k-100k, 2.8% for AGIs $100k-200k, 3.9% for AGIs over 200k)
Taxable individual retirement arrangement distribution: $22,344 (reported on 19.4% of returns)
21013:
$22,344
Maryland:
$17,065
(% of AGI for various income ranges: 6.2% for AGIs below $25k, 5.5% for AGIs $25k-50k, 6.4% for AGIs $50k-75k, 5.2% for AGIs $75k-100k, 3.6% for AGIs $100k-200k, 3.5% for AGIs over 200k)
Self-employment retirement plans: $15,617 (reported on 2.6% of returns)
21013:
$15,617
Maryland:
$24,439
(% of AGI for various income ranges: 1.1% for AGIs $75k-100k, 0.6% for AGIs over 200k)
Total itemized deductions: $31,491 (20% of AGI, reported on 60.8% of returns)
Here:
$31,491
State:
$27,886
Here:
19.9% of AGI
State:
22.8% of AGI
(% of AGI for various income ranges: 24.8% for AGIs below $25k, 17.4% for AGIs $25k-50k, 17.3% for AGIs $50k-75k, 20.3% for AGIs $75k-100k, 19.8% for AGIs $100k-200k, 15.3% for AGIs over 200k)
Charity contributions: $4,582 (reported on 54.3% of returns)
Here:
$4,582
State:
$4,452
(% of AGI for various income ranges: 1.5% for AGIs below $25k, 1.8% for AGIs $25k-50k, 2.1% for AGIs $50k-75k, 2.7% for AGIs $75k-100k, 2.1% for AGIs $100k-200k, 2.5% for AGIs over 200k)
Taxes paid: $15,470 (reported on 60.3% of returns)
21013:
$15,470
State:
$11,690
(% of AGI for various income ranges: 5.9% for AGIs below $25k, 4.9% for AGIs $25k-50k, 7.2% for AGIs $50k-75k, 8.5% for AGIs $75k-100k, 9.4% for AGIs $100k-200k, 8.9% for AGIs over 200k)
Earned income credit: $1,300 (reported on 3.9% of returns)
Here:
$1,300
State:
$2,199
(% of AGI for various income ranges: 1.4% for AGIs below $25k, 0.3% for AGIs $25k-50k)
Percentage of individuals using paid preparers for their 2012 taxes: 56.0%
Here:
56%
State:
52%
(% for various income ranges: 49.2% for AGIs below $25k, 51.5% for AGIs $25k-50k, 59.3% for AGIs $50k-75k, 52.0% for AGIs $75k-100k, 58.3% for AGIs $100k-200k, 71.4% for AGIs over 200k)
Averages for the 2004 tax year for zip code 21013, filed in 2005:
Average Adjusted Gross Income (AGI) in 2004: $92,695 (Individual Income Tax Returns)
Here:
$92,695
State:
$60,339
Salary/wage: $77,828 (reported on 80.8% of returns)
Here:
$77,828
State:
$52,211
(% of AGI for various income ranges: 172.7% for AGIs below $10k, 58.0% for AGIs $10k-25k, 61.0% for AGIs $25k-50k, 62.9% for AGIs $50k-75k, 73.1% for AGIs $75k-100k, 67.9% for AGIs over 100k)
Taxable interest for individuals: $2,734 (reported on 74.8% of returns)
This zip code:
$2,734
Maryland:
$1,701
(% of AGI for various income ranges: 15.8% for AGIs below $10k, 5.3% for AGIs $10k-25k, 3.9% for AGIs $25k-50k, 2.2% for AGIs $50k-75k, 1.8% for AGIs $75k-100k, 2.0% for AGIs over 100k)
Taxable dividends: $3,263 (reported on 53.2% of returns)
Here:
$3,263
State:
$4,235
(% of AGI for various income ranges: 19.6% for AGIs below $10k, 3.2% for AGIs $10k-25k, 3.5% for AGIs $25k-50k, 2.4% for AGIs $50k-75k, 1.9% for AGIs $75k-100k, 1.5% for AGIs over 100k)
Net capital gain/loss: +$13,775 (reported on 45.3% of returns)
Here:
+$13,775
State:
+$15,888
(% of AGI for various income ranges: -9.7% for AGIs below $10k, -0.5% for AGIs $10k-25k, 1.5% for AGIs $25k-50k, -0.4% for AGIs $50k-75k, 2.2% for AGIs $75k-100k, 8.9% for AGIs over 100k)
Profit/loss from business: +$19,529 (reported on 17.8% of returns)
Here:
+$19,529
State:
+$12,221
(% of AGI for various income ranges: -1.6% for AGIs below $10k, 5.7% for AGIs $10k-25k, 3.1% for AGIs $25k-50k, 5.5% for AGIs $50k-75k, 6.1% for AGIs $75k-100k, 3.3% for AGIs over 100k)
IRA payment deduction: $3,889 (reported on 6.2% of returns)
21013:
$3,889
Maryland:
$2,968
(% of AGI for various income ranges: 3.2% for AGIs below $10k, 0.9% for AGIs $25k-50k, 0.5% for AGIs $50k-75k, 0.4% for AGIs $75k-100k, 0.2% for AGIs over 100k)
Self-employed pension: $13,720 (reported on 2.2% of returns)
Here:
$13,720
Maryland:
$17,155
Total itemized deductions: $26,274 (19% of AGI, reported on 59.6% of returns)
Here:
$26,274
State:
$22,960
Here:
18.6% of AGI
State:
23.3% of AGI
(% of AGI for various income ranges: 16.4% for AGIs below $10k, 21.9% for AGIs $10k-25k, 20.2% for AGIs $25k-50k, 20.0% for AGIs $50k-75k, 21.0% for AGIs $75k-100k, 15.6% for AGIs over 100k)
Charity contributions deductions: $4,105 (3% of AGI, reported on 56.9% of returns)
Here:
$4,105
State:
$4,031
Here:
2.8% of AGI
State:
3.9% of AGI
(% of AGI for various income ranges: 2.5% for AGIs $10k-25k, 2.3% for AGIs $25k-50k, 3.2% for AGIs $50k-75k, 2.9% for AGIs $75k-100k, 2.4% for AGIs over 100k)
Total tax: $17,878 (reported on 83.8% of returns)
21013:
$17,878
State:
$10,167
(% of AGI for various income ranges: 5.2% for AGIs below $10k, 5.2% for AGIs $10k-25k, 7.4% for AGIs $25k-50k, 9.1% for AGIs $50k-75k, 10.4% for AGIs $75k-100k, 18.8% for AGIs over 100k)
Earned income credit: $1,288 (reported on 2.3% of returns)
Here:
$1,288
State:
$1,700
Percentage of individuals using paid preparers for their 2004 taxes: 54.7%
Here:
55%
State:
55%
(% for various income ranges: 47.7% for AGIs below $10k, 49.0% for AGIs $10k-25k, 55.6% for AGIs $25k-50k, 58.8% for AGIs $50k-75k, 56.5% for AGIs $75k-100k, 58.6% for AGIs over 100k)
Household received Food Stamps/SNAP in the past 12 months: 12 Household did not receive Food Stamps/SNAP in the past 12 months: 1,841
Women who had a birth in the past 12 months: 60 (60 now married, 0 unmarried) Women who did not have a birth in the past 12 months: 852 (494 now married, 357 unmarried)
Housing units in zip code 21013 with a mortgage: 1,160 (138 second mortgage, 130 both second mortgage and home equity loan) Houses without a mortgage: 52
Median monthly owner costs for units with a mortgage: $2,856 Median monthly owner costs for units without a mortgage: $740
Residents with income below the poverty level in 2022:
This zip code:
3.6%
Whole state:
9.6%
Residents with income below 50% of the poverty level in 2022:
This zip code:
1.3%
Whole state:
4.7%
Median number of rooms in houses and condos:
Here:
10.0
State:
7.3
Median number of rooms in apartments:
Here:
9.8
State:
4.2
Notable locations in this zip code not listed on our city pages
In group quarters: 8 (-1 institutionalized population)
Size of family households: 744 2-persons, 400 3-persons, 232 4-persons, 125 5-persons, 67 6-persons
Size of nonfamily households: 202 1-person, 72 2-persons, 18 4-persons
955 married couples with children.
211 single-parent households (172 men, 39 women).
93.3% of residents of 21013 zip code speak English at home.
0.9% of residents speak Spanish at home (45% very well, 34% well, 21% not well).
4.0% of residents speak other Indo-European language at home (88% very well, 12% well).
1.0% of residents speak Asian or Pacific Island language at home (73% very well, 27% not well).
0.2% of residents speak other language at home (100% very well).
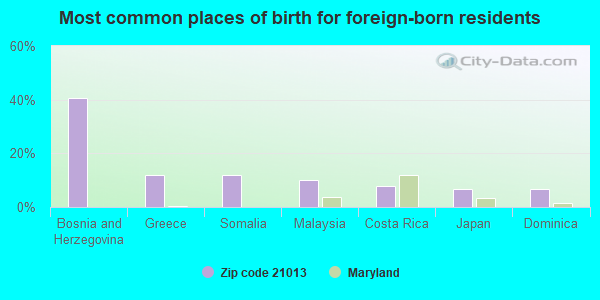
Foreign born population: 150 (2.8%) (93.7% of them are naturalized citizens)
This zip code:
2.8%
Whole state:
16.7%
41%Bosnia and Herzegovina
12%Greece
12%Somalia
10%Malaysia
8%Costa Rica
7%Japan
7%Dominica
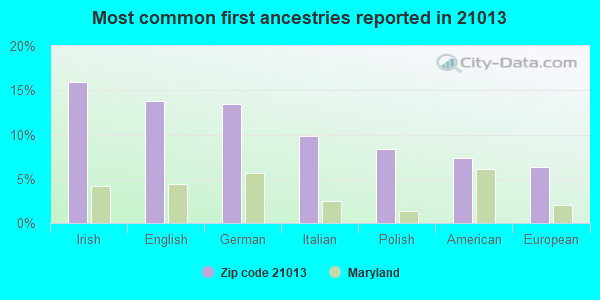
16%Irish
14%English
13%German
10%Italian
8%Polish
7%American
6%European
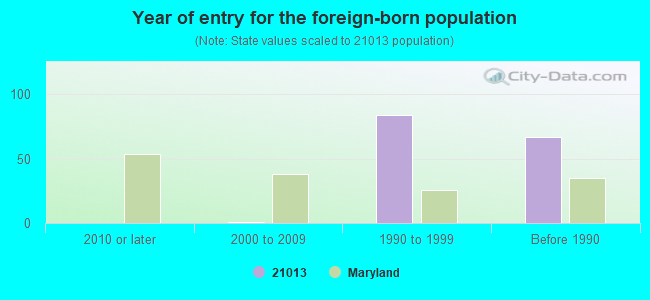
Year of entry for the foreign-born population
02010 or later
12000 to 2009
841990 to 1999
67Before 1990
Public elementary/middle school in in zip code 21013 not listed on the city page:
Facilities with environmental interests located in this zip code:
CARROLL MANOR ELEMENTARY SCHOOL (4434 CARROLL MANOR ROAD in BALDWIN, MD)
AIR MINOR (AIRS/AFS) STATE MASTER (Maryland Air Emissions Database) - AIR MINOR (National Center for Education Statistics) - STATE ID-031001 Small Quantity Generators, between 100 kg and 1000 kg of hazardous waste/month (Resource Conservation and Recovery Act (tracking hazardous waste)) - notification Business SIC classification: ELEMENTARY AND SECONDARY SCHOOLS Organizations: BALTIMORE COUNTY PUBLIC SCHOOLS (CONTACT/OWNER)
EXECUTIVE AUTO & PAINT REPAIR (13580 FORK RD in BALDWIN, MD)
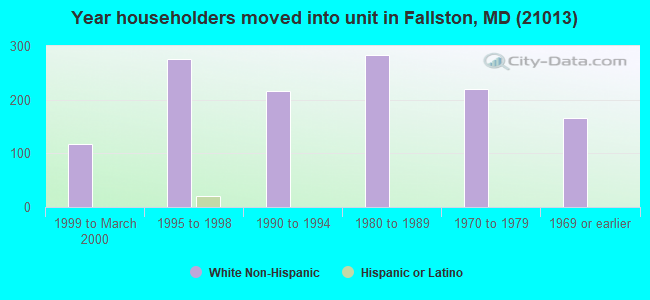
74% of the 21013 zip code residents lived in the same house 5 years ago. Out of people who lived in different houses, 40% lived in this county. Out of people who lived in different counties, 50% lived in Maryland.
96% of the 21013 zip code residents lived in the same house 1 year ago. Out of people who lived in different houses, 60% moved from this county. Out of people who lived in different houses, 34% moved from different county within same state. Out of people who lived in different houses, 8% moved from different state. Out of people who lived in different houses, 15% moved from abroad.
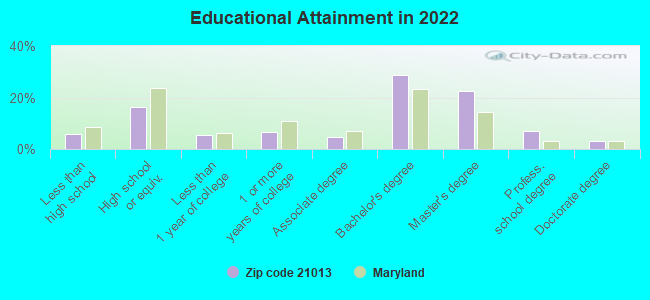
Private vs. public school enrollment:
Students in private schools in grades 1 to 8 (elementary and middle school): 79
Here:
19.9%
Maryland:
15.2%
Students in private schools in grades 9 to 12 (high school): 107
Here:
33.6%
Maryland:
14.4%
Students in private undergraduate colleges: 37
Here:
22.3%
Maryland:
20.2%
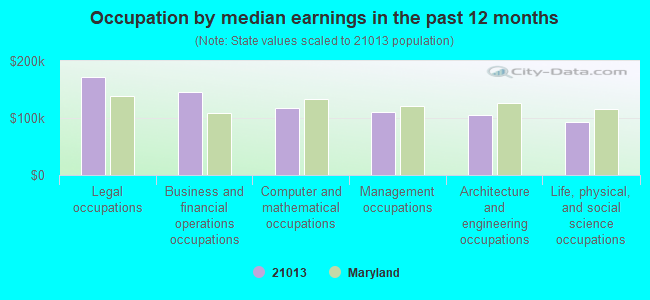
Occupation by median earnings in the past 12 months ($)
172,700Legal occupations
145,009Business and financial operations occupations
117,222Computer and mathematical occupations
110,301Management occupations
104,944Architecture and engineering occupations
93,581Life, physical, and social science occupations
Companies with federal contracts located in this zip code:
BOGNI ANTONIO (VIA VIVALDI 1 in GALLARATE, In; small business) : $1,646,239 in 75 contractsfrom 2000 to 2006
Contracts for Other ADP and Telecommunications Services (includes data storage on tapes, compact disks, etc.), Installation of Equipment -- Communication, Detection, and Coherent Radiation Equipment by Office of Assistant Secretary for Health except national centers (disused code), Office of Assistant Secretary for Management and Budget, Office of Assistant Secretary for Legislation Signed by year:2000: $161,000; 2001: $419,000; 2002: $412,449; 2003: $170,785; 2004: $143,222; 2005: $143,222; 2006: $196,561.
Biggest contracts:
$143,222 with Office of Assistant Secretary for Health except national centers (disused code) for Other ADP and Telecommunications Services (includes data storage on tapes, compact disks, etc.). Taking place in DC. Signed on 2005-06-23. Completion date: 2006-06-26.
$143,222, same as above.Signed on 2004-06-26. Completion date: 2004-06-26.
$139,050, same as above.Signed on 2003-08-15. Completion date: 2004-06-15.
$135,000 with Office of Assistant Secretary for Management and Budget for Other ADP and Telecommunications Services (includes data storage on tapes, compact disks, etc.). Taking place in DC. Signed on 2002-09-15. Completion date: 2003-06-15.
ROBERT N SCHUMACHER (2801 PARK ROAD in BALDWIN, MD; small business) : $279,160 in 5 contractsfrom 2001 to 2005
Contracts for Scientific Data Studies by Army Signed by year:2000: $0; 2001: $52,920; 2002: $55,000; 2003: $56,040; 2004: $57,080; 2005: $58,120; 2006: $0.
Biggest contracts:
$58,120 with Army for Scientific Data Studies. Signed on 2005-11-04. Completion date: 2006-12-31.
$57,080, same as above.Signed on 2004-11-23. Completion date: 2005-12-31.
$56,040, same as above.Signed on 2003-11-10. Completion date: 2003-12-31.
$55,000, same as above.Signed on 2002-11-27. Completion date: 2003-12-31.
WRIGHT, JAMES (14103 BALDWIN MILL ROAD in BALDWIN, MD; small business)
$3,366 with Navy for Other Social Services. Signed on 2004-12-13. Completion date: 2004-12-31.
Top industries in this zip code by the number of employees in 2005:
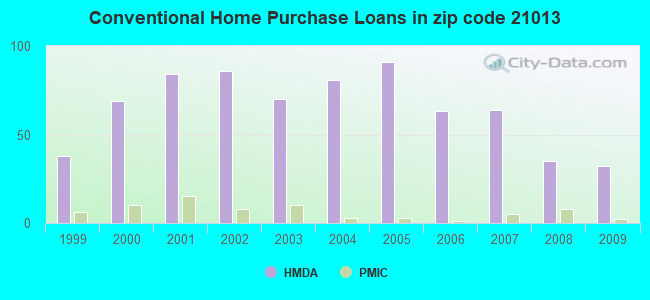
Detailed PMIC statistics for the following Tracts:3042.01
, 4112.01
2002 - 2018 National Fire Incident Reporting System (NFIRS) incidents
According to the data from the years 2002 - 2018 the average number of fires per year is 8. The highest number of reported fires - 14 took place in 2008, and the least - 1 in 2011. The data has a dropping trend.
When looking into fire subcategories, the most reports belonged to: Structure Fires (45.9%), and Outside Fires (35.3%).
Fire incident types reported to NFIRS in Zip Code 21013


 Nearest zip codes: 21082, 21051, 21047, 21057, 21131, 21087.


 (Location: 4434 CARROLL MANOR RD, Grades: KG-5)


 According to the data from the years 2002 - 2018 the average number of fires per year is 8. The highest number of reported fires - 14 took place in 2008, and the least - 1 in 2011. The data has a dropping trend.
 When looking into fire subcategories, the most reports belonged to: Structure Fires (45.9%), and Outside Fires (35.3%).