Estimated zip code population in 2022: 10,634 Zip code population in 2010: 10,438 Zip code population in 2000: 8,273
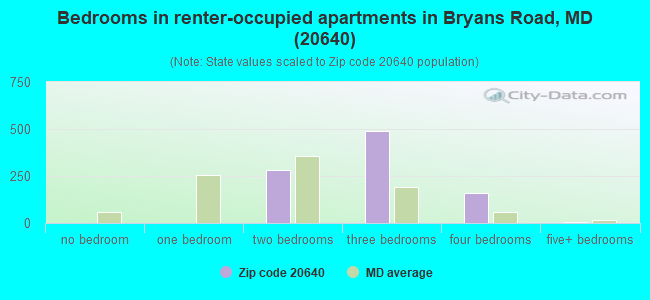
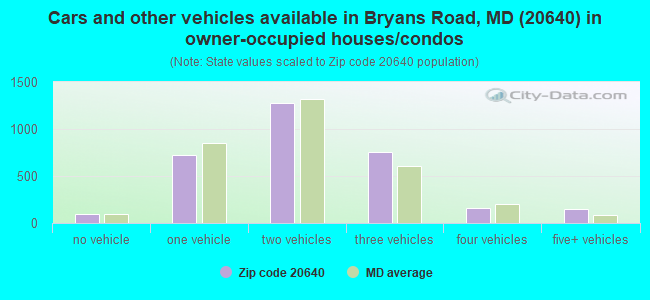
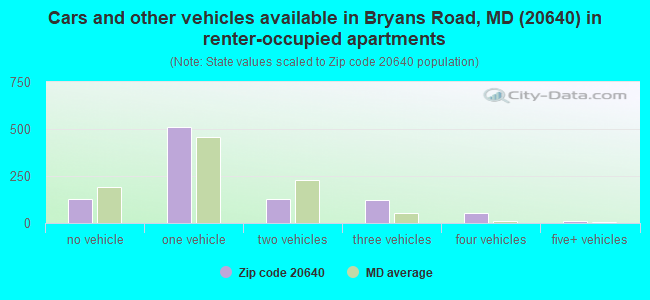
Houses and condos: 4,359 Renter-occupied apartments: 954
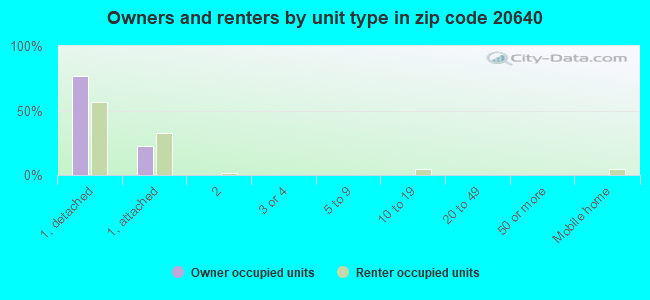
% of renters here:
23%
State:
32%
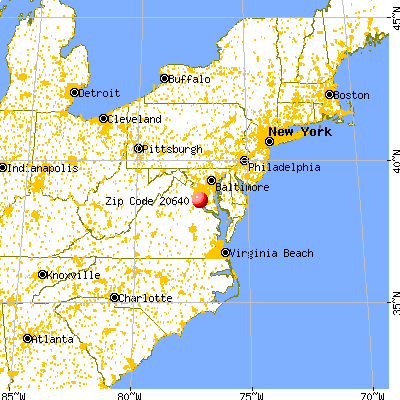
March 2022 cost of living index in zip code 20640: 159.6 (very high, U.S. average is 100)
Land area: 41.7 sq. mi. Water area: 7.1 sq. mi.
Population density: 255 people per square mile
(very low).
OSM Map
General Map
Google Map
MSN Map
OSM Map
General Map
Google Map
MSN Map
OSM Map
General Map
Google Map
MSN Map
OSM Map
General Map
Google Map
MSN Map
Please wait while loading the map...
Real estate property taxes paid for housing units in 2022:
This zip code:
1.0% ($2,959)
Maryland:
0.9% ($3,777)
Median real estate property taxes paid for housing units with mortgages in 2022: $3,072 (0.9%) Median real estate property taxes paid for housing units with no mortgage in 2022: $2,701 (1.2%)
Averages for the 2020 tax year for zip code 20640, filed in 2021:
Average Adjusted Gross Income (AGI) in 2020: $62,873 (Individual Income Tax Returns)
Here:
$62,873
State:
$86,905
Salary/wage: $58,572 (reported on 83.6% of returns)
Here:
$58,572
State:
$73,953
(% of AGI for various income ranges: 1267.3% for AGIs below $25k, 3669.6% for AGIs $25k-50k, 6711.5% for AGIs $50k-75k, 9704.7% for AGIs $75k-100k, 18825.4% for AGIs $100k-200k, 52641.7% for AGIs over 200k)
Taxable interest for individuals: $730 (reported on 26.3% of returns)
This zip code:
$730
Maryland:
$1,528
(% of AGI for various income ranges: 5.1% for AGIs below $25k, 10.2% for AGIs $25k-50k, 25.4% for AGIs $50k-75k, 52.8% for AGIs $75k-100k, 77.2% for AGIs $100k-200k, 173.3% for AGIs over 200k)
Ordinary dividends: $2,237 (reported on 8.6% of returns)
Here:
$2,237
State:
$8,028
(% of AGI for various income ranges: 2.7% for AGIs below $25k, 3.9% for AGIs $25k-50k, 19.8% for AGIs $50k-75k, 33.6% for AGIs $75k-100k, 99.6% for AGIs $100k-200k, 321.7% for AGIs over 200k)
Net capital gain/loss in AGI: +$5,212 (reported on 8.6% of returns)
Here:
+$5,212
State:
+$25,238
(% of AGI for various income ranges: 0.8% for AGIs below $25k, 4.7% for AGIs $25k-50k, 28.0% for AGIs $50k-75k, 45.3% for AGIs $75k-100k, 123.3% for AGIs $100k-200k, 2138.3% for AGIs over 200k)
Profit/loss from business: +$1,727 (reported on 15.6% of returns)
Here:
+$1,727
State:
+$11,398
(% of AGI for various income ranges: 19.3% for AGIs below $25k, 13.5% for AGIs $100k-200k, 2523.3% for AGIs over 200k)
Taxable individual retirement arrangement distribution: $10,884 (reported on 5.0% of returns)
20640:
$10,884
Maryland:
$20,944
(% of AGI for various income ranges: 18.2% for AGIs below $25k, 29.7% for AGIs $25k-50k, 67.2% for AGIs $50k-75k, 147.5% for AGIs $75k-100k, 278.0% for AGIs $100k-200k)
Total itemized deductions: $28,566 (reported on 21.4% of returns)
Here:
$28,566
State:
$30,672
(% of AGI for various income ranges: 97.2% for AGIs below $25k, 247.7% for AGIs $25k-50k, 902.6% for AGIs $50k-75k, 1544.2% for AGIs $75k-100k, 2469.8% for AGIs $100k-200k, 7581.7% for AGIs over 200k)
Charity contributions: $8,264 (reported on 17.8% of returns)
Here:
$8,264
State:
$9,065
(% of AGI for various income ranges: 8.4% for AGIs below $25k, 55.3% for AGIs $25k-50k, 253.6% for AGIs $50k-75k, 339.7% for AGIs $75k-100k, 608.0% for AGIs $100k-200k, 1880.0% for AGIs over 200k)
Taxes paid: $8,025 (reported on 21.4% of returns)
20640:
$8,025
State:
$8,475
(% of AGI for various income ranges: 14.9% for AGIs below $25k, 60.6% for AGIs $25k-50k, 255.6% for AGIs $50k-75k, 490.0% for AGIs $75k-100k, 770.9% for AGIs $100k-200k, 1558.3% for AGIs over 200k)
Earned income credit: $2,173 (reported on 15.4% of returns)
Here:
$2,173
State:
$2,151
(% of AGI for various income ranges: 89.3% for AGIs below $25k, 69.7% for AGIs $25k-50k)
Percentage of individuals using paid preparers for their 2020 taxes: 90.2%
Here:
90%
State:
90%
(% for various income ranges: 89.9% for AGIs below $25k, 91.6% for AGIs $25k-50k, 90.1% for AGIs $50k-75k, 88.9% for AGIs $75k-100k, 90.0% for AGIs $100k-200k, 87.5% for AGIs over 200k)
Averages for the 2012 tax year for zip code 20640, filed in 2013:
Average Adjusted Gross Income (AGI) in 2012: $57,119 (Individual Income Tax Returns)
Here:
$57,119
State:
$72,703
Salary/wage: $53,838 (reported on 85.9% of returns)
Here:
$53,838
State:
$62,228
(% of AGI for various income ranges: 79.0% for AGIs below $25k, 81.7% for AGIs $25k-50k, 81.7% for AGIs $50k-75k, 80.7% for AGIs $75k-100k, 84.3% for AGIs $100k-200k, 70.4% for AGIs over 200k)
Taxable interest for individuals: $683 (reported on 31.8% of returns)
This zip code:
$683
Maryland:
$1,413
(% of AGI for various income ranges: 0.4% for AGIs below $25k, 0.3% for AGIs $25k-50k, 0.5% for AGIs $50k-75k, 0.6% for AGIs $75k-100k, 0.3% for AGIs $100k-200k, 0.3% for AGIs over 200k)
Ordinary dividends: $2,116 (reported on 9.6% of returns)
Here:
$2,116
State:
$6,933
(% of AGI for various income ranges: 0.2% for AGIs below $25k, 0.2% for AGIs $25k-50k, 0.2% for AGIs $50k-75k, 0.3% for AGIs $75k-100k, 0.5% for AGIs $100k-200k, 0.7% for AGIs over 200k)
Net capital gain/loss in AGI: +$1,185 (reported on 5.5% of returns)
Here:
+$1,185
State:
+$14,830
(% of AGI for various income ranges: 1.3% for AGIs over 200k)
Profit/loss from business: +$281 (reported on 12.6% of returns)
Here:
+$281
State:
+$12,606
(% of AGI for various income ranges: 2.8% for AGIs below $25k)
Taxable individual retirement arrangement distribution: $8,782 (reported on 4.7% of returns)
20640:
$8,782
Maryland:
$17,065
(% of AGI for various income ranges: 0.8% for AGIs below $25k, 0.6% for AGIs $25k-50k, 1.0% for AGIs $50k-75k, 0.8% for AGIs $75k-100k, 0.8% for AGIs $100k-200k)
Total itemized deductions: $24,562 (28% of AGI, reported on 45.4% of returns)
Here:
$24,562
State:
$27,886
Here:
27.6% of AGI
State:
22.8% of AGI
(% of AGI for various income ranges: 9.9% for AGIs below $25k, 15.0% for AGIs $25k-50k, 20.4% for AGIs $50k-75k, 21.9% for AGIs $75k-100k, 22.7% for AGIs $100k-200k, 18.5% for AGIs over 200k)
Charity contributions: $4,279 (reported on 38.4% of returns)
Here:
$4,279
State:
$4,452
(% of AGI for various income ranges: 1.3% for AGIs below $25k, 2.5% for AGIs $25k-50k, 2.9% for AGIs $50k-75k, 3.0% for AGIs $75k-100k, 3.2% for AGIs $100k-200k, 3.4% for AGIs over 200k)
Taxes paid: $8,738 (reported on 45.4% of returns)
20640:
$8,738
State:
$11,690
(% of AGI for various income ranges: 2.3% for AGIs below $25k, 3.9% for AGIs $25k-50k, 6.8% for AGIs $50k-75k, 7.9% for AGIs $75k-100k, 8.9% for AGIs $100k-200k, 7.9% for AGIs over 200k)
Earned income credit: $2,199 (reported on 17.5% of returns)
Here:
$2,199
State:
$2,199
(% of AGI for various income ranges: 6.7% for AGIs below $25k, 1.2% for AGIs $25k-50k)
Percentage of individuals using paid preparers for their 2012 taxes: 48.0%
Here:
48%
State:
52%
(% for various income ranges: 43.8% for AGIs below $25k, 46.7% for AGIs $25k-50k, 50.6% for AGIs $50k-75k, 53.8% for AGIs $75k-100k, 50.0% for AGIs $100k-200k, 60.0% for AGIs over 200k)
Averages for the 2004 tax year for zip code 20640, filed in 2005:
Average Adjusted Gross Income (AGI) in 2004: $44,464 (Individual Income Tax Returns)
Here:
$44,464
State:
$60,339
Salary/wage: $42,340 (reported on 86.5% of returns)
Here:
$42,340
State:
$52,211
(% of AGI for various income ranges: 95.4% for AGIs below $10k, 80.4% for AGIs $10k-25k, 81.0% for AGIs $25k-50k, 81.3% for AGIs $50k-75k, 86.5% for AGIs $75k-100k, 82.2% for AGIs over 100k)
Taxable interest for individuals: $988 (reported on 39.6% of returns)
This zip code:
$988
Maryland:
$1,701
(% of AGI for various income ranges: 1.8% for AGIs below $10k, 0.8% for AGIs $10k-25k, 0.8% for AGIs $25k-50k, 1.1% for AGIs $50k-75k, 0.5% for AGIs $75k-100k, 1.0% for AGIs over 100k)
Taxable dividends: $2,111 (reported on 11.1% of returns)
Here:
$2,111
State:
$4,235
(% of AGI for various income ranges: 0.3% for AGIs below $10k, 0.4% for AGIs $10k-25k, 0.2% for AGIs $25k-50k, 0.2% for AGIs $50k-75k, 0.5% for AGIs $75k-100k, 1.2% for AGIs over 100k)
Net capital gain/loss: +$4,849 (reported on 8.1% of returns)
Here:
+$4,849
State:
+$15,888
(% of AGI for various income ranges: -0.0% for AGIs below $10k, -0.1% for AGIs $10k-25k, 0.0% for AGIs $25k-50k, 0.4% for AGIs $50k-75k, 0.3% for AGIs $75k-100k, 2.7% for AGIs over 100k)
Profit/loss from business: +$3,267 (reported on 10.8% of returns)
Here:
+$3,267
State:
+$12,221
(% of AGI for various income ranges: 7.6% for AGIs below $10k, 0.7% for AGIs $10k-25k, 0.3% for AGIs $25k-50k, 0.9% for AGIs $50k-75k, -0.1% for AGIs $75k-100k, 1.3% for AGIs over 100k)
IRA payment deduction: $2,391 (reported on 1.4% of returns)
20640:
$2,391
Maryland:
$2,968
Total itemized deductions: $19,169 (27% of AGI, reported on 42.8% of returns)
Here:
$19,169
State:
$22,960
Here:
27.1% of AGI
State:
23.3% of AGI
(% of AGI for various income ranges: 7.1% for AGIs below $10k, 8.4% for AGIs $10k-25k, 17.7% for AGIs $25k-50k, 20.0% for AGIs $50k-75k, 22.0% for AGIs $75k-100k, 20.0% for AGIs over 100k)
Charity contributions deductions: $3,659 (5% of AGI, reported on 38.4% of returns)
Here:
$3,659
State:
$4,031
Here:
5.1% of AGI
State:
3.9% of AGI
(% of AGI for various income ranges: 0.7% for AGIs below $10k, 1.3% for AGIs $10k-25k, 3.1% for AGIs $25k-50k, 3.3% for AGIs $50k-75k, 3.7% for AGIs $75k-100k, 3.6% for AGIs over 100k)
Total tax: $5,252 (reported on 77.5% of returns)
20640:
$5,252
State:
$10,167
(% of AGI for various income ranges: 2.1% for AGIs below $10k, 3.9% for AGIs $10k-25k, 6.1% for AGIs $25k-50k, 8.8% for AGIs $50k-75k, 9.5% for AGIs $75k-100k, 14.1% for AGIs over 100k)
Earned income credit: $1,746 (reported on 15.4% of returns)
Here:
$1,746
State:
$1,700
Percentage of individuals using paid preparers for their 2004 taxes: 55.7%
Here:
56%
State:
55%
(% for various income ranges: 47.8% for AGIs below $10k, 59.8% for AGIs $10k-25k, 55.5% for AGIs $25k-50k, 59.1% for AGIs $50k-75k, 54.0% for AGIs $75k-100k, 51.7% for AGIs over 100k)
Likely homosexual households (counted as self-reported same-sex unmarried-partner households)
Lesbian couples: 0.3% of all households
Gay men: 0.0% of all households
Household received Food Stamps/SNAP in the past 12 months: 499 Household did not receive Food Stamps/SNAP in the past 12 months: 3,623
Women who had a birth in the past 12 months: 86 (80 now married, 6 unmarried) Women who did not have a birth in the past 12 months: 2,646 (1,046 now married, 1,600 unmarried)
Housing units in zip code 20640 with a mortgage: 2,294 (172 second mortgage, 162 both second mortgage and home equity loan) Houses without a mortgage: 20
Median monthly owner costs for units with a mortgage: $1,940 Median monthly owner costs for units without a mortgage: $566
Residents with income below the poverty level in 2022:
This zip code:
9.4%
Whole state:
9.6%
Residents with income below 50% of the poverty level in 2022:
This zip code:
3.9%
Whole state:
4.7%
Median number of rooms in houses and condos:
Here:
7.1
State:
7.3
Median number of rooms in apartments:
Here:
5.7
State:
4.2
Notable locations in this zip code not listed on our city pages
Notable locations in zip code 20640: Poseys Wharf (A), Grinders Wharf (B), Indian Head Wastewater Treatment Plant (C), Charles County Sanitary Landfill (D), Proctors Wharf (E), Point Landing (F), Potomac Heights Company 7 Fire Station (G), Naval Surface Warfare Center Fire and Emergency (H), Charles County Public Library - Potomac Branch (I), Government Smallwood House (J), Indian Head Town Hall (K), Glynmont Branch Charles County Public Library (L), Indian Head Volunteer Fire Department and Rescue Squad Incorporated (M), Potomac Heights Volunteer Fire Department and Rescue Squad Incorporated (N). Display/hide their locations on the map
Churches in zip code 20640 include: Alexandria Church (A), Chicamuxen Church (B), Glymont Flint Church (C), Greater Spiritual Fellowship Community Church (D), Metropolitan Church (E), Pleasant Grove Church (F), Saint Charles Church (G), Saint Johns Chapel (H), Saint Marys Church (I). Display/hide their locations on the map
Cemeteries: Park Hill Cemetery (1), Alexandria Cemetery (2), Chicamuxen Cemetery (3), Smith Chapel Cemetery (4), Saint Charles Cemetery (5), Pleasant Grove Cemetery (6), Pisgah Cemetery (7). Display/hide their locations on the map
Streams, rivers, and creeks: Chicamuxen Creek (A), Mattawoman Creek (B), Marbury Run (C), Reeder Run (D), Pomonkey Creek (E), Jane Berrys Run (F), Harrison Cut (G). Display/hide their locations on the map
Parks in zip code 20640 include: Smallwood State Park (1), Diffenbach Court Park (2), Ruth B Swan Memorial Park (3), Mattawoman State Natural Environmental Area (4). Display/hide their locations on the map
In group quarters: 102 (-1 institutionalized population)
Size of family households: 821 2-persons, 739 3-persons, 430 4-persons, 321 5-persons, 118 6-persons, 99 7-or-more-persons
Size of nonfamily households: 1,338 1-person, 249 2-persons
1,485 married couples with children.
687 single-parent households (310 men, 377 women).
92.4% of residents of 20640 zip code speak English at home.
1.3% of residents speak Spanish at home (91% very well, 6% well, 3% not well).
1.8% of residents speak other Indo-European language at home (88% very well, 5% well, 6% not well).
1.8% of residents speak Asian or Pacific Island language at home (49% very well, 41% well, 10% not well).
1.5% of residents speak other language at home (100% very well).
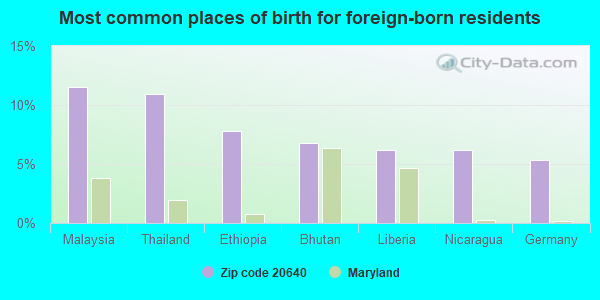
Foreign born population: 486 (4.6%) (69.4% of them are naturalized citizens)
This zip code:
4.6%
Whole state:
16.7%
12%Malaysia
11%Thailand
8%Ethiopia
7%Bhutan
6%Liberia
6%Nicaragua
5%Germany
14%English
5%American
2%Irish
1%Italian
1%German
1%European
1%Jamaican
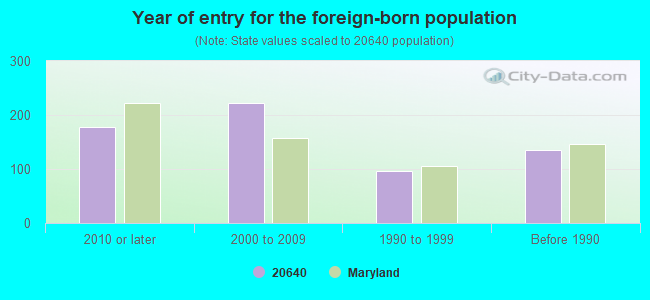
Year of entry for the foreign-born population
1782010 or later
2222000 to 2009
961990 to 1999
136Before 1990
Facilities with environmental interests located in this zip code:
NAVAL SURFACE WARFARE CENTER INDIAN HEAD DIVISION (101 STRAUSS AVENUE in INDIAN HEAD, MD) . Federal Facility. U.S. NAVY
AIR MAJOR (AIRS/AFS) OIL CONTROL (Facility Response Plan for oil discharge) ENFORCEMENT/COMPLIANCE ACTIVITY (Integrated Compliance Information System) - ICIS-03-1995-0201, FORMAL ENFORCEMENT ACTION, ICIS-03-2000-0668, (Integrated Compliance Information System) - ICIS-03-1995-0201, FORMAL ENFORCEMENT ACTION, ICIS-03-2000-0668, STATE MASTER (Maryland Permits tracking) - INCINERATOR, NPDES MAJOR, OIL CONTROL STATE MASTER (Maryland Air Emissions Database) - AIR MAJOR COMPLIANCE ACTIVITY (Tracking inspections of insecticide, fungicide, and rodenticide, and toxic substances) CRITERIA AND HAZARDOUS AIR POLLUTANT INVENTORY (Inventory of air pollution sources) National Pollutant Discharge Elimination System MAJOR (Tracking pollutant discharge elimination systems) - permit National Pollutant Discharge Elimination System MAJOR (Tracking pollutant discharge elimination systems) - permit HAZARDOUS WASTE BIENNIAL REPORTER (Resource Conservation and Recovery Act (tracking hazardous waste)) Large Quantity Generators, more that 1000 kg of hazardous waste/month (Resource Conservation and Recovery Act (tracking hazardous waste)) - notification TSD (Resource Conservation and Recovery Act (tracking hazardous waste)) - notification COMMUNITY WATER SYSTEM (SDWIS) - SDWIS-MD0080058 1, WATER TREATMENT PLANT, SDWIS-MD0080058 2, SDWIS-MD0080058 3, SDWIS-MD0080058 4, SDWIS-MD0080058 6, TRI REPORTER (Tracking of toxic chemicals releasing facilities) Business SIC classification: INDUSTRIAL ORGANIC CHEMICALS; AMMUNITION, EXCEPT FOR SMALL ARMS; SERVICES; GENERAL GOVERNMENT; NATIONAL SECURITY Business NAICS classification: ALL OTHER MISCELLANEOUS CHEMICAL PRODUCT AND PREPARATION MANUFACTURING.; NATIONAL SECURITY. Organizations: DEPARTMENT OF THE NAVY (CONTACT/GENERAL)
, IHDIVNAVSURFWARCEN (CONTACT/OPERATOR)
, NAVAL DISTRICT WASHINGTON (CONTACT/OWNER)
Alternative names: INDIAN HEAD DIVISION, N.S.W.C., INDIAN HEAD DIV-NAVAL SURFACE WAREFARE, INDIAN HEAD DIVISION, NAVAL SURFACE WARFARE CENTER, INDIAN HEAD NAVAL SURFACE WARFARE CENTER, NAVAL DISRTICT WASHINGTON-INDIAN HEAD, NAVAL DISTRICT WASHINGTON, INDIAN HEAD , NAVAL ORDNANCE STATION, NAVAL ORDNANCE STATION INDIAN HEAD, NAVAL SURFACE INCINERATOR, NAVAL SURFACE WARFARE CNTR-INDIAN HD, NAVAL SURFACE WARFARE CENTER - INDIAN HEAD, NAVAL SURFACE WARFARE CENTER - (NEODTC), U S NAVY INDIAN HEAD DIVISION NAVAL SURFACE WARFARE CENTER, U.S. NAVY NAVAL SURFACE WARFARE CENTER INDIAN HEAD DIV., U.S. NAVY - NAVAL WARFARE CENTER, US NAVAL ORDNANCE STATION, US NAVY
LACKEY SENIOR HIGH (3000 CHICAMUXEN ROAD in INDIAN HEAD, MD)
AIR MINOR (AIRS/AFS) STATE MASTER (Maryland Permits tracking) - NPDES NON-MAJOR STATE MASTER (Maryland Air Emissions Database) - AIR MINOR COMPLIANCE ACTIVITY (Tracking inspections of insecticide, fungicide, and rodenticide, and toxic substances) (National Center for Education Statistics) - STATE ID-081002 National Pollutant Discharge Elimination System NON-MAJOR (Tracking pollutant discharge elimination systems) - permit Business SIC classification: ELEMENTARY AND SECONDARY SCHOOLS Organizations: CHARLES CO BOARD OF EDUCATION (CONTACT/OWNER)
, CHARLES COUNTY BOARD OF EDUCATION (SCHOOL DISTRICT)
Alternative names: CHARLES COUNTY BD. OF EDUC., LACKEY HIGH SCHOOL, LACKEY HIGH SCHOOL WWTP
MARYLAND ROCK INDUSTRIES GOOSE BAY PLANT (7210 RIVERSIDE ROAD in INDIAN HEAD, MD)
AIR MINOR (AIRS/AFS) STATE MASTER (Maryland Permits tracking) - National Pollutant Discharge Elimination System Permit, OIL CONTROL, SEWAGE SLUDGE UTILIZATION STATE MASTER (Maryland Air Emissions Database) - AIR MAJOR Business SIC classification: CONSTRUCTION SAND AND GRAVEL; ASPHALT PAVING MIXTURES AND BLOCKS Alternative names: MARYLAND ROCK INDUSTRIES - GOOSE BAY PLANT (CH-152)
PISGAH LANDFILL (ROUTE 425 in INDIAN HEAD, MD)
AIR MINOR (AIRS/AFS) STATE MASTER (Maryland Air Emissions Database) - AIR MINOR Business SIC classification: REFUSE SYSTEMS
POMONKEY REPAIR SHOP (HENSON ROAD in INDIAN HEAD, MD)
AIR MINOR (AIRS/AFS) STATE MASTER (Maryland Air Emissions Database) - AIR MINOR Business SIC classification: REPAIR SHOPS AND RELATED SERVICES
POTOMAC HEIGHTS CHRISTIAN ADMY (37 GLYMONT RD in INDIAN HEAD, MD)
(Integrated Compliance Information System) - ICIS-03-1989-0697, FORMAL ENFORCEMENT ACTION COMPLIANCE ACTIVITY (Tracking inspections of insecticide, fungicide, and rodenticide, and toxic substances) Business SIC classification: ELEMENTARY AND SECONDARY SCHOOLS Alternative names: POTOMAC HEIGHTS CHRISTIAN ACADEMY, POTOMAC HEIGHTS CHRISTIAN SCHOOL
LBM INC (NAVAL ORDINANCE STAT BLDG 290 in INDIAN HEAD, MD) . Federal Facility. UNDETERMINED OR UNKNOWN AGENCY AFFILIATION
Small Quantity Generators, between 100 kg and 1000 kg of hazardous waste/month (Resource Conservation and Recovery Act (tracking hazardous waste)) - notification Organizations: OPERNAME (CONTACT/OPERATOR)
, US GOVT (CONTACT/OWNER)
MCWILLIAMS FORD LTD (1012 N STRAUSS AVE in INDIAN HEAD, MD)
Small Quantity Generators, between 100 kg and 1000 kg of hazardous waste/month (Resource Conservation and Recovery Act (tracking hazardous waste)) - notification Organizations: JOHN H MCWILLIAMS JR (CONTACT/OWNER)
Housing units lacking complete plumbing facilities: 0.4% Housing units lacking complete kitchen facilities: 0.4%
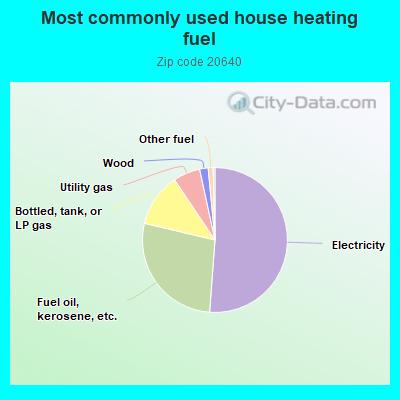
51.2%Electricity
27.5%Fuel oil, kerosene, etc.
11.9%Bottled, tank, or LP gas
6.0%Utility gas
1.9%Wood
1.1%Other fuel
Population in 1990: 8,227. Population change in the 1990s: +46 (+0.6%).
Place of birth for U.S.-born residents:
This state: 4,972
Northeast: 823
Midwest: 416
South: 3,267
West: 385
64% of the 20640 zip code residents lived in the same house 5 years ago. Out of people who lived in different houses, 57% lived in this county. Out of people who lived in different counties, 50% lived in Maryland.
88% of the 20640 zip code residents lived in the same house 1 year ago. Out of people who lived in different houses, 43% moved from this county. Out of people who lived in different houses, 34% moved from different county within same state. Out of people who lived in different houses, 10% moved from different state. Out of people who lived in different houses, 13% moved from abroad.
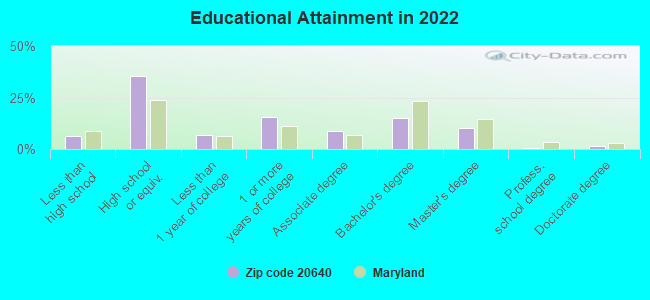
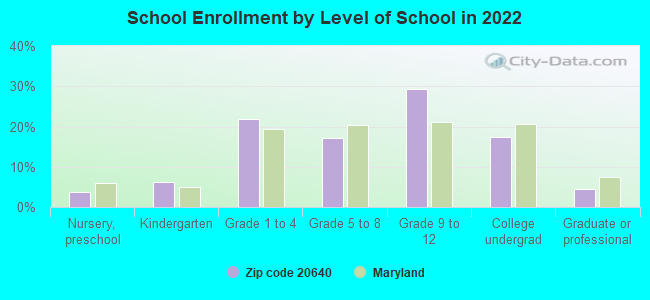
Private vs. public school enrollment:
Students in private schools in grades 1 to 8 (elementary and middle school): 139
Here:
12.8%
Maryland:
15.2%
Students in private schools in grades 9 to 12 (high school): 12
Here:
1.5%
Maryland:
14.4%
Students in private undergraduate colleges: 10
Here:
2.1%
Maryland:
20.2%
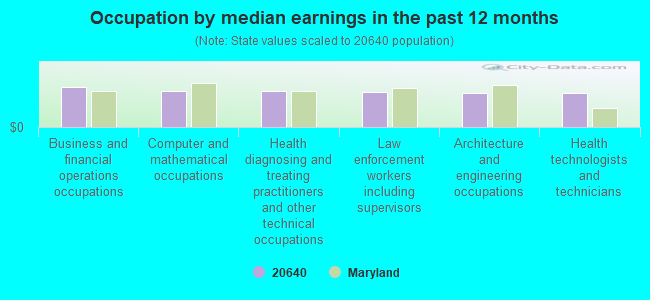
Occupation by median earnings in the past 12 months ($)
96,971Business and financial operations occupations
88,236Computer and mathematical occupations
87,656Health diagnosing and treating practitioners and other technical occupations
85,443Law enforcement workers including supervisors
83,392Architecture and engineering occupations
83,149Health technologists and technicians
Companies with federal contracts located in this zip code:
GARCIA INFORMATION SYSTEMS (4483 INDIAN HEAD HWY in INDIAN HEAD, MD; small business) : $1,212,036 in 10 contractsfrom 2001 to 2005
Contracts for Engineering and Technical Services, Technical Representation Services -- Miscellaneous by Navy Signed by year:2000: $0; 2001: $344,350; 2002: $727,810; 2003: $0; 2004: $140,191; 2005: -$315; 2006: $0.
Biggest contracts:
$347,500 with Navy for Engineering and Technical Services. Signed on 2002-04-04. Completion date: 2002-07-11.
$330,350, same as above.Signed on 2001-07-11. Completion date: 2002-07-11.
$124,000, same as above.Signed on 2002-02-26. Completion date: 2002-07-11.
$103,155, same as above.Signed on 2002-05-30. Completion date: 2002-11-01.
US NAVAL SEA SYSTEMS COMMAND ( in Indian Head, MD) : $772,645 in 7 contractsfrom 2000 to 2005
Contracts for Other ADP and Telecommunications Services (includes data storage on tapes, compact disks, etc.), Pyrotechnics, Maintenance, Repair and Rebuilding of Equipment -- Medical, Dental, and Veterinary Equipment and Supplies, Other Defense -- Applied Research and Exploratory Development (R&D) by U.S. Army Corps of Engineers - civil program financing only, NASA, Department of Veterans Affairs, Navy, and others Signed by year:2000: $585,311; 2001: $60,000; 2002: $0; 2003: $0; 2004: $127,334; 2005: $0; 2006: $0.
Biggest contracts:
$654,500 with U.S. Army Corps of Engineers - civil program financing only for Other ADP and Telecommunications Services (includes data storage on tapes, compact disks, etc.). Taking place in WA. Signed on 2000-01-27. Completion date: 2000-10-14.
$73,334 with NASA for Pyrotechnics. Signed on 2004-01-27. Completion date: 2005-09-30.
$60,000 with Department of Veterans Affairs for Maintenance, Repair and Rebuilding of Equipment -- Medical, Dental, and Veterinary Equipment and Supplies. Taking place in PA. Signed on 2001-04-15. Completion date: 2001-09-15.
$50,000 with NASA for Pyrotechnics. Signed on 2004-01-27. Completion date: 2005-09-30.
CARDILLO, SCOTT (4625 SMALLWOOD CHURCH RD in INDIAN HEAD, MD; small business) : $43,291 in 7 contractsfrom 2002 to 2006
Contracts for Cartridge and Propellant Actuated Devices and Components, Underwater Use Explosive Ordnance Disposal and Swimmer Weapons Systems Tools and Equipment by Navy Signed by year:2000: $0; 2001: $0; 2002: $14,253; 2003: $0; 2004: $655; 2005: $19,100; 2006: $9,283.
Biggest contracts:
$14,253 with Navy for Cartridge and Propellant Actuated Devices and Components. Signed on 2002-07-23. Completion date: 2002-11-21.
$10,400 with Navy for Underwater Use Explosive Ordnance Disposal and Swimmer Weapons Systems Tools and Equipment. Signed on 2005-03-12. Completion date: 2005-06-21.
$6,258 with Navy for Cartridge and Propellant Actuated Devices and Components. Signed on 2006-01-12. Completion date: 2006-02-09.
$4,800 with Navy for Underwater Use Explosive Ordnance Disposal and Swimmer Weapons Systems Tools and Equipment. Signed on 2005-06-13. Completion date: 2005-07-07.
PERFORMANCE SYSTEMS ENGINEERIN (3955 DONCASTER DRIVE in INDIAN HEAD, MD; small business)
$34,843 with Navy for ADP Components. Signed on 2000-03-25. Completion date: 2000-04-15.
LK SOLUTIONS, INC (13 DOVE TREE CT in INDIAN HEAD, MD; small business) : $10,510 in 4 contractsfrom 2005 to 2006
$8,728 with Army for Maintenance, Repair or Alteration of Real Property -- Other Administrative Facilities and Service Buildings. Taking place in VA. Signed on 2005-09-28. Completion date: 2005-10-21.
$6,790 with Army for Installation of Equipment -- Miscellaneous. Signed on 2005-09-29. Completion date: 2005-10-31.
$3,720 with Army for Custodial Janitorial Services. Signed on 2005-09-14. Completion date: 2005-09-28.
-$8,728 with Army for Maintenance, Repair or Alteration of Real Property -- Other Administrative Facilities and Service Buildings. Taking place in VA. Signed on 2006-02-15. Completion date: 2005-10-21.
DIGGING & RIGGING SERVICES (3600 LAUREL DRIVE in INDIAN HEAD, MD; small business)
$2,850 with Navy for Maintenance, Repair and Rebuilding of Equipment -- Construction, Mining, Excavating, and Highway Maintenance Equipment. Signed on 2002-11-02. Completion date: 2003-01-02.
Top industries in this zip code by the number of employees in 2005:
Educational Services: Elementary and Secondary Schools (20-49: 2)
Other Services (except Public Administration): Other Similar Organizations (except Business, Professional, Labor, and Political Organizations) (20-49: 1)
Construction: Poured Concrete Foundation and Structure Contractors (20-49: 1)
Administrative and Support and Waste Management and Remediation Services: Remediation Services (20-49: 1)
Management of Companies and Enterprises: Corporate, Subsidiary, and Regional Managing Offices (20-49: 1)
Other Services (except Public Administration): Civic and Social Organizations (10-19: 1, 5-9: 1, 1-4: 2)
People in group quarters in 2010:
157 people in military barracks and dormitories (nondisciplinary)
People in group quarters in 2000:
16 people in military barracks, etc.
4 people in homes for the mentally retarded
4 people in other group homes
Fatal accident statistics in 2014:
Fatal accident count: 1
Vehicles involved in fatal accidents: 3
Fatal accidents caused by drunken drivers: 1
Fatalities: 1
Persons involved in fatal accidents: 2
Pedestrians involved in fatal accidents: 0
Fatal accident statistics in 2013:
Fatal accident count: 1
Vehicles involved in fatal accidents: 1
Fatal accidents caused by drunken drivers: 1
Fatalities: 1
Persons involved in fatal accidents: 1
Pedestrians involved in fatal accidents: 0
Home Mortgage Disclosure Act Aggregated Statistics For Year 2009 (Based on 10 partial tracts)
A) FHA, FSA/RHS & VA Home Purchase Loans
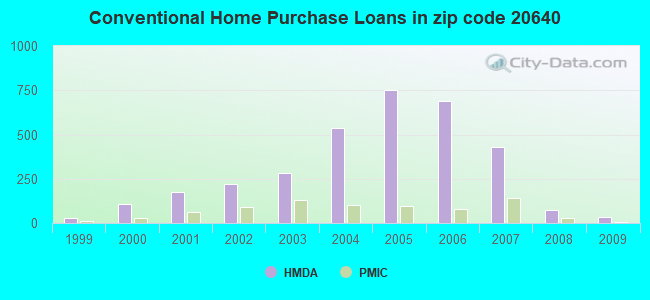
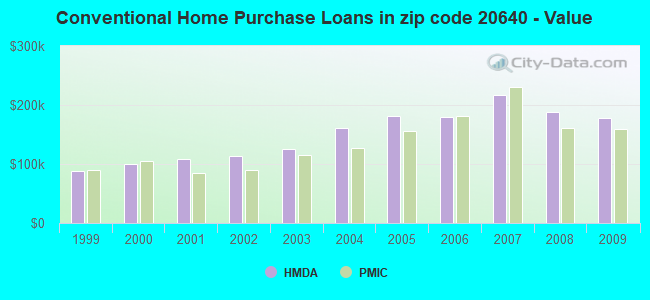
B) Conventional Home Purchase Loans
C) Refinancings
D) Home Improvement Loans
F) Non-occupant Loans on < 5 Family Dwellings (A B C & D)
G) Loans On Manufactured Home Dwelling (A B C & D)
Number
Average Value
Number
Average Value
Number
Average Value
Number
Average Value
Number
Average Value
Number
Average Value
LOANS ORIGINATED
147
$215,930
36
$177,269
366
$237,592
27
$92,678
24
$164,441
1
$7,160
APPLICATIONS APPROVED, NOT ACCEPTED
7
$228,731
2
$208,380
58
$236,454
2
$18,400
1
$422,620
0
$0
APPLICATIONS DENIED
32
$252,910
15
$154,307
198
$231,556
46
$66,162
15
$196,787
0
$0
APPLICATIONS WITHDRAWN
22
$263,979
12
$184,505
133
$234,816
9
$114,429
14
$167,304
2
$143,130
FILES CLOSED FOR INCOMPLETENESS
1
$369,210
4
$131,568
32
$237,751
4
$67,098
6
$332,895
0
$0
Aggregated Statistics For Year 2008 (Based on 10 partial tracts)
A) FHA, FSA/RHS & VA Home Purchase Loans
B) Conventional Home Purchase Loans
C) Refinancings
D) Home Improvement Loans
F) Non-occupant Loans on < 5 Family Dwellings (A B C & D)
G) Loans On Manufactured Home Dwelling (A B C & D)
Number
Average Value
Number
Average Value
Number
Average Value
Number
Average Value
Number
Average Value
Number
Average Value
LOANS ORIGINATED
97
$286,773
72
$188,659
363
$211,642
56
$74,112
18
$207,459
3
$85,453
APPLICATIONS APPROVED, NOT ACCEPTED
1
$240,130
17
$217,179
55
$225,297
20
$44,731
6
$169,312
2
$16,735
APPLICATIONS DENIED
27
$293,203
15
$167,031
317
$250,414
100
$100,232
12
$148,485
8
$60,892
APPLICATIONS WITHDRAWN
19
$295,087
27
$232,668
184
$233,127
8
$154,104
16
$202,007
0
$0
FILES CLOSED FOR INCOMPLETENESS
3
$251,870
3
$201,943
40
$279,404
1
$193,700
8
$268,759
0
$0
Aggregated Statistics For Year 2007 (Based on 10 partial tracts)
A) FHA, FSA/RHS & VA Home Purchase Loans
B) Conventional Home Purchase Loans
C) Refinancings
D) Home Improvement Loans
E) Loans on Dwellings For 5+ Families
F) Non-occupant Loans on < 5 Family Dwellings (A B C & D)
G) Loans On Manufactured Home Dwelling (A B C & D)
Number
Average Value
Number
Average Value
Number
Average Value
Number
Average Value
Number
Average Value
Number
Average Value
Number
Average Value
LOANS ORIGINATED
38
$290,693
429
$216,626
697
$209,813
112
$90,274
1
$14,330
68
$196,624
3
$33,687
APPLICATIONS APPROVED, NOT ACCEPTED
4
$235,392
54
$248,297
132
$229,940
21
$143,967
0
$0
8
$134,981
2
$40,910
APPLICATIONS DENIED
6
$305,215
142
$233,674
594
$245,088
115
$89,175
0
$0
44
$202,463
7
$68,629
APPLICATIONS WITHDRAWN
10
$354,453
93
$208,749
279
$238,124
20
$135,614
0
$0
22
$225,477
0
$0
FILES CLOSED FOR INCOMPLETENESS
0
$0
13
$175,593
114
$257,242
5
$160,078
0
$0
3
$269,917
0
$0
Aggregated Statistics For Year 2006 (Based on 10 partial tracts)
A) FHA, FSA/RHS & VA Home Purchase Loans
B) Conventional Home Purchase Loans
C) Refinancings
D) Home Improvement Loans
F) Non-occupant Loans on < 5 Family Dwellings (A B C & D)
G) Loans On Manufactured Home Dwelling (A B C & D)
Number
Average Value
Number
Average Value
Number
Average Value
Number
Average Value
Number
Average Value
Number
Average Value
LOANS ORIGINATED
28
$252,733
689
$180,390
1,060
$210,589
150
$101,262
112
$193,353
0
$0
APPLICATIONS APPROVED, NOT ACCEPTED
2
$332,870
66
$183,058
159
$222,733
31
$59,735
23
$167,292
0
$0
APPLICATIONS DENIED
4
$206,150
189
$197,271
632
$216,421
105
$108,848
34
$233,268
4
$118,828
APPLICATIONS WITHDRAWN
10
$271,614
99
$212,319
417
$229,458
18
$107,676
23
$199,472
0
$0
FILES CLOSED FOR INCOMPLETENESS
0
$0
26
$170,472
127
$236,589
1
$306,270
1
$198,610
0
$0
Aggregated Statistics For Year 2005 (Based on 10 partial tracts)
A) FHA, FSA/RHS & VA Home Purchase Loans
B) Conventional Home Purchase Loans
C) Refinancings
D) Home Improvement Loans
F) Non-occupant Loans on < 5 Family Dwellings (A B C & D)
G) Loans On Manufactured Home Dwelling (A B C & D)
Number
Average Value
Number
Average Value
Number
Average Value
Number
Average Value
Number
Average Value
Number
Average Value
LOANS ORIGINATED
25
$256,230
754
$181,392
1,117
$180,262
144
$98,120
152
$155,939
1
$36,440
APPLICATIONS APPROVED, NOT ACCEPTED
4
$185,050
83
$183,975
162
$165,702
38
$60,885
15
$92,716
7
$64,727
APPLICATIONS DENIED
5
$210,122
169
$161,353
524
$163,637
127
$62,291
20
$144,354
8
$60,665
APPLICATIONS WITHDRAWN
6
$194,570
120
$218,725
496
$181,950
30
$156,925
24
$166,894
0
$0
FILES CLOSED FOR INCOMPLETENESS
0
$0
33
$226,820
77
$190,121
5
$70,484
3
$143,137
0
$0
Aggregated Statistics For Year 2004 (Based on 10 partial tracts)
A) FHA, FSA/RHS & VA Home Purchase Loans
B) Conventional Home Purchase Loans
C) Refinancings
D) Home Improvement Loans
E) Loans on Dwellings For 5+ Families
F) Non-occupant Loans on < 5 Family Dwellings (A B C & D)
G) Loans On Manufactured Home Dwelling (A B C & D)
Number
Average Value
Number
Average Value
Number
Average Value
Number
Average Value
Number
Average Value
Number
Average Value
Number
Average Value
LOANS ORIGINATED
73
$179,774
539
$161,787
761
$152,929
129
$52,779
0
$0
86
$130,524
1
$147,480
APPLICATIONS APPROVED, NOT ACCEPTED
0
$0
38
$129,326
148
$144,456
24
$49,377
1
$200,560
14
$102,420
1
$48,180
APPLICATIONS DENIED
9
$181,333
87
$155,264
430
$137,557
116
$41,540
0
$0
32
$103,478
11
$59,900
APPLICATIONS WITHDRAWN
11
$217,109
92
$175,109
405
$143,605
31
$68,219
0
$0
29
$111,005
0
$0
FILES CLOSED FOR INCOMPLETENESS
0
$0
9
$144,481
46
$160,977
5
$45,060
0
$0
6
$186,650
0
$0
Aggregated Statistics For Year 2003 (Based on 10 partial tracts)
A) FHA, FSA/RHS & VA Home Purchase Loans
B) Conventional Home Purchase Loans
C) Refinancings
D) Home Improvement Loans
F) Non-occupant Loans on < 5 Family Dwellings (A B C & D)
Number
Average Value
Number
Average Value
Number
Average Value
Number
Average Value
Number
Average Value
LOANS ORIGINATED
151
$151,092
282
$125,044
1,026
$130,055
80
$15,584
87
$92,707
APPLICATIONS APPROVED, NOT ACCEPTED
8
$141,995
47
$142,579
155
$132,728
12
$19,958
7
$167,087
APPLICATIONS DENIED
13
$133,902
55
$145,752
376
$113,908
65
$34,499
30
$112,573
APPLICATIONS WITHDRAWN
21
$158,658
39
$135,614
347
$131,891
13
$56,529
14
$109,281
FILES CLOSED FOR INCOMPLETENESS
4
$114,168
5
$214,662
64
$153,402
1
$46,180
2
$89,260
Aggregated Statistics For Year 2002 (Based on 10 partial tracts)
A) FHA, FSA/RHS & VA Home Purchase Loans
B) Conventional Home Purchase Loans
C) Refinancings
D) Home Improvement Loans
F) Non-occupant Loans on < 5 Family Dwellings (A B C & D)
Number
Average Value
Number
Average Value
Number
Average Value
Number
Average Value
Number
Average Value
LOANS ORIGINATED
169
$142,418
223
$112,938
546
$116,169
67
$13,915
57
$82,427
APPLICATIONS APPROVED, NOT ACCEPTED
6
$128,045
17
$111,796
82
$117,128
7
$36,830
6
$69,437
APPLICATIONS DENIED
10
$123,791
34
$86,871
210
$113,214
61
$19,213
9
$88,998
APPLICATIONS WITHDRAWN
15
$132,271
35
$141,337
177
$113,684
15
$28,501
10
$81,972
FILES CLOSED FOR INCOMPLETENESS
2
$126,615
6
$171,928
39
$111,057
2
$38,290
2
$77,175
Aggregated Statistics For Year 2001 (Based on 10 partial tracts)
A) FHA, FSA/RHS & VA Home Purchase Loans
B) Conventional Home Purchase Loans
C) Refinancings
D) Home Improvement Loans
F) Non-occupant Loans on < 5 Family Dwellings (A B C & D)
Number
Average Value
Number
Average Value
Number
Average Value
Number
Average Value
Number
Average Value
LOANS ORIGINATED
150
$129,910
176
$108,127
466
$114,747
80
$13,969
34
$87,853
APPLICATIONS APPROVED, NOT ACCEPTED
5
$108,470
11
$92,321
74
$94,065
12
$29,325
7
$61,054
APPLICATIONS DENIED
13
$122,798
26
$71,710
232
$90,030
87
$13,936
3
$85,157
APPLICATIONS WITHDRAWN
16
$119,583
28
$122,615
171
$107,377
9
$16,970
10
$92,144
FILES CLOSED FOR INCOMPLETENESS
0
$0
1
$208,720
17
$97,919
0
$0
0
$0
Aggregated Statistics For Year 2000 (Based on 10 partial tracts)
A) FHA, FSA/RHS & VA Home Purchase Loans
B) Conventional Home Purchase Loans
C) Refinancings
D) Home Improvement Loans
E) Loans on Dwellings For 5+ Families
F) Non-occupant Loans on < 5 Family Dwellings (A B C & D)
Number
Average Value
Number
Average Value
Number
Average Value
Number
Average Value
Number
Average Value
Number
Average Value
LOANS ORIGINATED
165
$125,263
105
$99,812
137
$87,781
106
$16,493
2
$93,845
17
$76,169
APPLICATIONS APPROVED, NOT ACCEPTED
8
$119,201
10
$97,282
48
$81,532
19
$21,591
0
$0
5
$69,388
APPLICATIONS DENIED
16
$112,251
35
$86,199
172
$72,948
59
$19,561
0
$0
6
$61,933
APPLICATIONS WITHDRAWN
28
$106,746
26
$96,873
77
$75,809
12
$20,665
0
$0
3
$36,120
FILES CLOSED FOR INCOMPLETENESS
3
$111,140
6
$165,450
14
$103,354
4
$19,185
0
$0
0
$0
Aggregated Statistics For Year 1999 (Based on 5 partial tracts)
A) FHA, FSA/RHS & VA Home Purchase Loans
B) Conventional Home Purchase Loans
C) Refinancings
D) Home Improvement Loans
F) Non-occupant Loans on < 5 Family Dwellings (A B C & D)
2002 - 2018 National Fire Incident Reporting System (NFIRS) incidents
Based on the data from the years 2002 - 2018 the average number of fire incidents per year is 106. The highest number of reported fires - 158 took place in 2006, and the least - 49 in 2011. The data has a growing trend.
When looking into fire subcategories, the most incidents belonged to: Structure Fires (66.6%), and Outside Fires (24.8%).
Fire incident types reported to NFIRS in Zip Code 20640


 Nearest zip codes: 20658, 22026, 20662, 22191, 20693, 22025.


 . Federal Facility. U.S. NAVY

 Based on the data from the years 2002 - 2018 the average number of fire incidents per year is 106. The highest number of reported fires - 158 took place in 2006, and the least - 49 in 2011. The data has a growing trend.
 When looking into fire subcategories, the most incidents belonged to: Structure Fires (66.6%), and Outside Fires (24.8%).