Estimated zip code population in 2022: 5,256 Zip code population in 2010: 5,384 Zip code population in 2000: 5,115
Houses and condos: 2,498 Renter-occupied apartments: 422
% of renters here:
18%
State:
31%
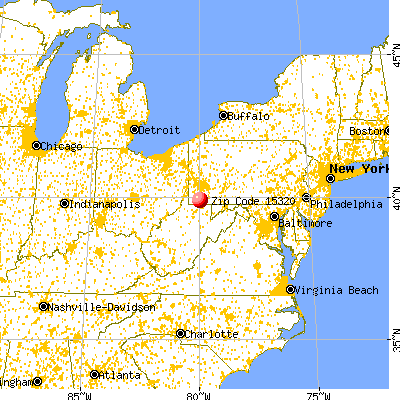
March 2022 cost of living index in zip code 15320: 83.3 (less than average, U.S. average is 100)
Land area: 38.8 sq. mi. Water area: 0.3 sq. mi.
Population density: 135 people per square mile
(very low).
OSM Map
General Map
Google Map
MSN Map
OSM Map
General Map
Google Map
MSN Map
OSM Map
General Map
Google Map
MSN Map
OSM Map
General Map
Google Map
MSN Map
Please wait while loading the map...
Real estate property taxes paid for housing units in 2022:
This zip code:
1.2% ($1,881)
Pennsylvania:
1.3% ($3,094)
Median real estate property taxes paid for housing units with mortgages in 2022: $2,133 (1.4%) Median real estate property taxes paid for housing units with no mortgage in 2022: $1,361 (0.8%)
Business Search- 14 Million verified businesses
Males: 2,372
(45.1%)
Females: 2,883
(54.9%)
For population 25 years and over in 15320:
High school or higher: 95.6%
Bachelor's degree or higher: 22.0%
Graduate or professional degree: 10.4%
Unemployed: 2.6%
Mean travel time to work (commute): 28.8 minutes
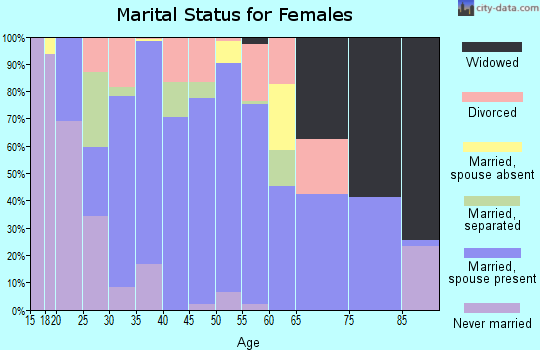
For population 15 years and over in 15320:
Never married: 18.0%
Now married: 63.3%
Separated: 1.5%
Widowed: 8.3%
Divorced: 8.9%
Zip code 15320 compared to state average:
Median house value below state average.
Black race population percentage significantly below state average.
Hispanic race population percentage significantly below state average.
Median age above state average.
Foreign-born population percentage significantly below state average.
Renting percentage below state average.
Length of stay since moving in below state average.
Percentage of population with a bachelor's degree or higher below state average.
Averages for the 2020 tax year for zip code 15320, filed in 2021:
Average Adjusted Gross Income (AGI) in 2020: $58,073 (Individual Income Tax Returns)
Here:
$58,073
State:
$75,707
Salary/wage: $51,907 (reported on 77.8% of returns)
Here:
$51,907
State:
$62,806
(% of AGI for various income ranges: 900.7% for AGIs below $25k, 2938.5% for AGIs $25k-50k, 5735.4% for AGIs $50k-75k, 8235.6% for AGIs $75k-100k, 14854.2% for AGIs $100k-200k)
Taxable interest for individuals: $1,179 (reported on 31.2% of returns)
This zip code:
$1,179
Pennsylvania:
$1,633
(% of AGI for various income ranges: 19.1% for AGIs below $25k, 34.0% for AGIs $25k-50k, 66.5% for AGIs $50k-75k, 118.1% for AGIs $75k-100k, 68.5% for AGIs $100k-200k)
Ordinary dividends: $2,437 (reported on 15.0% of returns)
Here:
$2,437
State:
$7,382
(% of AGI for various income ranges: 15.3% for AGIs below $25k, 27.7% for AGIs $25k-50k, 53.5% for AGIs $50k-75k, 93.1% for AGIs $75k-100k, 78.8% for AGIs $100k-200k)
Net capital gain/loss in AGI: +$4,128 (reported on 10.7% of returns)
Here:
+$4,128
State:
+$23,522
(% of AGI for various income ranges: 17.4% for AGIs $25k-50k, 35.0% for AGIs $50k-75k, 41.9% for AGIs $75k-100k, 157.7% for AGIs $100k-200k)
Profit/loss from business: +$8,773 (reported on 9.4% of returns)
Here:
+$8,773
State:
+$16,274
(% of AGI for various income ranges: 33.1% for AGIs below $25k, 108.3% for AGIs $25k-50k, 89.6% for AGIs $50k-75k, 62.5% for AGIs $75k-100k, 348.5% for AGIs $100k-200k)
Taxable individual retirement arrangement distribution: $18,116 (reported on 8.1% of returns)
15320:
$18,116
Pennsylvania:
$18,583
(% of AGI for various income ranges: 54.0% for AGIs below $25k, 75.3% for AGIs $25k-50k, 156.5% for AGIs $50k-75k, 459.4% for AGIs $75k-100k, 634.2% for AGIs $100k-200k)
Total itemized deductions: $31,060 (reported on 2.1% of returns)
Here:
$31,060
State:
$34,850
(% of AGI for various income ranges: 110.4% for AGIs $25k-50k, 397.7% for AGIs $100k-200k)
Charity contributions: $5,750 (reported on 1.7% of returns)
Here:
$5,750
State:
$12,392
(% of AGI for various income ranges: 88.5% for AGIs $100k-200k)
Taxes paid: $6,750 (reported on 2.6% of returns)
15320:
$6,750
State:
$8,200
(% of AGI for various income ranges: 23.6% for AGIs $25k-50k, 113.1% for AGIs $100k-200k)
Earned income credit: $2,062 (reported on 14.5% of returns)
Here:
$2,062
State:
$2,100
(% of AGI for various income ranges: 79.6% for AGIs below $25k, 56.0% for AGIs $25k-50k)
Percentage of individuals using paid preparers for their 2020 taxes: 94.0%
Here:
94%
State:
92%
(% for various income ranges: 93.5% for AGIs below $25k, 93.1% for AGIs $25k-50k, 94.3% for AGIs $50k-75k, 95.5% for AGIs $75k-100k, 94.6% for AGIs $100k-200k, 100.0% for AGIs over 200k)
Averages for the 2012 tax year for zip code 15320, filed in 2013:
Average Adjusted Gross Income (AGI) in 2012: $50,535 (Individual Income Tax Returns)
Here:
$50,535
State:
$61,346
Salary/wage: $45,093 (reported on 83.1% of returns)
Here:
$45,093
State:
$51,902
(% of AGI for various income ranges: 69.4% for AGIs below $25k, 77.0% for AGIs $25k-50k, 81.3% for AGIs $50k-75k, 78.4% for AGIs $75k-100k, 77.5% for AGIs $100k-200k, 40.0% for AGIs over 200k)
Taxable interest for individuals: $1,021 (reported on 35.5% of returns)
This zip code:
$1,021
Pennsylvania:
$1,588
(% of AGI for various income ranges: 2.0% for AGIs below $25k, 0.9% for AGIs $25k-50k, 0.9% for AGIs $50k-75k, 0.5% for AGIs $75k-100k, 0.3% for AGIs $100k-200k, 0.6% for AGIs over 200k)
Ordinary dividends: $2,039 (reported on 16.9% of returns)
Here:
$2,039
State:
$5,827
(% of AGI for various income ranges: 1.4% for AGIs below $25k, 0.8% for AGIs $25k-50k, 0.7% for AGIs $50k-75k, 0.7% for AGIs $75k-100k, 0.6% for AGIs $100k-200k)
Net capital gain/loss in AGI: +$3,552 (reported on 9.5% of returns)
Here:
+$3,552
State:
+$14,495
(% of AGI for various income ranges: 0.1% for AGIs $25k-50k, 0.4% for AGIs $75k-100k, 1.9% for AGIs $100k-200k)
Profit/loss from business: +$8,548 (reported on 9.5% of returns)
Here:
+$8,548
State:
+$16,268
(% of AGI for various income ranges: 3.1% for AGIs below $25k, 1.2% for AGIs $25k-50k, 0.6% for AGIs $50k-75k, 1.7% for AGIs $75k-100k, 2.4% for AGIs $100k-200k)
Taxable individual retirement arrangement distribution: $14,305 (reported on 8.7% of returns)
15320:
$14,305
Pennsylvania:
$14,550
(% of AGI for various income ranges: 2.9% for AGIs below $25k, 1.8% for AGIs $25k-50k, 2.7% for AGIs $50k-75k, 1.6% for AGIs $75k-100k, 3.7% for AGIs $100k-200k)
Total itemized deductions: $17,335 (16% of AGI, reported on 17.8% of returns)
Here:
$17,335
State:
$23,538
Here:
15.6% of AGI
State:
18.4% of AGI
(% of AGI for various income ranges: 2.9% for AGIs below $25k, 4.1% for AGIs $25k-50k, 5.2% for AGIs $50k-75k, 5.7% for AGIs $75k-100k, 8.2% for AGIs $100k-200k, 8.0% for AGIs over 200k)
Charity contributions: $3,021 (reported on 13.6% of returns)
Here:
$3,021
State:
$4,025
(% of AGI for various income ranges: 0.7% for AGIs $25k-50k, 0.8% for AGIs $50k-75k, 0.7% for AGIs $75k-100k, 1.2% for AGIs $100k-200k, 0.9% for AGIs over 200k)
Taxes paid: $7,302 (reported on 17.8% of returns)
15320:
$7,302
State:
$9,982
(% of AGI for various income ranges: 0.8% for AGIs below $25k, 1.0% for AGIs $25k-50k, 1.7% for AGIs $50k-75k, 2.1% for AGIs $75k-100k, 3.9% for AGIs $100k-200k, 5.3% for AGIs over 200k)
Earned income credit: $1,932 (reported on 15.7% of returns)
Here:
$1,932
State:
$2,106
(% of AGI for various income ranges: 5.2% for AGIs below $25k, 0.8% for AGIs $25k-50k)
Percentage of individuals using paid preparers for their 2012 taxes: 53.7%
Here:
54%
State:
53%
(% for various income ranges: 45.9% for AGIs below $25k, 54.7% for AGIs $25k-50k, 57.1% for AGIs $50k-75k, 58.3% for AGIs $75k-100k, 65.5% for AGIs $100k-200k, 100.0% for AGIs over 200k)
Averages for the 2004 tax year for zip code 15320, filed in 2005:
Average Adjusted Gross Income (AGI) in 2004: $35,832 (Individual Income Tax Returns)
Here:
$35,832
State:
$48,049
Salary/wage: $35,220 (reported on 82.1% of returns)
Here:
$35,220
State:
$42,646
(% of AGI for various income ranges: 122.0% for AGIs below $10k, 70.2% for AGIs $10k-25k, 80.1% for AGIs $25k-50k, 85.3% for AGIs $50k-75k, 90.0% for AGIs $75k-100k, 69.0% for AGIs over 100k)
Taxable interest for individuals: $1,407 (reported on 47.5% of returns)
This zip code:
$1,407
Pennsylvania:
$1,657
(% of AGI for various income ranges: 9.4% for AGIs below $10k, 3.2% for AGIs $10k-25k, 2.2% for AGIs $25k-50k, 1.6% for AGIs $50k-75k, 1.0% for AGIs $75k-100k, 0.9% for AGIs over 100k)
Taxable dividends: $1,416 (reported on 20.7% of returns)
Here:
$1,416
State:
$3,566
(% of AGI for various income ranges: 2.8% for AGIs below $10k, 1.8% for AGIs $10k-25k, 0.6% for AGIs $25k-50k, 0.7% for AGIs $50k-75k, 0.2% for AGIs $75k-100k, 0.9% for AGIs over 100k)
Net capital gain/loss: +$1,154 (reported on 13.4% of returns)
Here:
+$1,154
State:
+$9,716
(% of AGI for various income ranges: -2.3% for AGIs below $10k, -0.3% for AGIs $10k-25k, 0.5% for AGIs $25k-50k, 0.9% for AGIs $50k-75k, 0.6% for AGIs $75k-100k, 0.3% for AGIs over 100k)
Profit/loss from business: +$7,271 (reported on 12.0% of returns)
Here:
+$7,271
State:
+$14,267
(% of AGI for various income ranges: 8.0% for AGIs below $10k, 2.8% for AGIs $10k-25k, 1.8% for AGIs $25k-50k, 1.2% for AGIs $50k-75k, 0.6% for AGIs $75k-100k, 6.2% for AGIs over 100k)
IRA payment deduction: $2,509 (reported on 2.5% of returns)
15320:
$2,509
Pennsylvania:
$2,903
Total itemized deductions: $13,873 (19% of AGI, reported on 16.5% of returns)
Here:
$13,873
State:
$18,804
Here:
19.0% of AGI
State:
19.5% of AGI
(% of AGI for various income ranges: 4.4% for AGIs $10k-25k, 4.6% for AGIs $25k-50k, 6.8% for AGIs $50k-75k, 8.0% for AGIs $75k-100k, 8.9% for AGIs over 100k)
Charity contributions deductions: $2,409 (3% of AGI, reported on 13.8% of returns)
Here:
$2,409
State:
$3,337
Here:
3.1% of AGI
State:
3.3% of AGI
(% of AGI for various income ranges: 0.5% for AGIs $10k-25k, 0.5% for AGIs $25k-50k, 1.0% for AGIs $50k-75k, 1.1% for AGIs $75k-100k, 1.6% for AGIs over 100k)
Total tax: $4,823 (reported on 71.8% of returns)
15320:
$4,823
State:
$8,008
(% of AGI for various income ranges: 3.4% for AGIs below $10k, 3.7% for AGIs $10k-25k, 6.7% for AGIs $25k-50k, 9.1% for AGIs $50k-75k, 11.2% for AGIs $75k-100k, 18.0% for AGIs over 100k)
Earned income credit: $1,821 (reported on 16.1% of returns)
Here:
$1,821
State:
$1,643
Percentage of individuals using paid preparers for their 2004 taxes: 56.8%
Here:
57%
State:
56%
(% for various income ranges: 48.3% for AGIs below $10k, 57.1% for AGIs $10k-25k, 57.4% for AGIs $25k-50k, 59.7% for AGIs $50k-75k, 61.8% for AGIs $75k-100k, 76.0% for AGIs over 100k)
Household received Food Stamps/SNAP in the past 12 months: 332 Household did not receive Food Stamps/SNAP in the past 12 months: 1,959
Women who had a birth in the past 12 months: 38 (26 now married, 12 unmarried) Women who did not have a birth in the past 12 months: 891 (502 now married, 383 unmarried)
Housing units in zip code 15320 with a mortgage: 1,130 (8 second mortgage, 8 both second mortgage and home equity loan) Houses without a mortgage: 144
Median monthly owner costs for units with a mortgage: $1,075 Median monthly owner costs for units without a mortgage: $527
Residents with income below the poverty level in 2022:
This zip code:
15.4%
Whole state:
11.8%
Residents with income below 50% of the poverty level in 2022:
This zip code:
11.2%
Whole state:
6.1%
Median number of rooms in houses and condos:
Here:
6.8
State:
6.8
Median number of rooms in apartments:
Here:
5.4
State:
4.3
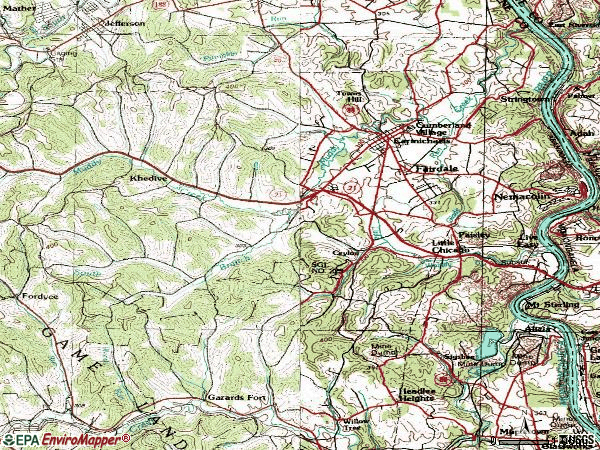
Notable locations in this zip code not listed on our city pages
Notable locations in zip code 15320: Broken Tee Golf Course (A), Garards Fort Shaft (B), Carmichaels - Cumberland Township Volunteer Fire Department (C). Display/hide their locations on the map
Streams, rivers, and creeks: Muddy Creek (A), Goose Run (B), Glade Run (C), Little Whiteley Creek (D), Coal Run (E), Pegs Run (F). Display/hide their locations on the map
In group quarters: 21 (-1 institutionalized population)
Size of family households: 810 2-persons, 462 3-persons, 97 4-persons, 145 5-persons, 56 6-persons, 3 7-or-more-persons
Size of nonfamily households: 663 1-person, 42 2-persons, 4 3-persons
708 married couples with children.
256 single-parent households (197 men, 59 women).
97.8% of residents of 15320 zip code speak English at home.
0.7% of residents speak Spanish at home (100% not at all).
1.2% of residents speak other Indo-European language at home (95% very well, 5% well).
Foreign born population: 31 (0.6%) (0.0% of them are naturalized citizens)
:
0.6%
Whole state:
7.5%
112%Dominica
6%France
19%English
14%Italian
11%Polish
8%German
8%Irish
5%Czech
5%Scottish
Year of entry for the foreign-born population
332010 or later
02000 to 2009
21990 to 1999
0Before 1990
Facilities with environmental interests located in this zip code:
BERNES BODY SHOP (317 S PINE ST in CARMICHAELS, PA)
Conditionally Exempt Small Quantity Generators, less than 100 kg/month of hazardous waste (Resource Conservation and Recovery Act (tracking hazardous waste)) - notification Organizations: KURINCAK BERNE (CONTACT/OWNER)
Housing units lacking complete plumbing facilities: 0.6% Housing units lacking complete kitchen facilities: 0.7%
43.1%Utility gas
31.9%Electricity
11.6%Fuel oil, kerosene, etc.
6.6%Bottled, tank, or LP gas
3.5%Other fuel
2.3%Wood
1.3%No fuel used
Population in 1990: 6,702.
Place of birth for U.S.-born residents:
This state: 3,640
Northeast: 126
Midwest: 136
South: 1,296
West: 23
66% of the 15320 zip code residents lived in the same house 5 years ago. Out of people who lived in different houses, 76% lived in this county. Out of people who lived in different counties, 50% lived in Pennsylvania.
93% of the 15320 zip code residents lived in the same house 1 year ago. Out of people who lived in different houses, 48% moved from this county. Out of people who lived in different houses, 9% moved from different county within same state. Out of people who lived in different houses, 46% moved from different state.
Private vs. public school enrollment:
Students in private schools in grades 1 to 8 (elementary and middle school): 35
Here:
8.6%
Pennsylvania:
15.7%
Students in private schools in grades 9 to 12 (high school): 116
Here:
35.1%
Pennsylvania:
13.4%
Students in private undergraduate colleges:
Here:
0.0%
Pennsylvania:
39.8%
Occupation by median earnings in the past 12 months ($)
113,334Health diagnosing and treating practitioners and other technical occupations
103,315Architecture and engineering occupations
90,447Management occupations
79,429Business and financial operations occupations
62,925Transportation occupations
60,782Law enforcement workers including supervisors
Top industries in this zip code by the number of employees in 2005:
Health Care and Social Assistance: Child Day Care Services (50-99 employees: 1 establishment, 10-19 employees: 1 establishment, 1-4 employees: 1 establishment)
Wholesale Trade: Industrial Machinery and Equipment Merchant Wholesalers (50-99: 1)
Finance and Insurance: Commercial Banking (20-49: 1, 5-9: 1)
Other Services (except Public Administration): Religious Organizations (5-9: 4, 1-4: 4)
Accommodation and Food Services: Limited-Service Restaurants (20-49: 1, 1-4: 1)
Accommodation and Food Services: Full-Service Restaurants (20-49: 1)
People in group quarters in 2010:
8 people in nursing facilities/skilled-nursing facilities
6 people in group homes intended for adults
People in group quarters in 2000:
62 people in other noninstitutional group quarters
12 people in nursing homes
12 people in other group homes
6 people in homes for the mentally retarded
Fatal accident statistics in 2013:
Fatal accident count: 1
Vehicles involved in fatal accidents: 1
Fatal accidents caused by drunken drivers: 0
Fatalities: 1
Persons involved in fatal accidents: 1
Pedestrians involved in fatal accidents: 0
Fatal accident statistics in 2012:
Fatal accident count: 1
Vehicles involved in fatal accidents: 2
Fatal accidents caused by drunken drivers: 0
Fatalities: 1
Persons involved in fatal accidents: 2
Pedestrians involved in fatal accidents: 0
2004 - 2018 National Fire Incident Reporting System (NFIRS) incidents
According to the data from the years 2004 - 2018 the average number of fire incidents per year is 8. The highest number of fires - 23 took place in 2005, and the least - 0 in 2008. The data has a growing trend.
When looking into fire subcategories, the most incidents belonged to: Structure Fires (43.7%), and Outside Fires (26.2%).
Fire incident types reported to NFIRS in Zip Code 15320


 Nearest zip codes: 15351, 15357, 15476, 15334, 15325, 15344.


 According to the data from the years 2004 - 2018 the average number of fire incidents per year is 8. The highest number of fires - 23 took place in 2005, and the least - 0 in 2008. The data has a growing trend.
 When looking into fire subcategories, the most incidents belonged to: Structure Fires (43.7%), and Outside Fires (26.2%).