Estimated zip code population in 2022: 3,403 Zip code population in 2010: 3,296 Zip code population in 2000: 2,766
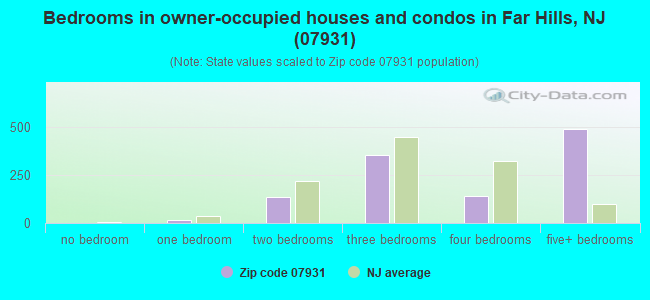
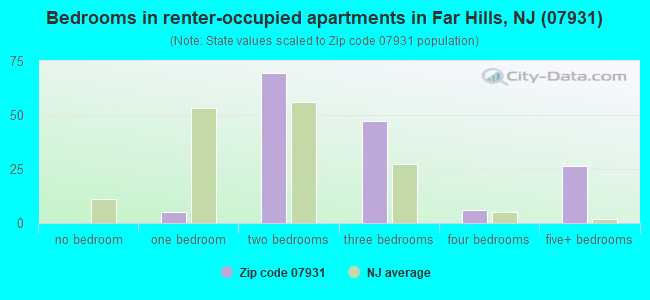
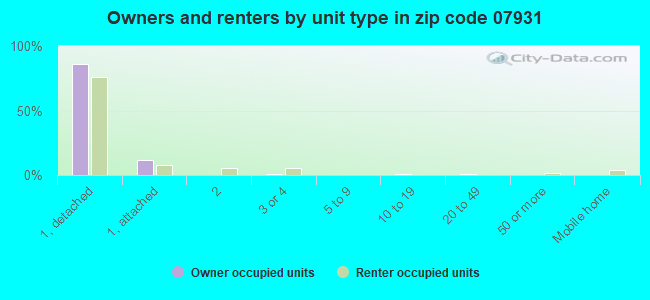
Houses and condos: 1,397 Renter-occupied apartments: 156
% of renters here:
12%
State:
35%
March 2022 cost of living index in zip code 07931: 127.5 (high, U.S. average is 100)
Land area: 20.6 sq. mi. Water area: 0.2 sq. mi.
Population density: 165 people per square mile
(very low).
OSM Map
Google Map
MSN Map
OSM Map
General Map
Google Map
MSN Map
OSM Map
Google Map
MSN Map
OSM Map
Google Map
MSN Map
Please wait while loading the map...
Real estate property taxes paid for housing units in 2022:
This zip code:
0.9% ($9,521)
New Jersey:
2.1% ($8,897)
Median real estate property taxes paid for housing units with mortgages in 2022: $9,557 (0.9%) Median real estate property taxes paid for housing units with no mortgage in 2022: $9,483 (1.0%)
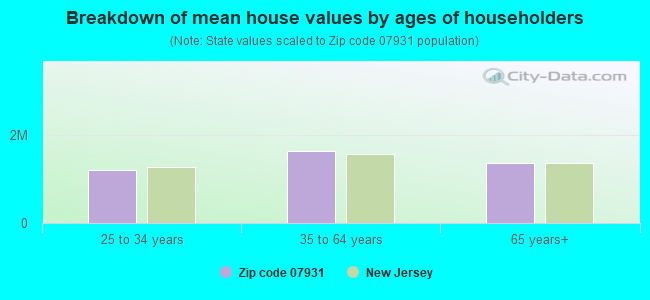
Estimated median house/condo value in 2022: $1,053,551
07931:
$1,053,551
New Jersey:
$428,900
Median resident age:
This zip code:
47.8 years
New Jersey median age:
40.4 years
Average household size:
This zip code:
2.7 people
New Jersey:
2.6 people
Averages for the 2020 tax year for zip code 07931, filed in 2021:
Average Adjusted Gross Income (AGI) in 2020: $684,679 (Individual Income Tax Returns)
Here:
$684,679
State:
$95,247
Salary/wage: $529,683 (reported on 74.8% of returns)
Here:
$529,683
State:
$80,635
(% of AGI for various income ranges: 1606.9% for AGIs below $25k, 4215.6% for AGIs $25k-50k, 7315.6% for AGIs $50k-75k, 12600.0% for AGIs $75k-100k, 20577.8% for AGIs $100k-200k, 507438.3% for AGIs over 200k)
Taxable interest for individuals: $20,882 (reported on 63.2% of returns)
This zip code:
$20,882
New Jersey:
$2,414
(% of AGI for various income ranges: 66.2% for AGIs below $25k, 195.6% for AGIs $25k-50k, 338.9% for AGIs $50k-75k, 542.0% for AGIs $75k-100k, 1291.1% for AGIs $100k-200k, 16256.7% for AGIs over 200k)
Ordinary dividends: $57,880 (reported on 63.2% of returns)
Here:
$57,880
State:
$8,057
(% of AGI for various income ranges: 353.8% for AGIs below $25k, 574.4% for AGIs $25k-50k, 551.1% for AGIs $50k-75k, 1610.0% for AGIs $75k-100k, 3958.9% for AGIs $100k-200k, 44812.5% for AGIs over 200k)
Net capital gain/loss in AGI: +$171,791 (reported on 59.5% of returns)
Here:
+$171,791
State:
+$25,022
(% of AGI for various income ranges: 257.7% for AGIs below $25k, 660.0% for AGIs $25k-50k, 464.4% for AGIs $50k-75k, 456.0% for AGIs $75k-100k, 2897.8% for AGIs $100k-200k, 135378.3% for AGIs over 200k)
Profit/loss from business: +$47,157 (reported on 22.7% of returns)
Here:
+$47,157
State:
+$18,035
(% of AGI for various income ranges: 298.5% for AGIs below $25k, 147.8% for AGIs $25k-50k, 284.4% for AGIs $50k-75k, 1074.0% for AGIs $75k-100k, 3243.3% for AGIs $100k-200k, 11012.5% for AGIs over 200k)
Taxable individual retirement arrangement distribution: $51,700 (reported on 11.7% of returns)
07931:
$51,700
New Jersey:
$21,558
(% of AGI for various income ranges: 320.0% for AGIs $25k-50k, 1436.0% for AGIs $75k-100k, 2244.4% for AGIs $100k-200k, 5664.2% for AGIs over 200k)
Self-employed (Keogh) retirement plans: $39,450 (reported on 4.9% of returns)
07931:
$39,450
New Jersey:
$30,844
(% of AGI for various income ranges: 2630.0% for AGIs over 200k)
Total itemized deductions: $121,768 (reported on 36.2% of returns)
Here:
$121,768
State:
$32,863
(% of AGI for various income ranges: 683.3% for AGIs $25k-50k, 1120.0% for AGIs $50k-75k, 2554.0% for AGIs $75k-100k, 3481.1% for AGIs $100k-200k, 54841.7% for AGIs over 200k)
Charity contributions: $29,430 (reported on 32.5% of returns)
Here:
$29,430
State:
$7,880
(% of AGI for various income ranges: 105.6% for AGIs $25k-50k, 302.0% for AGIs $75k-100k, 520.0% for AGIs $100k-200k, 12403.3% for AGIs over 200k)
Taxes paid: $9,434 (reported on 36.2% of returns)
07931:
$9,434
State:
$9,183
(% of AGI for various income ranges: 205.6% for AGIs $25k-50k, 295.6% for AGIs $50k-75k, 496.0% for AGIs $75k-100k, 933.3% for AGIs $100k-200k, 3355.8% for AGIs over 200k)
Earned income credit: $1,800 (reported on 2.5% of returns)
Here:
$1,800
State:
$2,148
(% of AGI for various income ranges: 55.4% for AGIs below $25k)
Percentage of individuals using paid preparers for their 2020 taxes: 92.0%
Here:
92%
State:
92%
(% for various income ranges: 88.9% for AGIs below $25k, 94.4% for AGIs $25k-50k, 86.7% for AGIs $50k-75k, 90.9% for AGIs $75k-100k, 87.5% for AGIs $100k-200k, 96.6% for AGIs over 200k)
Averages for the 2012 tax year for zip code 07931, filed in 2013:
Average Adjusted Gross Income (AGI) in 2012: $614,973 (Individual Income Tax Returns)
Here:
$614,973
State:
$79,688
Salary/wage: $424,306 (reported on 71.6% of returns)
Here:
$424,306
State:
$68,122
(% of AGI for various income ranges: 55.3% for AGIs below $25k, 67.7% for AGIs $25k-50k, 65.2% for AGIs $50k-75k, 54.2% for AGIs $75k-100k, 59.9% for AGIs $100k-200k, 48.7% for AGIs over 200k)
Taxable interest for individuals: $28,679 (reported on 66.0% of returns)
This zip code:
$28,679
New Jersey:
$2,193
(% of AGI for various income ranges: 4.3% for AGIs below $25k, 1.6% for AGIs $25k-50k, 4.2% for AGIs $50k-75k, 2.9% for AGIs $75k-100k, 2.6% for AGIs $100k-200k, 3.1% for AGIs over 200k)
Ordinary dividends: $62,518 (reported on 62.3% of returns)
Here:
$62,518
State:
$6,828
(% of AGI for various income ranges: 16.2% for AGIs below $25k, 4.4% for AGIs $25k-50k, 6.4% for AGIs $50k-75k, 8.8% for AGIs $75k-100k, 8.8% for AGIs $100k-200k, 6.2% for AGIs over 200k)
Net capital gain/loss in AGI: +$207,147 (reported on 59.3% of returns)
Here:
+$207,147
State:
+$15,358
(% of AGI for various income ranges: 3.3% for AGIs below $25k, 3.6% for AGIs $25k-50k, 3.5% for AGIs $50k-75k, 5.4% for AGIs $75k-100k, 4.2% for AGIs $100k-200k, 21.0% for AGIs over 200k)
Profit/loss from business: +$57,640 (reported on 24.7% of returns)
Here:
+$57,640
State:
+$19,577
(% of AGI for various income ranges: 11.2% for AGIs below $25k, 9.5% for AGIs $25k-50k, 6.4% for AGIs $50k-75k, 3.4% for AGIs $75k-100k, 5.2% for AGIs $100k-200k, 2.1% for AGIs over 200k)
Taxable individual retirement arrangement distribution: $65,943 (reported on 14.2% of returns)
07931:
$65,943
New Jersey:
$18,214
(% of AGI for various income ranges: 11.2% for AGIs below $25k, 3.7% for AGIs $50k-75k, 6.1% for AGIs $75k-100k, 5.0% for AGIs $100k-200k, 1.3% for AGIs over 200k)
Self-employment retirement plans: $33,812 (reported on 4.9% of returns)
07931:
$33,812
New Jersey:
$24,511
(% of AGI for various income ranges: 0.3% for AGIs over 200k)
Total itemized deductions: $157,890 (17% of AGI, reported on 64.8% of returns)
Here:
$157,890
State:
$30,827
Here:
16.9% of AGI
State:
21.2% of AGI
(% of AGI for various income ranges: 28.5% for AGIs below $25k, 18.2% for AGIs $25k-50k, 26.1% for AGIs $50k-75k, 31.4% for AGIs $75k-100k, 26.3% for AGIs $100k-200k, 16.0% for AGIs over 200k)
Charity contributions: $22,378 (reported on 56.8% of returns)
Here:
$22,378
State:
$3,451
(% of AGI for various income ranges: 0.9% for AGIs below $25k, 1.2% for AGIs $25k-50k, 1.9% for AGIs $50k-75k, 1.9% for AGIs $75k-100k, 2.7% for AGIs $100k-200k, 2.1% for AGIs over 200k)
Taxes paid: $100,321 (reported on 64.2% of returns)
07931:
$100,321
State:
$15,801
(% of AGI for various income ranges: 9.2% for AGIs below $25k, 7.0% for AGIs $25k-50k, 10.3% for AGIs $50k-75k, 13.8% for AGIs $75k-100k, 14.1% for AGIs $100k-200k, 10.3% for AGIs over 200k)
Earned income credit: $1,600 (reported on 3.1% of returns)
Here:
$1,600
State:
$2,182
(% of AGI for various income ranges: 2.0% for AGIs below $25k)
Percentage of individuals using paid preparers for their 2012 taxes: 79.0%
Here:
79%
State:
65%
(% for various income ranges: 74.4% for AGIs below $25k, 75.0% for AGIs $25k-50k, 69.2% for AGIs $50k-75k, 77.8% for AGIs $75k-100k, 82.6% for AGIs $100k-200k, 84.5% for AGIs over 200k)
Averages for the 2004 tax year for zip code 07931, filed in 2005:
Average Adjusted Gross Income (AGI) in 2004: $471,526 (Individual Income Tax Returns)
Here:
$471,526
State:
$64,921
Salary/wage: $388,879 (reported on 68.8% of returns)
Here:
$388,879
State:
$57,755
(% of AGI for various income ranges: 51.8% for AGIs $10k-25k, 64.3% for AGIs $25k-50k, 64.1% for AGIs $50k-75k, 57.0% for AGIs $75k-100k, 55.4% for AGIs over 100k)
Taxable interest for individuals: $17,308 (reported on 75.6% of returns)
This zip code:
$17,308
New Jersey:
$2,068
(% of AGI for various income ranges: 7.2% for AGIs $10k-25k, 4.6% for AGIs $25k-50k, 4.5% for AGIs $50k-75k, 4.5% for AGIs $75k-100k, 2.5% for AGIs over 100k)
Taxable dividends: $27,436 (reported on 72.1% of returns)
Here:
$27,436
State:
$3,959
(% of AGI for various income ranges: 8.2% for AGIs $10k-25k, 5.8% for AGIs $25k-50k, 5.7% for AGIs $50k-75k, 7.7% for AGIs $75k-100k, 4.0% for AGIs over 100k)
Net capital gain/loss: +$151,691 (reported on 65.8% of returns)
Here:
+$151,691
State:
+$13,591
(% of AGI for various income ranges: 5.0% for AGIs $10k-25k, 1.0% for AGIs $25k-50k, 0.6% for AGIs $50k-75k, 2.2% for AGIs $75k-100k, 21.5% for AGIs over 100k)
Profit/loss from business: +$41,313 (reported on 20.1% of returns)
Here:
+$41,313
State:
+$17,520
(% of AGI for various income ranges: 11.8% for AGIs $10k-25k, 11.8% for AGIs $25k-50k, 11.7% for AGIs $50k-75k, 5.4% for AGIs $75k-100k, 1.5% for AGIs over 100k)
IRA payment deduction: $4,379 (reported on 3.5% of returns)
07931:
$4,379
New Jersey:
$3,270
Self-employed pension: $24,189 (reported on 5.5% of returns)
Here:
$24,189
New Jersey:
$17,258
Total itemized deductions: $114,834 (15% of AGI, reported on 59.5% of returns)
Here:
$114,834
State:
$23,924
Here:
14.6% of AGI
State:
21.1% of AGI
(% of AGI for various income ranges: 29.0% for AGIs $10k-25k, 18.4% for AGIs $25k-50k, 27.0% for AGIs $50k-75k, 23.0% for AGIs $75k-100k, 14.0% for AGIs over 100k)
Charity contributions deductions: $32,640 (4% of AGI, reported on 55.3% of returns)
Here:
$32,640
State:
$3,242
Here:
4.0% of AGI
State:
2.7% of AGI
(% of AGI for various income ranges: 1.1% for AGIs $10k-25k, 2.3% for AGIs $25k-50k, 2.8% for AGIs $50k-75k, 3.3% for AGIs $75k-100k, 3.8% for AGIs over 100k)
Total tax: $139,023 (reported on 83.2% of returns)
07931:
$139,023
State:
$12,321
(% of AGI for various income ranges: 5.8% for AGIs $10k-25k, 9.3% for AGIs $25k-50k, 11.4% for AGIs $50k-75k, 11.2% for AGIs $75k-100k, 24.7% for AGIs over 100k)
Earned income credit: $1,457 (reported on 2.1% of returns)
Here:
$1,457
State:
$1,711
Percentage of individuals using paid preparers for their 2004 taxes: 78.8%
Here:
79%
State:
65%
(% for various income ranges: 79.2% for AGIs below $10k, 72.9% for AGIs $10k-25k, 66.1% for AGIs $25k-50k, 79.3% for AGIs $50k-75k, 76.5% for AGIs $75k-100k, 82.7% for AGIs over 100k)
Likely homosexual households (counted as self-reported same-sex unmarried-partner households)
Lesbian couples: 0.0% of all households
Gay men: 0.2% of all households
Household received Food Stamps/SNAP in the past 12 months: 21 Household did not receive Food Stamps/SNAP in the past 12 months: 1,230
Women who had a birth in the past 12 months: 35 (36 now married, 0 unmarried) Women who did not have a birth in the past 12 months: 692 (315 now married, 376 unmarried)
Housing units in zip code 07931 with a mortgage: 551 (76 second mortgage, 72 both second mortgage and home equity loan) Median monthly owner costs for units with a mortgage: $3,744 Median monthly owner costs for units without a mortgage: $1,425
Residents with income below the poverty level in 2022:
This zip code:
4.4%
Whole state:
9.7%
Residents with income below 50% of the poverty level in 2022:
This zip code:
1.7%
Whole state:
5.2%
Median number of rooms in houses and condos:
Here:
10.0
State:
6.8
Median number of rooms in apartments:
Here:
6.0
State:
3.9
Notable locations in this zip code not listed on our city pages
Notable locations in zip code 07931: Far Hills Station (A), Camp Saint John (B), Middle Valley Farm (C), Far Hills - Bedminster Fire Department Station 1 (D), Liberty Corner Fire Company (E). Display/hide their locations on the map
In group quarters: 40 (-1 institutionalized population)
Size of family households: 482 2-persons, 212 3-persons, 242 4-persons, 71 5-persons, 12 6-persons, 3 7-or-more-persons
Size of nonfamily households: 189 1-person, 33 2-persons, 15 3-persons
618 married couples with children.
33 single-parent households (6 men, 27 women).
84.6% of residents of 07931 zip code speak English at home.
10.7% of residents speak Spanish at home (60% very well, 38% well, 1% not well).
2.9% of residents speak other Indo-European language at home (95% very well, 5% well).
0.9% of residents speak Asian or Pacific Island language at home (48% very well, 52% well).
0.5% of residents speak other language at home (65% very well, 35% well).
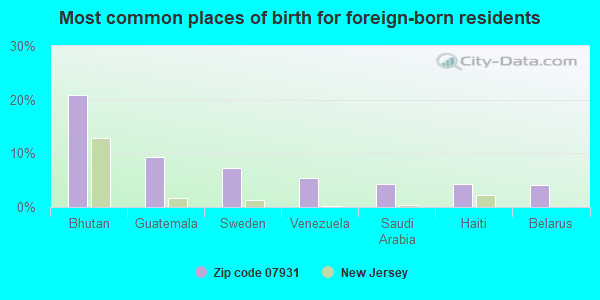
Foreign born population: 368 (10.8%) (66.8% of them are naturalized citizens)
This zip code:
10.8%
Whole state:
23.5%
21%Bhutan
9%Guatemala
7%Sweden
5%Venezuela
4%Saudi Arabia
4%Haiti
4%Belarus
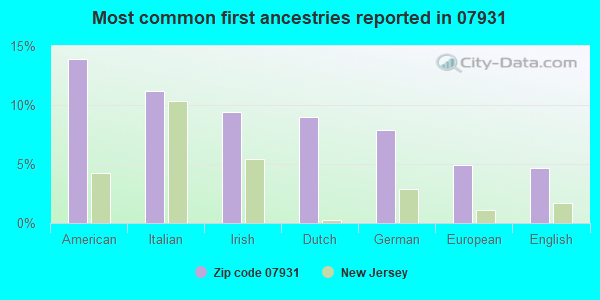
14%American
11%Italian
9%Irish
9%Dutch
8%German
5%European
5%English
Year of entry for the foreign-born population
2642010 or later
412000 to 2009
1631990 to 1999
112Before 1990
Facilities with environmental interests located in this zip code:
FAR HILLS BORO (6 PROSPECT ST in FAR HILLS, NJ)
STATE MASTER (New Jersey environmental info) - NJEMS-025618, STATE CLEANUP SITE, NJEMS-191885, National Pollutant Discharge Elimination System Permit STATE MASTER (New Jersey environmental info) - NJEMS-G000021210, STATE CLEANUP SITE National Pollutant Discharge Elimination System NON-MAJOR (Tracking pollutant discharge elimination systems) - permit Conditionally Exempt Small Quantity Generators, less than 100 kg/month of hazardous waste (Resource Conservation and Recovery Act (tracking hazardous waste)) - notification Organizations: BOROUGH OF FAR HILLS (CONTACT/OWNER)
Alternative names: FAR & HILLS MUNICIPAL BUILDING, FAR HILLS BORO MUNICIPAL BLDG, FAR HILLS MUNICIPAL BUILDING
FAR HILLS COUNTRY DAY SCHOOL CORP (697 MINE BROOK RD in FAR HILLS BORO, NJ)
(Integrated Compliance Information System) - ICIS-02-2005-1208, FORMAL ENFORCEMENT ACTION, ENFORCEMENT/COMPLIANCE ACTIVITY STATE MASTER (New Jersey environmental info) - NJEMS-49250, National Pollutant Discharge Elimination System Permit, NJEMS-018131, STATE CLEANUP SITE, NJEMS-1802312, DRINKING WATER PROGRAM, NJEMS-35945, AIR PROGRAM, NJEMS-45339200000, EPCRA, NJEMS-00754, PESTICIDES-APPLICATION Business SIC classification: ELEMENTARY AND SECONDARY SCHOOLS
8 PEAPACK ROAD (8 PEAPACK RD in FAR HILLS, NJ)
STATE MASTER (New Jersey environmental info) - NJEMS-G000043258, STATE CLEANUP SITE Small Quantity Generators, between 100 kg and 1000 kg of hazardous waste/month (Resource Conservation and Recovery Act (tracking hazardous waste)) - notification TRANSPORTER (Resource Conservation and Recovery Act (tracking hazardous waste)) - notification Organizations: PROSPECT HOLDING CO (CONTACT/OWNER)
Alternative names: PROSPECT HOLDING CO
GRACE FELLOWSHIP CHAPEL (184 LIBERTY CORNER RD in FAR HILLS, NJ)
(Resource Conservation and Recovery Act (tracking hazardous waste))
FRELINGHUYSEN MARION K (THE RIVERHOUSE 600 YDS N OF in FAR HILLS, NJ)
(Resource Conservation and Recovery Act (tracking hazardous waste))
ALLWOOD - HELEN BUCK (222 LIBERTY CORNER RD in FAR HILLS, NJ)
Small Quantity Generators, between 100 kg and 1000 kg of hazardous waste/month (Resource Conservation and Recovery Act (tracking hazardous waste)) - notification
FAR HILLS COUNTRY DAY SCH BD OF TRUSTEES (PO BOX 8 in FAR HILLS, NJ)
COMPLIANCE ACTIVITY (Tracking inspections of insecticide, fungicide, and rodenticide, and toxic substances)
FIDDLER'S ELBOW COUNTRY CLUB (PO BOX 248 in FAR HILLS, NJ)
COMPLIANCE ACTIVITY (Tracking inspections of insecticide, fungicide, and rodenticide, and toxic substances)
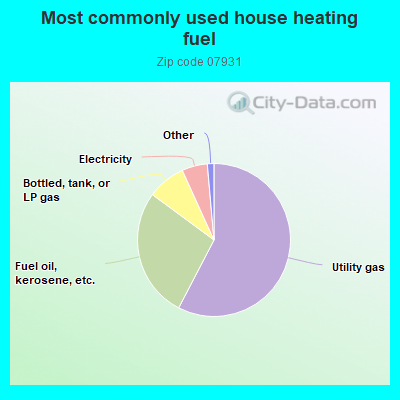
57.7%Utility gas
27.5%Fuel oil, kerosene, etc.
8.1%Bottled, tank, or LP gas
5.4%Electricity
0.9%No fuel used
0.6%Wood
Population in 1990: 2,728. Population change in the 1990s: +38 (+1.4%).
Place of birth for U.S.-born residents:
This state: 1,608
Northeast: 836
Midwest: 148
South: 126
West: 122
46% of the 07931 zip code residents lived in the same house 5 years ago. Out of people who lived in different houses, 38% lived in this county. Out of people who lived in different counties, 50% lived in New Jersey.
88% of the 07931 zip code residents lived in the same house 1 year ago. Out of people who lived in different houses, 18% moved from this county. Out of people who lived in different houses, 22% moved from different county within same state. Out of people who lived in different houses, 67% moved from different state.
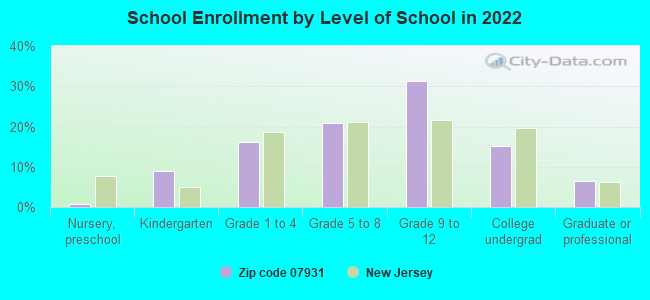
Private vs. public school enrollment:
Students in private schools in grades 1 to 8 (elementary and middle school): 61
Here:
19.7%
New Jersey:
12.3%
Students in private schools in grades 9 to 12 (high school): 98
Here:
37.2%
New Jersey:
13.1%
Students in private undergraduate colleges: 35
Here:
27.7%
New Jersey:
33.2%
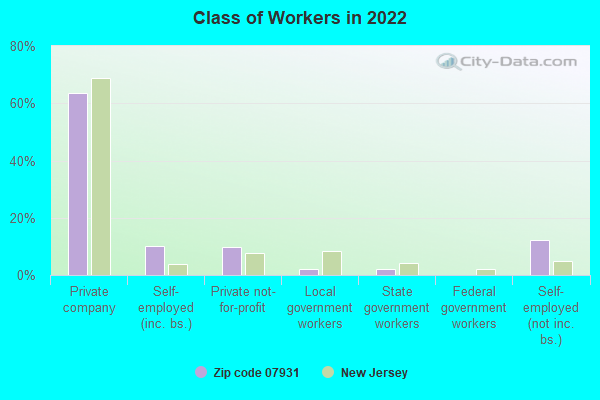
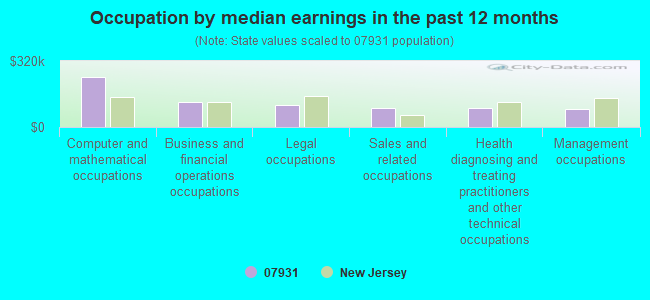
Occupation by median earnings in the past 12 months ($)
241,400Computer and mathematical occupations
119,324Business and financial operations occupations
106,116Legal occupations
93,750Sales and related occupations
90,333Health diagnosing and treating practitioners and other technical occupations
86,169Management occupations
Companies with federal contracts located in this zip code:
LOWITT, RANDI E (2 SADDLE HILL RD in FAR HILLS, NJ; small business)
$7,063 with Army for Other Management Support Services. Signed on 2005-02-23. Completion date: 2005-02-24.
STORMS, ROBIN P (29 MINE BROOK RD in FAR HILLS, NJ; small business) : $960 in 2 contractsin 2004
$968 with Army for Miscellaneous Furniture and Fixtures. Signed on 2004-03-24. Completion date: 2004-04-16.
-$8, same as above.Signed on 2004-03-25. Completion date: 2004-04-16.
Top industries in this zip code by the number of employees in 2005:
Other Services (except Public Administration): Other Similar Organizations (except Business, Professional, Labor, and Political Organizations) (100-249: 1)
Health Care and Social Assistance: Offices of Physicians (except Mental Health Specialists) (50-99: 1, 5-9: 1, 1-4: 1)
Other Services (except Public Administration): Beauty Salons (10-19: 2, 5-9: 2)
Administrative and Support and Waste Management and Remediation Services: Landscaping Services (20-49: 1, 1-4: 4)
Construction: Painting and Wall Covering Contractors (20-49: 1)
Construction: New Single-Family Housing Construction (except Operative Builders) (10-19: 1, 5-9: 2, 1-4: 1)
Real Estate and Rental and Leasing: Offices of Real Estate Agents and Brokers (10-19: 1, 5-9: 1, 1-4: 2)
Administrative and Support and Waste Management and Remediation Services: Travel Agencies (10-19: 1)
People in group quarters in 2010:
101 people in residential schools for people with disabilities
95 people in workers' group living quarters and job corps centers
3 people in other noninstitutional facilities
People in group quarters in 2000:
30 people in nursing homes
7 people in religious group quarters
6 people in other nonhousehold living situations
Fatal accident statistics in 2014:
Fatal accident count: 1
Vehicles involved in fatal accidents: 1
Fatal accidents caused by drunken drivers: 0
Fatalities: 1
Persons involved in fatal accidents: 1
Pedestrians involved in fatal accidents: 0
Fatal accident statistics in 2011:
Fatal accident count: 1
Vehicles involved in fatal accidents: 1
Fatal accidents caused by drunken drivers: 0
Fatalities: 1
Persons involved in fatal accidents: 1
Pedestrians involved in fatal accidents: 1
Home Mortgage Disclosure Act Aggregated Statistics For Year 2009 (Based on 2 full and 8 partial tracts)
A) FHA, FSA/RHS & VA Home Purchase Loans
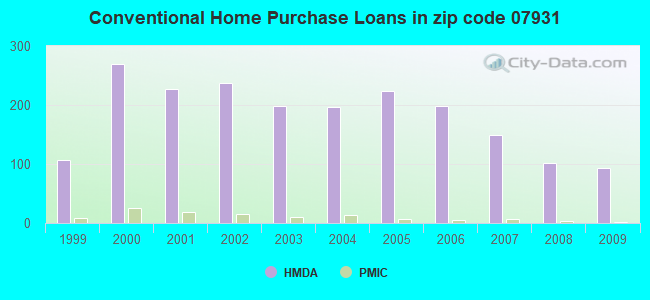
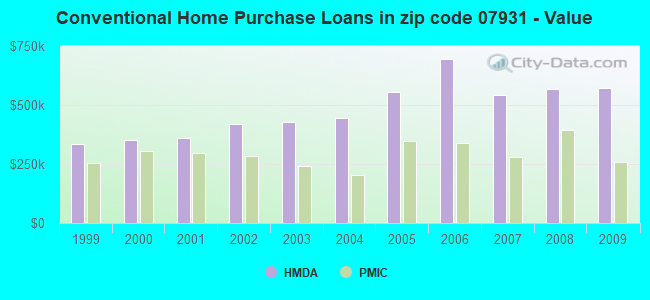
B) Conventional Home Purchase Loans
C) Refinancings
D) Home Improvement Loans
F) Non-occupant Loans on < 5 Family Dwellings (A B C & D)
Number
Average Value
Number
Average Value
Number
Average Value
Number
Average Value
Number
Average Value
LOANS ORIGINATED
13
$305,042
93
$571,982
421
$463,108
9
$274,724
11
$865,359
APPLICATIONS APPROVED, NOT ACCEPTED
0
$0
9
$448,469
38
$441,523
1
$401,300
0
$0
APPLICATIONS DENIED
5
$295,680
6
$582,298
72
$452,255
5
$194,642
1
$918,070
APPLICATIONS WITHDRAWN
1
$183,100
9
$481,128
58
$441,471
1
$292,260
3
$338,150
FILES CLOSED FOR INCOMPLETENESS
0
$0
3
$705,570
17
$419,910
0
$0
0
$0
Aggregated Statistics For Year 2008 (Based on 2 full and 8 partial tracts)
A) FHA, FSA/RHS & VA Home Purchase Loans
B) Conventional Home Purchase Loans
C) Refinancings
D) Home Improvement Loans
E) Loans on Dwellings For 5+ Families
F) Non-occupant Loans on < 5 Family Dwellings (A B C & D)
Number
Average Value
Number
Average Value
Number
Average Value
Number
Average Value
Number
Average Value
Number
Average Value
LOANS ORIGINATED
5
$417,996
101
$566,506
125
$532,940
17
$346,334
0
$0
7
$1,079,806
APPLICATIONS APPROVED, NOT ACCEPTED
1
$752,450
20
$560,988
20
$292,578
6
$290,642
0
$0
0
$0
APPLICATIONS DENIED
1
$767,260
12
$638,444
41
$465,629
6
$283,030
1
$295,300
1
$248,220
APPLICATIONS WITHDRAWN
1
$539,970
15
$515,710
31
$740,040
2
$103,805
0
$0
2
$318,685
FILES CLOSED FOR INCOMPLETENESS
0
$0
5
$546,440
8
$387,586
3
$110,953
0
$0
0
$0
Aggregated Statistics For Year 2007 (Based on 2 full and 8 partial tracts)
B) Conventional Home Purchase Loans
C) Refinancings
D) Home Improvement Loans
F) Non-occupant Loans on < 5 Family Dwellings (A B C & D)
Number
Average Value
Number
Average Value
Number
Average Value
Number
Average Value
LOANS ORIGINATED
150
$541,099
151
$730,685
25
$179,104
8
$1,152,615
APPLICATIONS APPROVED, NOT ACCEPTED
24
$877,390
22
$579,210
7
$162,150
3
$591,077
APPLICATIONS DENIED
22
$613,242
48
$573,936
10
$114,489
8
$453,378
APPLICATIONS WITHDRAWN
23
$753,717
26
$497,392
2
$731,005
3
$895,593
FILES CLOSED FOR INCOMPLETENESS
4
$436,160
10
$470,322
1
$209,800
0
$0
Aggregated Statistics For Year 2006 (Based on 2 full and 8 partial tracts)
B) Conventional Home Purchase Loans
C) Refinancings
D) Home Improvement Loans
F) Non-occupant Loans on < 5 Family Dwellings (A B C & D)
Number
Average Value
Number
Average Value
Number
Average Value
Number
Average Value
LOANS ORIGINATED
198
$696,751
160
$477,962
30
$443,328
12
$604,960
APPLICATIONS APPROVED, NOT ACCEPTED
21
$750,591
23
$783,909
4
$152,380
1
$3,072,820
APPLICATIONS DENIED
15
$847,380
48
$571,175
9
$107,309
2
$1,551,260
APPLICATIONS WITHDRAWN
29
$596,379
44
$470,591
2
$270,970
4
$525,902
FILES CLOSED FOR INCOMPLETENESS
4
$526,930
18
$396,394
1
$222,600
0
$0
Aggregated Statistics For Year 2005 (Based on 2 full and 8 partial tracts)
A) FHA, FSA/RHS & VA Home Purchase Loans
B) Conventional Home Purchase Loans
C) Refinancings
D) Home Improvement Loans
F) Non-occupant Loans on < 5 Family Dwellings (A B C & D)
G) Loans On Manufactured Home Dwelling (A B C & D)
Number
Average Value
Number
Average Value
Number
Average Value
Number
Average Value
Number
Average Value
Number
Average Value
LOANS ORIGINATED
1
$81,300
223
$555,540
211
$539,204
34
$179,842
12
$827,033
1
$27,610
APPLICATIONS APPROVED, NOT ACCEPTED
0
$0
34
$580,795
30
$421,571
2
$83,745
3
$360,400
0
$0
APPLICATIONS DENIED
0
$0
28
$911,910
54
$921,487
10
$250,158
6
$1,191,487
0
$0
APPLICATIONS WITHDRAWN
0
$0
30
$731,389
43
$500,038
6
$126,043
3
$294,893
0
$0
FILES CLOSED FOR INCOMPLETENESS
0
$0
5
$2,637,716
19
$560,637
2
$64,415
2
$227,240
0
$0
Aggregated Statistics For Year 2004 (Based on 2 full and 8 partial tracts)
A) FHA, FSA/RHS & VA Home Purchase Loans
B) Conventional Home Purchase Loans
C) Refinancings
D) Home Improvement Loans
F) Non-occupant Loans on < 5 Family Dwellings (A B C & D)
Number
Average Value
Number
Average Value
Number
Average Value
Number
Average Value
Number
Average Value
LOANS ORIGINATED
1
$241,150
196
$446,550
271
$420,077
25
$150,542
9
$346,262
APPLICATIONS APPROVED, NOT ACCEPTED
0
$0
26
$478,809
33
$319,419
5
$82,068
3
$320,033
APPLICATIONS DENIED
0
$0
15
$607,497
49
$506,157
11
$89,419
3
$208,313
APPLICATIONS WITHDRAWN
0
$0
27
$457,863
55
$463,213
8
$222,915
1
$473,890
FILES CLOSED FOR INCOMPLETENESS
0
$0
7
$700,903
7
$361,344
1
$73,010
0
$0
Aggregated Statistics For Year 2003 (Based on 2 full and 8 partial tracts)
A) FHA, FSA/RHS & VA Home Purchase Loans
B) Conventional Home Purchase Loans
C) Refinancings
D) Home Improvement Loans
F) Non-occupant Loans on < 5 Family Dwellings (A B C & D)
Number
Average Value
Number
Average Value
Number
Average Value
Number
Average Value
Number
Average Value
LOANS ORIGINATED
1
$178,040
199
$428,674
877
$359,380
32
$150,307
15
$270,989
APPLICATIONS APPROVED, NOT ACCEPTED
0
$0
24
$613,268
96
$375,272
4
$93,340
0
$0
APPLICATIONS DENIED
0
$0
9
$482,051
101
$448,715
11
$134,599
5
$305,044
APPLICATIONS WITHDRAWN
0
$0
31
$651,237
89
$379,607
1
$237,330
0
$0
FILES CLOSED FOR INCOMPLETENESS
0
$0
1
$408,930
21
$404,774
1
$81,350
0
$0
Aggregated Statistics For Year 2002 (Based on 2 full and 8 partial tracts)
B) Conventional Home Purchase Loans
C) Refinancings
D) Home Improvement Loans
E) Loans on Dwellings For 5+ Families
F) Non-occupant Loans on < 5 Family Dwellings (A B C & D)
Number
Average Value
Number
Average Value
Number
Average Value
Number
Average Value
Number
Average Value
LOANS ORIGINATED
238
$421,072
655
$380,935
37
$116,868
3
$182,353
20
$380,114
APPLICATIONS APPROVED, NOT ACCEPTED
30
$452,194
71
$296,574
6
$65,750
0
$0
0
$0
APPLICATIONS DENIED
14
$461,993
69
$438,405
14
$411,983
0
$0
3
$1,427,670
APPLICATIONS WITHDRAWN
20
$406,534
84
$840,007
4
$77,828
0
$0
3
$255,943
FILES CLOSED FOR INCOMPLETENESS
5
$354,334
15
$393,617
1
$89,540
0
$0
0
$0
Aggregated Statistics For Year 2001 (Based on 2 full and 8 partial tracts)
B) Conventional Home Purchase Loans
C) Refinancings
D) Home Improvement Loans
F) Non-occupant Loans on < 5 Family Dwellings (A B C & D)
Number
Average Value
Number
Average Value
Number
Average Value
Number
Average Value
LOANS ORIGINATED
227
$361,514
336
$384,367
18
$90,316
6
$531,502
APPLICATIONS APPROVED, NOT ACCEPTED
23
$337,591
40
$413,195
10
$74,238
0
$0
APPLICATIONS DENIED
13
$442,003
55
$749,207
9
$305,824
3
$705,413
APPLICATIONS WITHDRAWN
13
$482,308
47
$293,640
6
$87,312
1
$418,250
FILES CLOSED FOR INCOMPLETENESS
4
$274,620
14
$363,899
0
$0
0
$0
Aggregated Statistics For Year 2000 (Based on 2 full and 8 partial tracts)
B) Conventional Home Purchase Loans
C) Refinancings
D) Home Improvement Loans
E) Loans on Dwellings For 5+ Families
F) Non-occupant Loans on < 5 Family Dwellings (A B C & D)
Number
Average Value
Number
Average Value
Number
Average Value
Number
Average Value
Number
Average Value
LOANS ORIGINATED
270
$352,305
71
$491,858
30
$72,800
1
$184,080
6
$249,160
APPLICATIONS APPROVED, NOT ACCEPTED
38
$347,859
9
$310,250
10
$68,313
0
$0
1
$329,530
APPLICATIONS DENIED
23
$531,971
24
$323,093
13
$54,137
0
$0
3
$377,203
APPLICATIONS WITHDRAWN
36
$309,710
19
$294,103
5
$38,302
0
$0
2
$648,815
FILES CLOSED FOR INCOMPLETENESS
6
$380,997
10
$579,019
1
$57,780
0
$0
0
$0
Aggregated Statistics For Year 1999 (Based on 1 full and 4 partial tracts)
B) Conventional Home Purchase Loans
C) Refinancings
D) Home Improvement Loans
F) Non-occupant Loans on < 5 Family Dwellings (A B C & D)


 Nearest zip codes: 07920, 07924, 07977, 07939, 07921, 07934.