Estimated zip code population in 2022: 9,303 Zip code population in 2010: 8,950 Zip code population in 2000: 8,914
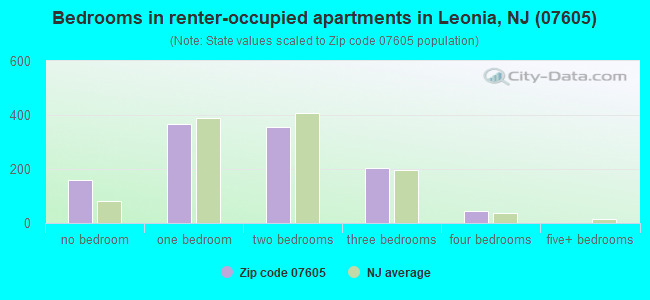
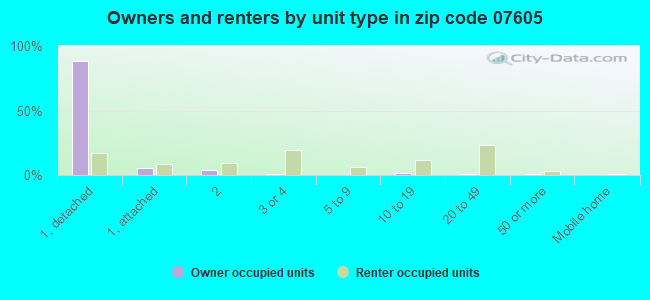
Houses and condos: 3,606 Renter-occupied apartments: 1,132
% of renters here:
32%
State:
35%
March 2022 cost of living index in zip code 07605: 120.4 (high, U.S. average is 100)
Land area: 1.5 sq. mi. Water area: 0.1 sq. mi.
Population density: 6,036 people per square mile
(high).
OSM Map
Google Map
MSN Map
OSM Map
General Map
Google Map
MSN Map
OSM Map
Google Map
MSN Map
OSM Map
Google Map
MSN Map
Please wait while loading the map...
Real estate property taxes paid for housing units in 2022:
This zip code:
1.4% ($9,521)
New Jersey:
2.1% ($8,897)
Median real estate property taxes paid for housing units with mortgages in 2022: $9,557 (1.4%) Median real estate property taxes paid for housing units with no mortgage in 2022: $9,483 (1.6%)
Business Search- 14 Million verified businesses
Males: 4,534
(48.7%)
Females: 4,769
(51.3%)
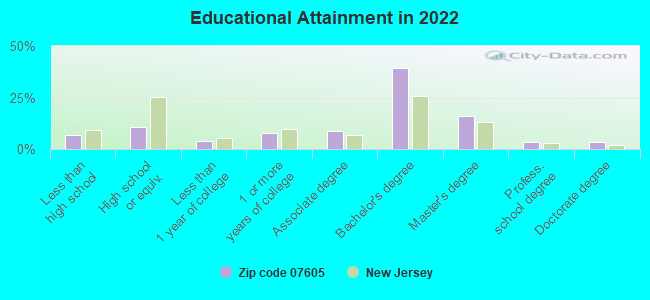
For population 25 years and over in 07605:
High school or higher: 94.0%
Bachelor's degree or higher: 63.0%
Graduate or professional degree: 23.4%
Unemployed: 3.8%
Mean travel time to work (commute): 30.6 minutes
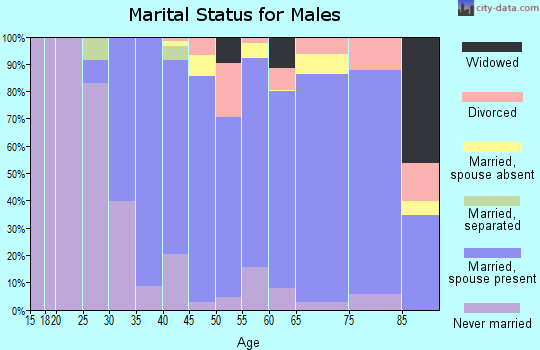
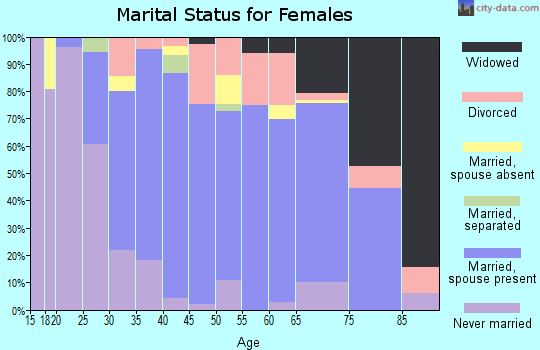
For population 15 years and over in 07605:
Never married: 24.0%
Now married: 63.7%
Separated: 1.3%
Widowed: 4.2%
Divorced: 6.8%
Zip code 07605 compared to state average:
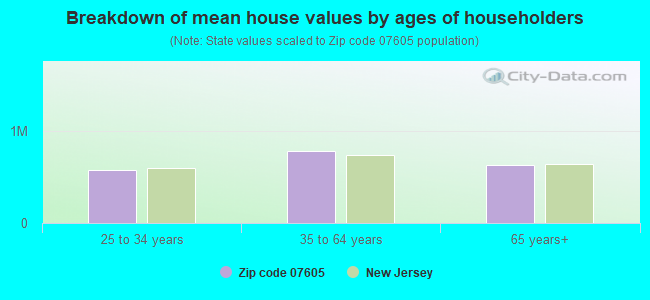
Median house value above state average.
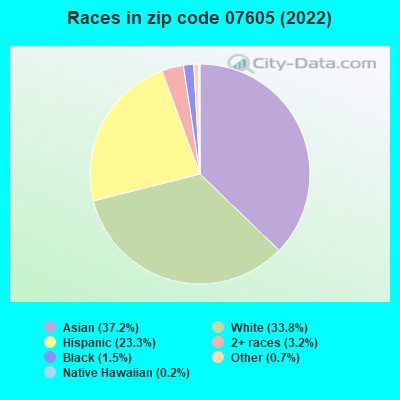
Black race population percentage significantly below state average.
Median age above state average.
Foreign-born population percentage above state average.
Length of stay since moving in significantly above state average.
Estimated median house/condo value in 2022: $662,156
07605:
$662,156
New Jersey:
$428,900
According to our research of New Jersey and other state lists, there was 1 registered sex offender living in 07605 zip code as of June 05, 2024. The ratio of all residents to sex offenders in zip code 07605 is 9,268 to 1. The ratio of registered sex offenders to all residents in this zip code is much lower than the state average.
Median resident age:
This zip code:
45.8 years
New Jersey median age:
40.4 years
Average household size:
This zip code:
2.6 people
New Jersey:
2.6 people
Averages for the 2020 tax year for zip code 07605, filed in 2021:
Average Adjusted Gross Income (AGI) in 2020: $115,561 (Individual Income Tax Returns)
Here:
$115,561
State:
$95,247
Salary/wage: $104,264 (reported on 78.6% of returns)
Here:
$104,264
State:
$80,635
(% of AGI for various income ranges: 1069.7% for AGIs below $25k, 3624.6% for AGIs $25k-50k, 7144.8% for AGIs $50k-75k, 9720.8% for AGIs $75k-100k, 20904.3% for AGIs $100k-200k, 97718.5% for AGIs over 200k)
Taxable interest for individuals: $2,401 (reported on 39.6% of returns)
This zip code:
$2,401
New Jersey:
$2,414
(% of AGI for various income ranges: 26.3% for AGIs below $25k, 52.4% for AGIs $25k-50k, 88.5% for AGIs $50k-75k, 102.5% for AGIs $75k-100k, 222.6% for AGIs $100k-200k, 1108.0% for AGIs over 200k)
Ordinary dividends: $8,797 (reported on 33.9% of returns)
Here:
$8,797
State:
$8,057
(% of AGI for various income ranges: 55.0% for AGIs below $25k, 90.2% for AGIs $25k-50k, 142.7% for AGIs $50k-75k, 313.8% for AGIs $75k-100k, 478.1% for AGIs $100k-200k, 4437.0% for AGIs over 200k)
Net capital gain/loss in AGI: +$16,799 (reported on 32.3% of returns)
Here:
+$16,799
State:
+$25,022
(% of AGI for various income ranges: 13.5% for AGIs below $25k, 100.6% for AGIs $25k-50k, 337.0% for AGIs $50k-75k, 402.9% for AGIs $75k-100k, 422.9% for AGIs $100k-200k, 9534.5% for AGIs over 200k)
Profit/loss from business: +$19,931 (reported on 23.0% of returns)
Here:
+$19,931
State:
+$18,035
(% of AGI for various income ranges: 280.6% for AGIs below $25k, 440.6% for AGIs $25k-50k, 350.0% for AGIs $50k-75k, 395.4% for AGIs $75k-100k, 1159.0% for AGIs $100k-200k, 4424.0% for AGIs over 200k)
Taxable individual retirement arrangement distribution: $24,158 (reported on 8.3% of returns)
07605:
$24,158
New Jersey:
$21,558
(% of AGI for various income ranges: 45.0% for AGIs below $25k, 78.8% for AGIs $25k-50k, 267.3% for AGIs $50k-75k, 327.1% for AGIs $75k-100k, 785.0% for AGIs $100k-200k, 1516.5% for AGIs over 200k)
Self-employed (Keogh) retirement plans: $35,483 (reported on 1.4% of returns)
07605:
$35,483
New Jersey:
$30,844
(% of AGI for various income ranges: 112.1% for AGIs $100k-200k, 829.0% for AGIs over 200k)
Total itemized deductions: $33,604 (reported on 17.7% of returns)
Here:
$33,604
State:
$32,863
(% of AGI for various income ranges: 181.3% for AGIs below $25k, 325.6% for AGIs $25k-50k, 694.5% for AGIs $50k-75k, 965.0% for AGIs $75k-100k, 1692.6% for AGIs $100k-200k, 5648.5% for AGIs over 200k)
Charity contributions: $8,348 (reported on 14.7% of returns)
Here:
$8,348
State:
$7,880
(% of AGI for various income ranges: 8.8% for AGIs below $25k, 26.0% for AGIs $25k-50k, 63.0% for AGIs $50k-75k, 104.2% for AGIs $75k-100k, 325.5% for AGIs $100k-200k, 1664.0% for AGIs over 200k)
Taxes paid: $9,677 (reported on 17.7% of returns)
07605:
$9,677
State:
$9,183
(% of AGI for various income ranges: 62.8% for AGIs below $25k, 110.4% for AGIs $25k-50k, 192.1% for AGIs $50k-75k, 313.3% for AGIs $75k-100k, 556.9% for AGIs $100k-200k, 1373.5% for AGIs over 200k)
Earned income credit: $1,951 (reported on 10.8% of returns)
Here:
$1,951
State:
$2,148
(% of AGI for various income ranges: 80.6% for AGIs below $25k, 73.8% for AGIs $25k-50k)
Percentage of individuals using paid preparers for their 2020 taxes: 93.8%
Here:
94%
State:
92%
(% for various income ranges: 91.6% for AGIs below $25k, 94.7% for AGIs $25k-50k, 94.1% for AGIs $50k-75k, 92.1% for AGIs $75k-100k, 96.5% for AGIs $100k-200k, 93.8% for AGIs over 200k)
Averages for the 2012 tax year for zip code 07605, filed in 2013:
Average Adjusted Gross Income (AGI) in 2012: $93,204 (Individual Income Tax Returns)
Here:
$93,204
State:
$79,688
Salary/wage: $79,420 (reported on 79.7% of returns)
Here:
$79,420
State:
$68,122
(% of AGI for various income ranges: 66.8% for AGIs below $25k, 70.6% for AGIs $25k-50k, 74.2% for AGIs $50k-75k, 73.0% for AGIs $75k-100k, 73.6% for AGIs $100k-200k, 61.6% for AGIs over 200k)
Taxable interest for individuals: $2,035 (reported on 44.8% of returns)
This zip code:
$2,035
New Jersey:
$2,193
(% of AGI for various income ranges: 1.6% for AGIs below $25k, 1.2% for AGIs $25k-50k, 0.9% for AGIs $50k-75k, 1.1% for AGIs $75k-100k, 1.0% for AGIs $100k-200k, 0.9% for AGIs over 200k)
Ordinary dividends: $7,405 (reported on 32.8% of returns)
Here:
$7,405
State:
$6,828
(% of AGI for various income ranges: 3.4% for AGIs below $25k, 2.2% for AGIs $25k-50k, 1.5% for AGIs $50k-75k, 1.7% for AGIs $75k-100k, 2.2% for AGIs $100k-200k, 3.2% for AGIs over 200k)
Net capital gain/loss in AGI: +$15,216 (reported on 27.4% of returns)
Here:
+$15,216
State:
+$15,358
(% of AGI for various income ranges: 0.3% for AGIs $50k-75k, 1.6% for AGIs $100k-200k, 9.4% for AGIs over 200k)
Profit/loss from business: +$25,367 (reported on 22.2% of returns)
Here:
+$25,367
State:
+$19,577
(% of AGI for various income ranges: 16.2% for AGIs below $25k, 10.0% for AGIs $25k-50k, 3.6% for AGIs $50k-75k, 5.4% for AGIs $75k-100k, 4.3% for AGIs $100k-200k, 6.2% for AGIs over 200k)
Taxable individual retirement arrangement distribution: $19,379 (reported on 11.3% of returns)
07605:
$19,379
New Jersey:
$18,214
(% of AGI for various income ranges: 2.6% for AGIs below $25k, 3.5% for AGIs $25k-50k, 3.2% for AGIs $50k-75k, 2.7% for AGIs $75k-100k, 3.0% for AGIs $100k-200k, 1.5% for AGIs over 200k)
Self-employment retirement plans: $22,112 (reported on 1.9% of returns)
07605:
$22,112
New Jersey:
$24,511
(% of AGI for various income ranges: 0.5% for AGIs $100k-200k, 0.7% for AGIs over 200k)
Total itemized deductions: $34,955 (23% of AGI, reported on 50.0% of returns)
Here:
$34,955
State:
$30,827
Here:
22.6% of AGI
State:
21.2% of AGI
(% of AGI for various income ranges: 21.2% for AGIs below $25k, 19.0% for AGIs $25k-50k, 17.9% for AGIs $50k-75k, 22.0% for AGIs $75k-100k, 21.1% for AGIs $100k-200k, 16.4% for AGIs over 200k)
Charity contributions: $3,402 (reported on 42.0% of returns)
Here:
$3,402
State:
$3,451
(% of AGI for various income ranges: 0.8% for AGIs below $25k, 1.2% for AGIs $25k-50k, 1.4% for AGIs $50k-75k, 1.7% for AGIs $75k-100k, 1.9% for AGIs $100k-200k, 1.4% for AGIs over 200k)
Taxes paid: $19,285 (reported on 49.8% of returns)
07605:
$19,285
State:
$15,801
(% of AGI for various income ranges: 9.4% for AGIs below $25k, 8.1% for AGIs $25k-50k, 8.7% for AGIs $50k-75k, 10.6% for AGIs $75k-100k, 11.4% for AGIs $100k-200k, 10.2% for AGIs over 200k)
Earned income credit: $2,094 (reported on 11.1% of returns)
Here:
$2,094
State:
$2,182
(% of AGI for various income ranges: 4.8% for AGIs below $25k, 1.1% for AGIs $25k-50k)
Percentage of individuals using paid preparers for their 2012 taxes: 75.0%
Here:
75%
State:
65%
(% for various income ranges: 73.2% for AGIs below $25k, 73.4% for AGIs $25k-50k, 71.7% for AGIs $50k-75k, 76.2% for AGIs $75k-100k, 76.5% for AGIs $100k-200k, 83.3% for AGIs over 200k)
Averages for the 2004 tax year for zip code 07605, filed in 2005:
Average Adjusted Gross Income (AGI) in 2004: $74,623 (Individual Income Tax Returns)
Here:
$74,623
State:
$64,921
Salary/wage: $67,812 (reported on 78.7% of returns)
Here:
$67,812
State:
$57,755
(% of AGI for various income ranges: 254.5% for AGIs below $10k, 64.0% for AGIs $10k-25k, 74.4% for AGIs $25k-50k, 74.7% for AGIs $50k-75k, 72.5% for AGIs $75k-100k, 70.0% for AGIs over 100k)
Taxable interest for individuals: $2,239 (reported on 61.8% of returns)
This zip code:
$2,239
New Jersey:
$2,068
(% of AGI for various income ranges: 31.0% for AGIs below $10k, 3.8% for AGIs $10k-25k, 2.3% for AGIs $25k-50k, 2.0% for AGIs $50k-75k, 2.1% for AGIs $75k-100k, 1.5% for AGIs over 100k)
Taxable dividends: $4,860 (reported on 40.9% of returns)
Here:
$4,860
State:
$3,959
(% of AGI for various income ranges: 24.2% for AGIs below $10k, 3.3% for AGIs $10k-25k, 2.0% for AGIs $25k-50k, 1.9% for AGIs $50k-75k, 2.7% for AGIs $75k-100k, 2.8% for AGIs over 100k)
Net capital gain/loss: +$8,133 (reported on 34.5% of returns)
Here:
+$8,133
State:
+$13,591
(% of AGI for various income ranges: -24.5% for AGIs below $10k, -0.3% for AGIs $10k-25k, 0.6% for AGIs $25k-50k, 1.1% for AGIs $50k-75k, 1.3% for AGIs $75k-100k, 5.5% for AGIs over 100k)
Profit/loss from business: +$20,805 (reported on 23.8% of returns)
Here:
+$20,805
State:
+$17,520
(% of AGI for various income ranges: 47.2% for AGIs below $10k, 16.0% for AGIs $10k-25k, 9.0% for AGIs $25k-50k, 5.1% for AGIs $50k-75k, 4.4% for AGIs $75k-100k, 6.2% for AGIs over 100k)
IRA payment deduction: $3,665 (reported on 4.0% of returns)
07605:
$3,665
New Jersey:
$3,270
(% of AGI for various income ranges: 0.5% for AGIs $10k-25k, 0.3% for AGIs $25k-50k, 0.4% for AGIs $50k-75k, 0.3% for AGIs $75k-100k, 0.1% for AGIs over 100k)
Self-employed pension: $18,946 (reported on 2.8% of returns)
Here:
$18,946
New Jersey:
$17,258
(% of AGI for various income ranges: 6.7% for AGIs below $10k, 0.5% for AGIs $50k-75k, 1.0% for AGIs over 100k)
Total itemized deductions: $27,112 (23% of AGI, reported on 53.3% of returns)
Here:
$27,112
State:
$23,924
Here:
22.8% of AGI
State:
21.1% of AGI
(% of AGI for various income ranges: 80.2% for AGIs below $10k, 20.2% for AGIs $10k-25k, 20.5% for AGIs $25k-50k, 23.4% for AGIs $50k-75k, 23.5% for AGIs $75k-100k, 17.5% for AGIs over 100k)
Charity contributions deductions: $3,078 (2% of AGI, reported on 47.0% of returns)
Here:
$3,078
State:
$3,242
Here:
2.4% of AGI
State:
2.7% of AGI
(% of AGI for various income ranges: 4.2% for AGIs below $10k, 1.5% for AGIs $10k-25k, 1.7% for AGIs $25k-50k, 2.3% for AGIs $50k-75k, 2.4% for AGIs $75k-100k, 1.9% for AGIs over 100k)
Total tax: $14,094 (reported on 81.6% of returns)
07605:
$14,094
State:
$12,321
(% of AGI for various income ranges: 19.0% for AGIs below $10k, 5.5% for AGIs $10k-25k, 7.4% for AGIs $25k-50k, 8.9% for AGIs $50k-75k, 10.4% for AGIs $75k-100k, 19.2% for AGIs over 100k)
Earned income credit: $1,505 (reported on 7.8% of returns)
Here:
$1,505
State:
$1,711
Percentage of individuals using paid preparers for their 2004 taxes: 74.5%
Here:
74%
State:
65%
(% for various income ranges: 66.0% for AGIs below $10k, 74.8% for AGIs $10k-25k, 73.7% for AGIs $25k-50k, 78.5% for AGIs $50k-75k, 74.7% for AGIs $75k-100k, 79.1% for AGIs over 100k)
Likely homosexual households (counted as self-reported same-sex unmarried-partner households)
Lesbian couples: 0.0% of all households
Gay men: 0.1% of all households
Household received Food Stamps/SNAP in the past 12 months: 91 Household did not receive Food Stamps/SNAP in the past 12 months: 3,397
Women who had a birth in the past 12 months: 56 (45 now married, 11 unmarried) Women who did not have a birth in the past 12 months: 1,674 (939 now married, 730 unmarried)
Housing units in zip code 07605 with a mortgage: 1,562 (173 second mortgage, 11 home equity loan, 148 both second mortgage and home equity loan) Houses without a mortgage: 35
Median monthly owner costs for units with a mortgage: $3,445 Median monthly owner costs for units without a mortgage: $1,425
Residents with income below the poverty level in 2022:
This zip code:
4.5%
Whole state:
9.7%
Residents with income below 50% of the poverty level in 2022:
This zip code:
0.6%
Whole state:
5.2%
Median number of rooms in houses and condos:
Here:
6.6
State:
6.8
Median number of rooms in apartments:
Here:
3.4
State:
3.9
Notable locations in this zip code not listed on our city pages
Churches in zip code 07605 include: Congregation Sons of Israel (A), All Saints Episcopal Church (B), Congregation Adas Emuno (C), Leonia Presbyterian Church (D), Saint John the Evangelist Roman Catholic Church (E), Leonia United Methodist Church (F), Holy Spirit Lutheran Church (G). Display/hide their locations on the map
In group quarters: 12 (-1 institutionalized population)
Size of family households: 891 2-persons, 801 3-persons, 628 4-persons, 180 5-persons, 32 7-or-more-persons
Size of nonfamily households: 833 1-person, 104 2-persons, 37 3-persons
1,309 married couples with children.
233 single-parent households (58 men, 175 women).
46.6% of residents of 07605 zip code speak English at home.
15.0% of residents speak Spanish at home (64% very well, 30% well, 5% not well).
6.3% of residents speak other Indo-European language at home (87% very well, 13% well).
30.8% of residents speak Asian or Pacific Island language at home (45% very well, 28% well, 25% not well, 1% not at all).
1.2% of residents speak other language at home (87% very well, 13% not well).
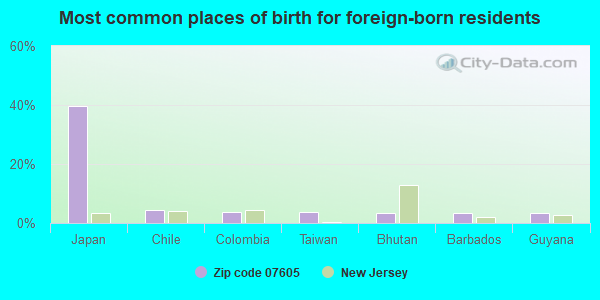
Foreign born population: 4,139 (44.5%) (63.3% of them are naturalized citizens)
This zip code:
44.5%
Whole state:
23.5%
40%Japan
4%Chile
4%Colombia
4%Taiwan
4%Bhutan
4%Barbados
3%Guyana
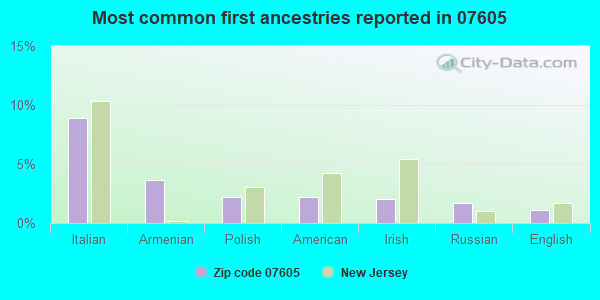
9%Italian
4%Armenian
2%Polish
2%American
2%Irish
2%Russian
1%English
Year of entry for the foreign-born population
1,2132010 or later
1,0222000 to 2009
1,1461990 to 1999
1,222Before 1990
Facilities with environmental interests located in this zip code:
CHEVRON SERVICE STATION #1282327 (350 GRAND AVENUE in LEONIA, NJ)
STATE MASTER (New Jersey environmental info) - NJEMS-007407, STATE CLEANUP SITE, NJEMS-01534, AIR PROGRAM Large Quantity Generators, more that 1000 kg of hazardous waste/month (Resource Conservation and Recovery Act (tracking hazardous waste)) Organizations: CHEVRON USA INC, CHEVRON PRODUCTS CO (CONTACT/OPERATOR)
, CHEVRON PRODUCTS CO INC (CONTACT/OWNER)
Alternative names: CHEVRON USA PRODUCTS CO 204689
A&D AUTO BODY INC (118 FORT LEE RD in LEONIA, NJ)
STATE MASTER (New Jersey environmental info) - NJEMS-30872400000, EPCRA, NJEMS-G0094, AIR PROGRAM Small Quantity Generators, between 100 kg and 1000 kg of hazardous waste/month (Resource Conservation and Recovery Act (tracking hazardous waste)) - notification Business SIC classification: TOP, BODY, AND UPHOLSTERY REPAIR SHOPS AND PAINT SHOPS; GENERAL AUTOMOTIVE REPAIR SHOPS Organizations: OWNERNAME (CONTACT/OWNER)
BRADLEY TELECOM CORP (117 FORT LEE ROAD in LEONIA, NJ)
STATE MASTER (New Jersey environmental info) - NJEMS-G000003765, STATE CLEANUP SITE (Resource Conservation and Recovery Act (tracking hazardous waste)) Alternative names: BRADLEY TELCOM CORP
PARKWAY MOTORS OF LEONIA INC BODY SHOP (335 GRAND AVENUE in LEONIA, NJ)
STATE MASTER (New Jersey environmental info) - NJEMS-004517, STATE CLEANUP SITE, NJEMS-12969700000, EPCRA, NJEMS-G0093, AIR PROGRAM, NJEMS-NJD980777841, HAZARDOUS WASTE PROGRAM Small Quantity Generators, between 100 kg and 1000 kg of hazardous waste/month (Resource Conservation and Recovery Act (tracking hazardous waste)) Business SIC classification: ELECTRICAL APPARATUS AND EQUIPMENT, WIRING SUPPLIES, AND CONSTRUCTION MATERIALS; MOTOR VEHICLE DEALERS (NEW AND USED) Organizations: PARKWAY MOTORS INC Alternative names: PARKWAY MOTORS INC
ALL SAINTS CHURCH (150 PARK AVENUE in LEONIA, NJ)
COMPLIANCE ACTIVITY (Tracking inspections of insecticide, fungicide, and rodenticide, and toxic substances)
Housing units lacking complete plumbing facilities: 0.2% Housing units lacking complete kitchen facilities: 0.9%
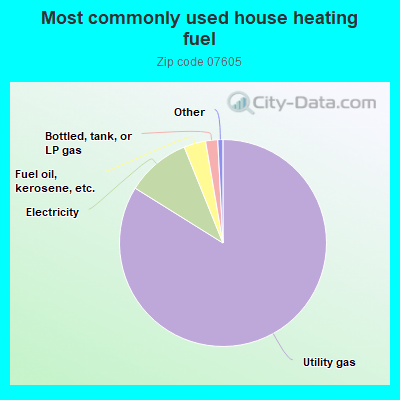
83.8%Utility gas
10.0%Electricity
3.4%Fuel oil, kerosene, etc.
1.9%Bottled, tank, or LP gas
Population in 1990: 8,326. Population change in the 1990s: +588 (+7.1%).
Place of birth for U.S.-born residents:
This state: 2,286
Northeast: 1,891
Midwest: 230
South: 72
West: 229
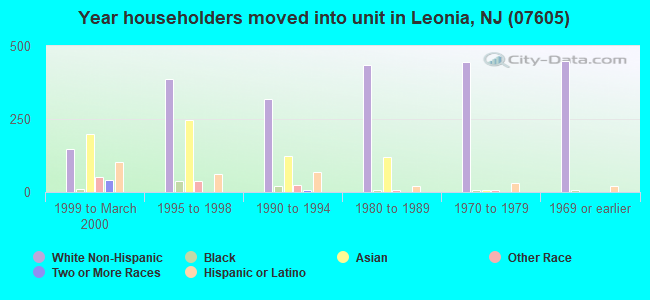
68% of the 07605 zip code residents lived in the same house 5 years ago. Out of people who lived in different houses, 56% lived in this county. Out of people who lived in different counties, 50% lived in New Jersey.
94% of the 07605 zip code residents lived in the same house 1 year ago. Out of people who lived in different houses, 54% moved from this county. Out of people who lived in different houses, 43% moved from different state. Out of people who lived in different houses, 8% moved from abroad.
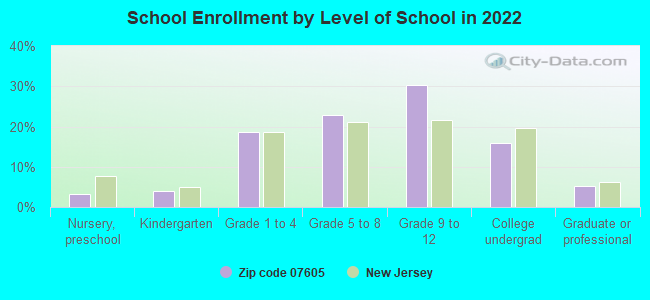
Private vs. public school enrollment:
Students in private schools in grades 1 to 8 (elementary and middle school): 12
Here:
1.5%
New Jersey:
12.3%
Students in private schools in grades 9 to 12 (high school): 100
Here:
16.1%
New Jersey:
13.1%
Students in private undergraduate colleges: 172
Here:
51.5%
New Jersey:
33.2%
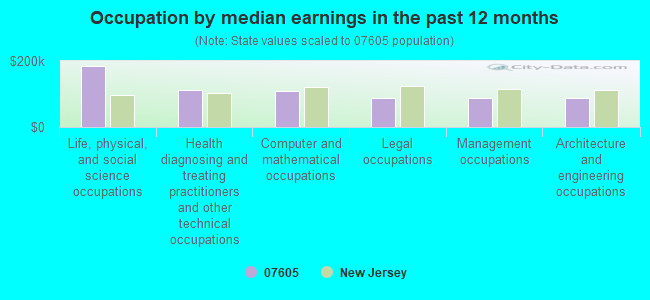
Occupation by median earnings in the past 12 months ($)
185,570Life, physical, and social science occupations
112,294Health diagnosing and treating practitioners and other technical occupations
110,105Computer and mathematical occupations
89,193Legal occupations
87,502Management occupations
87,275Architecture and engineering occupations
Companies with federal contracts located in this zip code (LEONIA, NJ):
GREEN REVIEWS, INC (169 AMES AVENUE; small business) : $1,005,810 in 17 contractsfrom 2003 to 2006
Contracts for Other Architect and Engineering Services, Environmental Studies and Assessments, Other Professional Services, Architect - Engineer Services (including landscaping, interior layout, and designing), and moreby Navy, Department of Veterans Affairs, Public Buildings Service, Army, and others Signed by year:2000: $0; 2001: $0; 2002: $0; 2003: $92,260; 2004: $15,319; 2005: $720,936; 2006: $177,295.
Biggest contracts:
$720,936 with Navy for Other Architect and Engineering Services. Taking place in PA. Signed on 2005-09-23. Completion date: 2006-09-22.
$74,631 with Department of Veterans Affairs for Environmental Studies and Assessments. Signed on 2006-09-28. Completion date: 2006-12-31.
$71,539 with Public Buildings Service for Other Professional Services. Taking place in DC. Signed on 2006-08-03. Effective on 2006-07-31. Completion date: 2007-06-30.
$39,275 with Navy for Architect - Engineer Services (including landscaping, interior layout, and designing). Taking place in CT. Signed on 2003-09-29. Completion date: 2004-09-29.
MATERIAL INNOVATION INC (130 WOODRIDGE PLACE; small business) : $505,000 in 3 contractsin 2000
$255,000 with Navy for Other Defense -- Basic Research (R&D). Signed on 2000-01-05. Completion date: 2000-05-13.
$180,000, same as above.Signed on 2000-05-04. Completion date: 2000-11-30.
$70,000 with Navy for Product or Service Improvement -- Basic Research (R&D). Signed on 2000-05-12. Completion date: 2000-11-12.
I/O UNIVERSAL TECHNOLOGIE (329 MOORE AVE; small business)
$10,875 with Air Force for ADP Components. Signed on 2005-09-30. Completion date: 2005-11-20.
VOIGT LIGHTING INDUSTRIES INC (135 FORT LEE RD STE 202; small business)
$4,799 with Air Force for Indoor and Outdoor Electric Lighting Fixtures. Signed on 2004-12-21. Completion date: 2005-02-01.
Top industries in this zip code by the number of employees in 2005:
Professional, Scientific, and Technical Services: Other Computer Related Services (100-249 employees: 1 establishment)
Finance and Insurance: Direct Life Insurance Carriers (100-249: 1)
Health Care and Social Assistance: Child Day Care Services (50-99: 1, 20-49: 1, 10-19: 1, 5-9: 1, 1-4: 3)
Management of Companies and Enterprises: Corporate, Subsidiary, and Regional Managing Offices (50-99: 1, 10-19: 1)
Accommodation and Food Services: Limited-Service Restaurants (20-49: 2, 1-4: 3)
Other Services (except Public Administration): Religious Organizations (20-49: 1, 10-19: 1, 1-4: 6)
People in group quarters in 2010:
11 people in other noninstitutional facilities
6 people in group homes intended for adults
People in group quarters in 2000:
8 people in homes for the mentally retarded
7 people in religious group quarters
5 people in other noninstitutional group quarters
Fatal accident statistics in 2014:
Fatal accident count: 2
Vehicles involved in fatal accidents: 3
Fatal accidents caused by drunken drivers: 0
Fatalities: 2
Persons involved in fatal accidents: 2
Pedestrians involved in fatal accidents: 2
Home Mortgage Disclosure Act Aggregated Statistics For Year 2009 (Based on 2 full and 2 partial tracts)
A) FHA, FSA/RHS & VA Home Purchase Loans
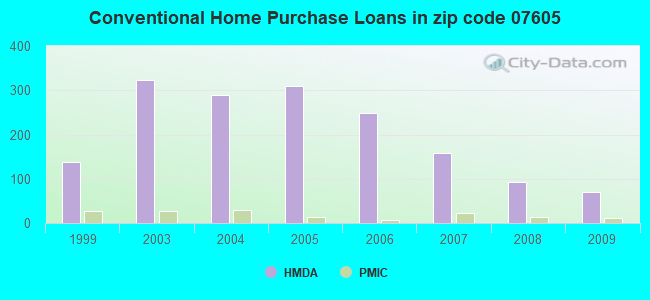
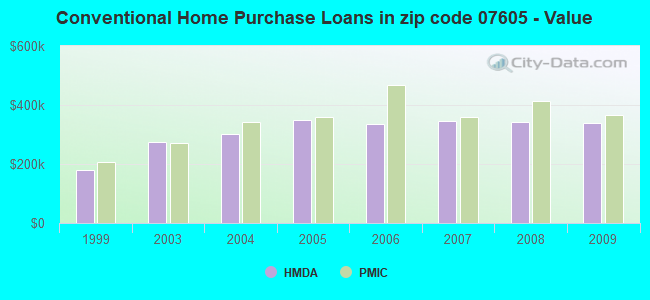
B) Conventional Home Purchase Loans
C) Refinancings
D) Home Improvement Loans
E) Loans on Dwellings For 5+ Families
F) Non-occupant Loans on < 5 Family Dwellings (A B C & D)
Number
Average Value
Number
Average Value
Number
Average Value
Number
Average Value
Number
Average Value
Number
Average Value
LOANS ORIGINATED
19
$399,724
70
$339,188
307
$318,367
13
$140,802
0
$0
2
$215,955
APPLICATIONS APPROVED, NOT ACCEPTED
4
$390,922
5
$353,566
28
$314,900
4
$85,775
2
$336,800
0
$0
APPLICATIONS DENIED
0
$0
11
$278,690
106
$337,758
9
$153,600
0
$0
5
$147,182
APPLICATIONS WITHDRAWN
2
$346,930
5
$331,568
46
$348,350
0
$0
0
$0
0
$0
FILES CLOSED FOR INCOMPLETENESS
0
$0
2
$294,940
30
$289,702
0
$0
0
$0
0
$0
Aggregated Statistics For Year 2008 (Based on 2 full and 2 partial tracts)
A) FHA, FSA/RHS & VA Home Purchase Loans
B) Conventional Home Purchase Loans
C) Refinancings
D) Home Improvement Loans
E) Loans on Dwellings For 5+ Families
F) Non-occupant Loans on < 5 Family Dwellings (A B C & D)
G) Loans On Manufactured Home Dwelling (A B C & D)
Number
Average Value
Number
Average Value
Number
Average Value
Number
Average Value
Number
Average Value
Number
Average Value
Number
Average Value
LOANS ORIGINATED
4
$450,135
92
$344,030
153
$296,868
28
$66,028
2
$968,300
11
$289,235
0
$0
APPLICATIONS APPROVED, NOT ACCEPTED
4
$444,638
20
$365,196
26
$271,437
7
$10,179
0
$0
0
$0
0
$0
APPLICATIONS DENIED
0
$0
20
$395,009
70
$340,201
23
$74,033
0
$0
6
$197,315
2
$149,970
APPLICATIONS WITHDRAWN
0
$0
21
$422,502
30
$402,841
5
$63,992
0
$0
2
$252,600
0
$0
FILES CLOSED FOR INCOMPLETENESS
0
$0
5
$419,640
2
$234,955
4
$60,988
0
$0
0
$0
0
$0
Aggregated Statistics For Year 2007 (Based on 2 full and 2 partial tracts)
A) FHA, FSA/RHS & VA Home Purchase Loans
B) Conventional Home Purchase Loans
C) Refinancings
D) Home Improvement Loans
E) Loans on Dwellings For 5+ Families
F) Non-occupant Loans on < 5 Family Dwellings (A B C & D)
Number
Average Value
Number
Average Value
Number
Average Value
Number
Average Value
Number
Average Value
Number
Average Value
LOANS ORIGINATED
2
$249,230
159
$346,983
202
$298,473
31
$120,202
4
$939,548
7
$263,186
APPLICATIONS APPROVED, NOT ACCEPTED
0
$0
37
$425,561
40
$328,064
13
$56,298
0
$0
8
$536,142
APPLICATIONS DENIED
0
$0
35
$409,521
122
$332,913
29
$82,854
2
$421,000
4
$209,968
APPLICATIONS WITHDRAWN
0
$0
29
$315,934
52
$338,425
2
$159,980
0
$0
5
$257,652
FILES CLOSED FOR INCOMPLETENESS
0
$0
5
$414,652
29
$319,590
0
$0
0
$0
0
$0
Aggregated Statistics For Year 2006 (Based on 2 full and 2 partial tracts)
B) Conventional Home Purchase Loans
C) Refinancings
D) Home Improvement Loans
E) Loans on Dwellings For 5+ Families
F) Non-occupant Loans on < 5 Family Dwellings (A B C & D)
Number
Average Value
Number
Average Value
Number
Average Value
Number
Average Value
Number
Average Value
LOANS ORIGINATED
249
$334,005
327
$317,999
56
$107,939
4
$1,147,812
29
$296,641
APPLICATIONS APPROVED, NOT ACCEPTED
26
$303,076
69
$270,772
15
$99,707
0
$0
3
$363,743
APPLICATIONS DENIED
68
$420,284
139
$352,197
36
$218,161
0
$0
29
$316,506
APPLICATIONS WITHDRAWN
17
$424,255
93
$395,331
3
$282,350
0
$0
9
$382,682
FILES CLOSED FOR INCOMPLETENESS
11
$222,662
16
$362,330
0
$0
0
$0
0
$0
Aggregated Statistics For Year 2005 (Based on 2 full and 2 partial tracts)
B) Conventional Home Purchase Loans
C) Refinancings
D) Home Improvement Loans
E) Loans on Dwellings For 5+ Families
F) Non-occupant Loans on < 5 Family Dwellings (A B C & D)
Number
Average Value
Number
Average Value
Number
Average Value
Number
Average Value
Number
Average Value
LOANS ORIGINATED
310
$348,562
309
$302,886
62
$142,238
2
$1,136,700
32
$299,831
APPLICATIONS APPROVED, NOT ACCEPTED
21
$431,040
86
$305,151
5
$57,150
0
$0
5
$320,528
APPLICATIONS DENIED
51
$367,962
134
$327,523
18
$101,261
0
$0
9
$437,569
APPLICATIONS WITHDRAWN
35
$335,922
94
$290,980
15
$136,853
0
$0
9
$237,533
FILES CLOSED FOR INCOMPLETENESS
9
$417,401
42
$264,191
2
$21,050
0
$0
2
$454,680
Aggregated Statistics For Year 2004 (Based on 2 full and 2 partial tracts)
B) Conventional Home Purchase Loans
C) Refinancings
D) Home Improvement Loans
E) Loans on Dwellings For 5+ Families
F) Non-occupant Loans on < 5 Family Dwellings (A B C & D)
Number
Average Value
Number
Average Value
Number
Average Value
Number
Average Value
Number
Average Value
LOANS ORIGINATED
290
$300,722
376
$264,038
47
$99,784
4
$247,450
34
$245,359
APPLICATIONS APPROVED, NOT ACCEPTED
50
$336,044
52
$278,322
16
$140,658
0
$0
7
$195,344
APPLICATIONS DENIED
53
$308,747
103
$316,534
16
$65,621
0
$0
8
$283,754
APPLICATIONS WITHDRAWN
55
$366,219
80
$259,038
11
$116,797
0
$0
9
$436,618
FILES CLOSED FOR INCOMPLETENESS
8
$285,228
15
$308,858
2
$49,990
0
$0
0
$0
Aggregated Statistics For Year 2003 (Based on 2 full and 2 partial tracts)
B) Conventional Home Purchase Loans
C) Refinancings
D) Home Improvement Loans
E) Loans on Dwellings For 5+ Families
F) Non-occupant Loans on < 5 Family Dwellings (A B C & D)
Number
Average Value
Number
Average Value
Number
Average Value
Number
Average Value
Number
Average Value
LOANS ORIGINATED
324
$275,718
970
$222,755
42
$114,982
5
$626,448
31
$220,602
APPLICATIONS APPROVED, NOT ACCEPTED
31
$267,043
123
$211,025
13
$56,955
0
$0
4
$259,858
APPLICATIONS DENIED
14
$283,835
184
$259,008
20
$68,314
0
$0
14
$240,469
APPLICATIONS WITHDRAWN
39
$308,871
139
$276,855
9
$75,776
0
$0
4
$138,610
FILES CLOSED FOR INCOMPLETENESS
4
$252,950
33
$235,468
2
$29,470
0
$0
0
$0
Aggregated Statistics For Year 1999 (Based on 1 partial tract)
A) FHA, FSA/RHS & VA Home Purchase Loans
B) Conventional Home Purchase Loans
C) Refinancings
D) Home Improvement Loans
E) Loans on Dwellings For 5+ Families
F) Non-occupant Loans on < 5 Family Dwellings (A B C & D)
Detailed PMIC statistics for the following Tracts:0280.01
, 0280.02
2003 - 2018 National Fire Incident Reporting System (NFIRS) incidents
According to the data from the years 2003 - 2018 the average number of fire incidents per year is 45. The highest number of reported fires - 96 took place in 2013, and the least - 1 in 2006. The data has a rising trend.
When looking into fire subcategories, the most incidents belonged to: Structure Fires (83.1%), and Outside Fires (8.9%).
Fire incident types reported to NFIRS in Zip Code 07605


 Nearest zip codes: 07650, 07024, 07631, 07660, 07666, 07657.


 According to the data from the years 2003 - 2018 the average number of fire incidents per year is 45. The highest number of reported fires - 96 took place in 2013, and the least - 1 in 2006. The data has a rising trend.
 When looking into fire subcategories, the most incidents belonged to: Structure Fires (83.1%), and Outside Fires (8.9%).