Estimated zip code population in 2022: 35,366 Zip code population in 2010: 32,698 Zip code population in 2000: 31,455
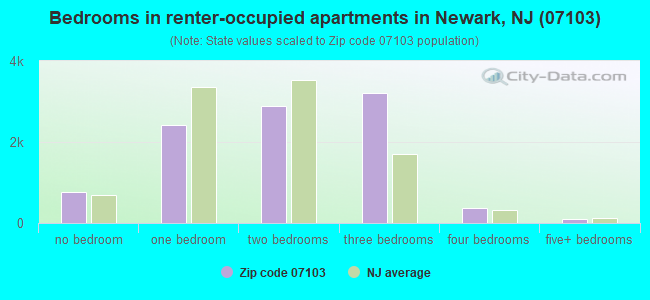
Houses and condos: 14,101 Renter-occupied apartments: 9,857
% of renters here:
76%
State:
35%
March 2022 cost of living index in zip code 07103: 114.7 (more than average, U.S. average is 100)
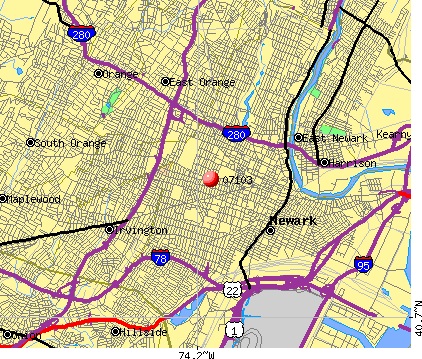
Land area: 2.1 sq. mi. Water area: 0.0 sq. mi.
Population density: 16,626 people per square mile
(very high).
OSM Map
Google Map
MSN Map
OSM Map
General Map
Google Map
MSN Map
OSM Map
Google Map
MSN Map
OSM Map
Google Map
MSN Map
Please wait while loading the map...
Real estate property taxes paid for housing units in 2022:
This zip code:
2.3% ($5,878)
New Jersey:
2.1% ($8,897)
Median real estate property taxes paid for housing units with mortgages in 2022: $6,307 (2.4%) Median real estate property taxes paid for housing units with no mortgage in 2022: $4,598 (1.8%)
Averages for the 2020 tax year for zip code 07103, filed in 2021:
Average Adjusted Gross Income (AGI) in 2020: $34,844 (Individual Income Tax Returns)
Here:
$34,844
State:
$95,247
Salary/wage: $33,844 (reported on 86.1% of returns)
Here:
$33,844
State:
$80,635
(% of AGI for various income ranges: 1067.9% for AGIs below $25k, 3513.0% for AGIs $25k-50k, 6928.4% for AGIs $50k-75k, 10755.3% for AGIs $75k-100k, 17645.5% for AGIs $100k-200k, 52946.7% for AGIs over 200k)
Taxable interest for individuals: $302 (reported on 6.8% of returns)
This zip code:
$302
New Jersey:
$2,414
(% of AGI for various income ranges: 0.7% for AGIs below $25k, 1.2% for AGIs $25k-50k, 2.9% for AGIs $50k-75k, 7.8% for AGIs $75k-100k, 13.0% for AGIs $100k-200k, 303.3% for AGIs over 200k)
Ordinary dividends: $884 (reported on 3.0% of returns)
Here:
$884
State:
$8,057
(% of AGI for various income ranges: 0.5% for AGIs below $25k, 0.7% for AGIs $25k-50k, 2.2% for AGIs $50k-75k, 7.8% for AGIs $75k-100k, 27.6% for AGIs $100k-200k, 583.3% for AGIs over 200k)
Net capital gain/loss in AGI: +$3,443 (reported on 3.1% of returns)
Here:
+$3,443
State:
+$25,022
(% of AGI for various income ranges: 1.2% for AGIs below $25k, 0.6% for AGIs $25k-50k, 18.3% for AGIs $50k-75k, 26.5% for AGIs $75k-100k, 277.6% for AGIs $100k-200k, 613.3% for AGIs over 200k)
Profit/loss from business: +$3,400 (reported on 18.4% of returns)
Here:
+$3,400
State:
+$18,035
(% of AGI for various income ranges: 130.2% for AGIs below $25k, 5.1% for AGIs $25k-50k, 25.0% for AGIs $50k-75k, 157.1% for AGIs $75k-100k, 160.9% for AGIs $100k-200k)
Taxable individual retirement arrangement distribution: $10,472 (reported on 1.2% of returns)
07103:
$10,472
New Jersey:
$21,558
(% of AGI for various income ranges: 4.9% for AGIs below $25k, 7.6% for AGIs $25k-50k, 23.5% for AGIs $50k-75k, 76.5% for AGIs $75k-100k, 180.3% for AGIs $100k-200k)
Total itemized deductions: $26,280 (reported on 5.7% of returns)
Here:
$26,280
State:
$32,863
(% of AGI for various income ranges: 28.4% for AGIs below $25k, 131.8% for AGIs $25k-50k, 410.1% for AGIs $50k-75k, 803.5% for AGIs $75k-100k, 1296.4% for AGIs $100k-200k, 3660.0% for AGIs over 200k)
Charity contributions: $7,611 (reported on 4.5% of returns)
Here:
$7,611
State:
$7,880
(% of AGI for various income ranges: 2.1% for AGIs below $25k, 25.5% for AGIs $25k-50k, 99.0% for AGIs $50k-75k, 182.4% for AGIs $75k-100k, 355.5% for AGIs $100k-200k, 1313.3% for AGIs over 200k)
Taxes paid: $9,751 (reported on 5.7% of returns)
07103:
$9,751
State:
$9,183
(% of AGI for various income ranges: 11.5% for AGIs below $25k, 50.9% for AGIs $25k-50k, 144.9% for AGIs $50k-75k, 304.9% for AGIs $75k-100k, 462.7% for AGIs $100k-200k, 1023.3% for AGIs over 200k)
Earned income credit: $2,589 (reported on 37.0% of returns)
Here:
$2,589
State:
$2,148
(% of AGI for various income ranges: 171.8% for AGIs below $25k, 109.5% for AGIs $25k-50k, 1.0% for AGIs $50k-75k)
Percentage of individuals using paid preparers for their 2020 taxes: 93.8%
Here:
94%
State:
92%
(% for various income ranges: 94.0% for AGIs below $25k, 94.7% for AGIs $25k-50k, 91.8% for AGIs $50k-75k, 92.9% for AGIs $75k-100k, 92.5% for AGIs $100k-200k, 85.7% for AGIs over 200k)
Averages for the 2012 tax year for zip code 07103, filed in 2013:
Average Adjusted Gross Income (AGI) in 2012: $29,133 (Individual Income Tax Returns)
Here:
$29,133
State:
$79,688
Salary/wage: $29,135 (reported on 85.7% of returns)
Here:
$29,135
State:
$68,122
(% of AGI for various income ranges: 71.3% for AGIs below $25k, 91.6% for AGIs $25k-50k, 92.2% for AGIs $50k-75k, 88.4% for AGIs $75k-100k, 86.1% for AGIs $100k-200k)
Taxable interest for individuals: $255 (reported on 7.9% of returns)
This zip code:
$255
New Jersey:
$2,193
(% of AGI for various income ranges: 0.2% for AGIs $100k-200k)
Ordinary dividends: $715 (reported on 2.7% of returns)
Here:
$715
State:
$6,828
(% of AGI for various income ranges: 0.2% for AGIs $100k-200k)
Net capital gain/loss in AGI: +$4,395 (reported on 1.7% of returns)
Here:
+$4,395
State:
+$15,358
(% of AGI for various income ranges: 2.8% for AGIs $100k-200k)
Profit/loss from business: +$6,992 (reported on 17.7% of returns)
Here:
+$6,992
State:
+$19,577
(% of AGI for various income ranges: 15.9% for AGIs below $25k, 0.3% for AGIs $25k-50k, 0.3% for AGIs $50k-75k, 0.6% for AGIs $75k-100k)
Taxable individual retirement arrangement distribution: $11,339 (reported on 1.5% of returns)
07103:
$11,339
New Jersey:
$18,214
(% of AGI for various income ranges: 0.4% for AGIs below $25k, 0.3% for AGIs $25k-50k, 0.6% for AGIs $50k-75k, 1.3% for AGIs $75k-100k, 0.9% for AGIs $100k-200k)
Total itemized deductions: $18,247 (31% of AGI, reported on 18.7% of returns)
Here:
$18,247
State:
$30,827
Here:
30.9% of AGI
State:
21.2% of AGI
(% of AGI for various income ranges: 3.5% for AGIs below $25k, 10.4% for AGIs $25k-50k, 15.9% for AGIs $50k-75k, 18.5% for AGIs $75k-100k, 21.1% for AGIs $100k-200k)
Charity contributions: $3,871 (reported on 14.4% of returns)
Here:
$3,871
State:
$3,451
(% of AGI for various income ranges: 0.5% for AGIs below $25k, 1.6% for AGIs $25k-50k, 2.8% for AGIs $50k-75k, 3.2% for AGIs $75k-100k, 3.4% for AGIs $100k-200k)
Taxes paid: $5,236 (reported on 18.5% of returns)
07103:
$5,236
State:
$15,801
(% of AGI for various income ranges: 0.8% for AGIs below $25k, 2.2% for AGIs $25k-50k, 4.5% for AGIs $50k-75k, 6.4% for AGIs $75k-100k, 7.8% for AGIs $100k-200k)
Earned income credit: $2,695 (reported on 45.5% of returns)
Here:
$2,695
State:
$2,182
(% of AGI for various income ranges: 14.3% for AGIs below $25k, 1.8% for AGIs $25k-50k)
Percentage of individuals using paid preparers for their 2012 taxes: 66.9%
Here:
67%
State:
65%
(% for various income ranges: 65.5% for AGIs below $25k, 68.9% for AGIs $25k-50k, 68.7% for AGIs $50k-75k, 68.9% for AGIs $75k-100k, 64.0% for AGIs $100k-200k)
Averages for the 2004 tax year for zip code 07103, filed in 2005:
Average Adjusted Gross Income (AGI) in 2004: $26,110 (Individual Income Tax Returns)
Here:
$26,110
State:
$64,921
Salary/wage: $26,357 (reported on 91.7% of returns)
Here:
$26,357
State:
$57,755
(% of AGI for various income ranges: 89.9% for AGIs below $10k, 87.4% for AGIs $10k-25k, 96.0% for AGIs $25k-50k, 94.5% for AGIs $50k-75k, 94.9% for AGIs $75k-100k, 84.4% for AGIs over 100k)
Taxable interest for individuals: $404 (reported on 13.8% of returns)
This zip code:
$404
New Jersey:
$2,068
(% of AGI for various income ranges: 0.5% for AGIs below $10k, 0.2% for AGIs $10k-25k, 0.2% for AGIs $25k-50k, 0.2% for AGIs $50k-75k, 0.2% for AGIs $75k-100k, 0.2% for AGIs over 100k)
Taxable dividends: $395 (reported on 4.5% of returns)
Here:
$395
State:
$3,959
(% of AGI for various income ranges: 0.1% for AGIs below $10k, 0.1% for AGIs $10k-25k, 0.0% for AGIs $25k-50k, 0.1% for AGIs $50k-75k, 0.0% for AGIs $75k-100k, 0.2% for AGIs over 100k)
Net capital gain/loss: +$2,891 (reported on 2.5% of returns)
Here:
+$2,891
State:
+$13,591
(% of AGI for various income ranges: -0.2% for AGIs below $10k, 0.0% for AGIs $10k-25k, -0.0% for AGIs $25k-50k, 0.5% for AGIs $50k-75k, 0.4% for AGIs $75k-100k, 2.2% for AGIs over 100k)
Profit/loss from business: +$3,397 (reported on 9.1% of returns)
Here:
+$3,397
State:
+$17,520
(% of AGI for various income ranges: 4.9% for AGIs below $10k, 4.2% for AGIs $10k-25k, 0.2% for AGIs $25k-50k, -0.1% for AGIs $50k-75k, -0.2% for AGIs $75k-100k, -0.2% for AGIs over 100k)
IRA payment deduction: $1,750 (reported on 0.7% of returns)
07103:
$1,750
New Jersey:
$3,270
Total itemized deductions: $15,825 (31% of AGI, reported on 20.7% of returns)
Here:
$15,825
State:
$23,924
Here:
31.0% of AGI
State:
21.1% of AGI
(% of AGI for various income ranges: 4.2% for AGIs below $10k, 4.9% for AGIs $10k-25k, 12.4% for AGIs $25k-50k, 19.4% for AGIs $50k-75k, 19.6% for AGIs $75k-100k, 18.6% for AGIs over 100k)
Charity contributions deductions: $3,635 (7% of AGI, reported on 18.2% of returns)
Here:
$3,635
State:
$3,242
Here:
6.9% of AGI
State:
2.7% of AGI
(% of AGI for various income ranges: 0.3% for AGIs below $10k, 0.8% for AGIs $10k-25k, 2.5% for AGIs $25k-50k, 4.0% for AGIs $50k-75k, 4.2% for AGIs $75k-100k, 4.1% for AGIs over 100k)
Total tax: $3,059 (reported on 51.0% of returns)
07103:
$3,059
State:
$12,321
(% of AGI for various income ranges: 2.5% for AGIs below $10k, 2.2% for AGIs $10k-25k, 4.3% for AGIs $25k-50k, 8.7% for AGIs $50k-75k, 11.3% for AGIs $75k-100k, 16.7% for AGIs over 100k)
Earned income credit: $2,076 (reported on 45.1% of returns)
Here:
$2,076
State:
$1,711
Percentage of individuals using paid preparers for their 2004 taxes: 72.2%
Here:
72%
State:
65%
(% for various income ranges: 68.4% for AGIs below $10k, 75.3% for AGIs $10k-25k, 71.7% for AGIs $25k-50k, 72.7% for AGIs $50k-75k, 65.3% for AGIs $75k-100k, 73.9% for AGIs over 100k)
Likely homosexual households (counted as self-reported same-sex unmarried-partner households)
Lesbian couples: 0.1% of all households
Gay men: 0.0% of all households
Household received Food Stamps/SNAP in the past 12 months: 4,499 Household did not receive Food Stamps/SNAP in the past 12 months: 8,994
Women who had a birth in the past 12 months: 519 (214 now married, 293 unmarried) Women who did not have a birth in the past 12 months: 9,436 (2,102 now married, 7,372 unmarried)
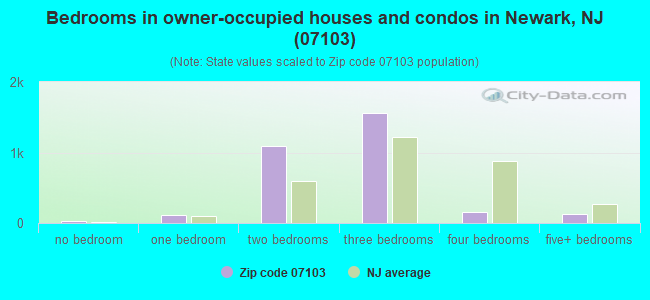
Housing units in zip code 07103 with a mortgage: 2,187 (131 second mortgage, 5 home equity loan, 95 both second mortgage and home equity loan) Houses without a mortgage: 9
Median monthly owner costs for units with a mortgage: $1,936 Median monthly owner costs for units without a mortgage: $821
Residents with income below the poverty level in 2022:
This zip code:
29.2%
Whole state:
9.7%
Residents with income below 50% of the poverty level in 2022:
This zip code:
13.7%
Whole state:
5.2%
Median number of rooms in houses and condos:
Here:
5.2
State:
6.8
Median number of rooms in apartments:
Here:
4.2
State:
3.9
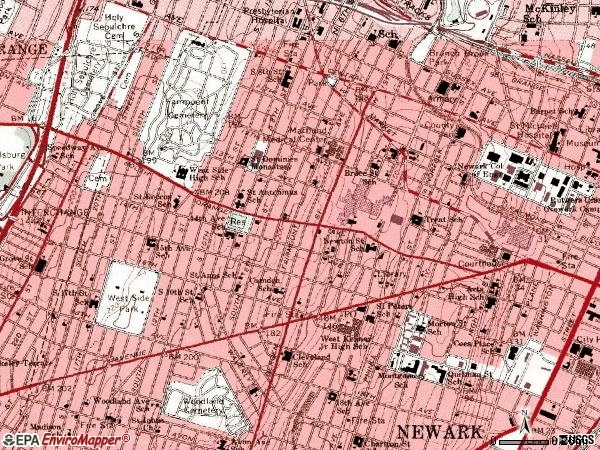
Notable locations in this zip code not listed on our city pages
Notable locations in zip code 07103: Tiernan Hall (A), Oak Hall (B), Microelectronics Center (C), Laurel Hall (D), Guttenberg Information Technologies Center (E), Faculty Memorial Hall (F), Enterprise Development Center Number 3 (G), Enterprise Development Center Number 2 (H), Electrical and Computer Engineering Building (I), Central Avenue Building (J), Springfield Branch Newark Public Library (K), Rapid Respond Ambulance (L), Inner City Transit Medical Transportation (M), Newark Fire Department Engine 7 (N), Newark Fire Department Engine 18 (O), Newark Fire Department Engine 11 (P), Newark Fire Department Rescue 1 (Q), Newark Fire Department Engine 6 (R). Display/hide their locations on the map
Churches in zip code 07103 include: Beth El Pentecostal House (A), Beulah Baptist Church (B), First Newborn Tabernacle Church (C), Grace Reform Church (D), Kingdom Hall of Jehovahs Witnesses (E), Macedonia Baptist Church (F), Mount Calvary Church of God (G), Mount Olivet Baptist Church (H), New Born Baptist Church (I). Display/hide their locations on the map
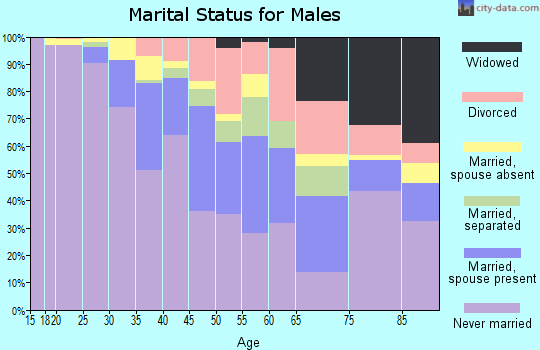
2,211 married couples with children.
5,288 single-parent households (1,087 men, 4,201 women).
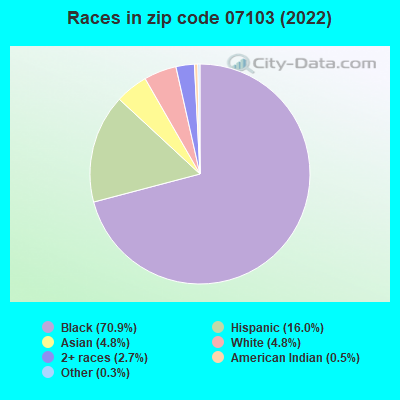
70.6% of residents of 07103 zip code speak English at home.
13.0% of residents speak Spanish at home (46% very well, 21% well, 23% not well, 10% not at all).
5.5% of residents speak other Indo-European language at home (70% very well, 19% well, 7% not well, 3% not at all).
1.5% of residents speak Asian or Pacific Island language at home (68% very well, 9% well, 23% not well).
9.1% of residents speak other language at home (85% very well, 12% well, 1% not well, 2% not at all).
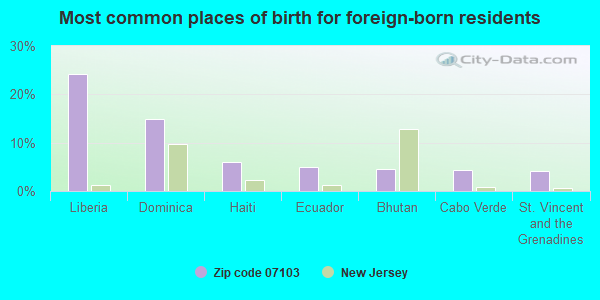
Foreign born population: 8,272 (23.4%) (49.0% of them are naturalized citizens)
Major facilities with environmental interests located in this zip code:
NEWARK CITY BD OF ED VAILSBURG HIGH SCHOOL (107 IVY ST in NEWARK, NJ)
(Integrated Compliance Information System) - ICIS-02-1986-0105, FORMAL ENFORCEMENT ACTION ENFORCEMENT/COMPLIANCE ACTIVITY (Integrated Compliance Information System) COMPLIANCE ACTIVITY (Tracking inspections of insecticide, fungicide, and rodenticide, and toxic substances) (National Center for Education Statistics) - STATE ID-718 STATE MASTER (New Jersey environmental info) - NJEMS-014257, STATE CLEANUP SITE Small Quantity Generators, between 100 kg and 1000 kg of hazardous waste/month (Resource Conservation and Recovery Act (tracking hazardous waste)) - notification Business SIC classification: ELEMENTARY AND SECONDARY SCHOOLS Organizations: NEWARK BOARD OF EDUCATION (CONTACT/OWNER)
Alternative names: NEWARK BOARD OF EDUCATION, VAILSBURG MIDDLE SCHOOL
NEWARK CITY BD OF ED WEST SIDE HIGH SCHOOL (403 S ORANGE AVE in NEWARK, NJ)
ENFORCEMENT/COMPLIANCE ACTIVITY (Integrated Compliance Information System) (National Center for Education Statistics) - STATE ID-080 STATE MASTER (New Jersey environmental info) - NJEMS-014261, STATE CLEANUP SITE (Resource Conservation and Recovery Act (tracking hazardous waste)) Business SIC classification: ELEMENTARY AND SECONDARY SCHOOLS
NEWARK CITY BD OF ED NEWTON SCHOOL (150 NEWTON ST in NEWARK, NJ)
(National Center for Education Statistics) - STATE ID-580 STATE MASTER (New Jersey environmental info) - NJEMS-014242, STATE CLEANUP SITE, NJEMS-05985, AIR PROGRAM (Resource Conservation and Recovery Act (tracking hazardous waste)) Business SIC classification: ELEMENTARY AND SECONDARY SCHOOLS Alternative names: NEWARK PUBLIC SCHOOLS NEWTON STREET SCH, NEWTON STREET ELEMENTARY SCHL
NEWARK CITY BD OF ED QUITMAN STREET SCHOOL (21 QUITMAN ST in NEWARK, NJ)
ENFORCEMENT/COMPLIANCE ACTIVITY (Integrated Compliance Information System) (National Center for Education Statistics) - STATE ID-605 STATE MASTER (New Jersey environmental info) - NJEMS-014245, STATE CLEANUP SITE (Resource Conservation and Recovery Act (tracking hazardous waste)) Alternative names: NEWARK PUBLIC SCHOOLS QUITMAN STREET SCH, QUITMAN SCHOOL
NEWARK CITY BD OF ED 13TH AVENUE SCHOOL (359 13TH AVE in NEWARK, NJ)
ENFORCEMENT/COMPLIANCE ACTIVITY (Integrated Compliance Information System) COMPLIANCE ACTIVITY (Tracking inspections of insecticide, fungicide, and rodenticide, and toxic substances) (National Center for Education Statistics) - STATE ID-715 STATE MASTER (New Jersey environmental info) - NJEMS-014255, STATE CLEANUP SITE Small Quantity Generators, between 100 kg and 1000 kg of hazardous waste/month (Resource Conservation and Recovery Act (tracking hazardous waste)) - notification Organizations: NEWARK PUBLIC SCHOOLS (CONTACT/OWNER)
Alternative names: NEWARK PUBLIC SCHOOLS THIRTEENTH AVE SCH, THIRTEENTH AVENUE ELEMENTARY, THIRTEENTH AVE ELEMENTARY SCHOOL
NEWARK CITY BD OF ED 15TH AVENUE SCHOOL (557 15TH AVE in NEWARK, NJ)
(National Center for Education Statistics) - STATE ID-400 STATE MASTER (New Jersey environmental info) - NJEMS-014221, STATE CLEANUP SITE, NJEMS-06543, AIR PROGRAM Small Quantity Generators, between 100 kg and 1000 kg of hazardous waste/month (Resource Conservation and Recovery Act (tracking hazardous waste)) - notification Organizations: NEWARK PUBLIC SCHOOLS (CONTACT/OWNER)
Alternative names: FIFTEENTH AVENUE ELEM SCHOOL, NEWARK PUBLIC SCHOOLS FIFTEENTH AVE SCH
NEWARK CITY BD OF ED CAMDEN STREET ELEMENTARY SCHOOL (281 CAMDEN ST in NEWARK, NJ)
(National Center for Education Statistics) - STATE ID-310 STATE MASTER (New Jersey environmental info) - NJEMS-014209, STATE CLEANUP SITE, NJEMS-05083, AIR PROGRAM (Resource Conservation and Recovery Act (tracking hazardous waste)) Business SIC classification: ELEMENTARY AND SECONDARY SCHOOLS Alternative names: NEWARK PUBLIC SSHOOLS CAMDEN STREET SCH
NEWARK CITY BD OF ED HARRITE TUBMAN SCHOOL (504 S 10TH ST in NEWARK, NJ)
(National Center for Education Statistics) - STATE ID-455 STATE MASTER (New Jersey environmental info) - NJEMS-014227, STATE CLEANUP SITE (Resource Conservation and Recovery Act (tracking hazardous waste)) Alternative names: NEWARK PUBLIC SCHOOLS HARRIET TUBMAN SCH
NEWARK CITY BD OF ED JFK SCHOOL (311 S 10TH ST in NEWARK, NJ)
(National Center for Education Statistics) - STATE ID-477 STATE MASTER (New Jersey environmental info) - NJEMS-014228, STATE CLEANUP SITE, NJEMS-06183, AIR PROGRAM Small Quantity Generators, between 100 kg and 1000 kg of hazardous waste/month (Resource Conservation and Recovery Act (tracking hazardous waste)) - notification Business SIC classification: ELEMENTARY AND SECONDARY SCHOOLS Organizations: NEWARK PUBLIC SCHOOLS (CONTACT/OWNER)
Alternative names: NEWARK PUBLIC SCHOOLS JOHN F KENNEDY SCH
NEWARK CITY BD OF ED MORTON STREET SCHOOL (75 MORTON ST- MORTON ST SCHOOL in NEWARK, NJ)
(National Center for Education Statistics) - STATE ID-560 STATE MASTER (New Jersey environmental info) - NJEMS-014240, STATE CLEANUP SITE, NJEMS-NJ0000860841, HAZARDOUS WASTE PROGRAM Small Quantity Generators, between 100 kg and 1000 kg of hazardous waste/month (Resource Conservation and Recovery Act (tracking hazardous waste)) - notification Organizations: NEWARK CITY BD OF ED MORTON STREET ELEM SCH, NEWARK BOARD OF EDUCATION (CONTACT/OWNER)
Alternative names: NEWARK BOARD OF EDUCATION
NEWARK CITY BD OF ED SOUTH 17TH STREET SCHOOL (619 S SEVENTEENTH ST in NEWARK, NJ)
(National Center for Education Statistics) - STATE ID-670 STATE MASTER (New Jersey environmental info) - NJEMS-014251, STATE CLEANUP SITE (Resource Conservation and Recovery Act (tracking hazardous waste)) Alternative names: NEWARK PUBLIC SCHOOLS SOUTH SEVENTEENTH, SOUTH SEVENTEENTH ST
NEWARK CITY BD OF ED WARREN STREET SCHOOL (200 WARREN ST in NEWARK, NJ)
(National Center for Education Statistics) - STATE ID-720 STATE MASTER (New Jersey environmental info) - NJEMS-014258, STATE CLEANUP SITE (Resource Conservation and Recovery Act (tracking hazardous waste)) Alternative names: NEWARK PUBLIC SCHOOLS WARREN STREET SCH
NJ UNIV OF MEDICINE & DENTISTRY NEWARK CAMPUS (65 BERGEN STREET in NEWARK, NJ)
STATE MASTER (New Jersey environmental info) - NJEMS-133325, TRANSPORTER, NJEMS-221899, National Pollutant Discharge Elimination System Permit, NJEMS-233844, REFUSE DISPOSAL, NJEMS-RMW22, National Pollutant Discharge Elimination System NON-MAJOR (Tracking pollutant discharge elimination systems) - permit HAZARDOUS WASTE BIENNIAL REPORTER (Resource Conservation and Recovery Act (tracking hazardous waste)) Large Quantity Generators, more that 1000 kg of hazardous waste/month (Resource Conservation and Recovery Act (tracking hazardous waste)) - notification Organizations: UNIVERSITY OF MEDICINE & DENTISTRY OF NJ, UMDNJ (CONTACT/OPERATOR)
, UNIVERSITY OF MEDICINE & DENTI (CONTACT/OPERATOR)
, UNIVERSITY OF MEDICINE & DENTISTRY OF NJ (CONTACT/OWNER)
Alternative names: COLLEGE OF MEDICINE & DENTISTRY, COLLEGE OF MEDICINE & DENTISTRY NJ, NJ UNIV OF MED & DENT NEWARK CAMPUS, UNIVERSITY OF MEDICINE & DENT, UNIVERSITY OF MEDICINE & DENTI, UNIVERSITY OF MEDICINE AND DENTISTRY OF NEW JERSEY - UMDNJ
Housing units lacking complete plumbing facilities: 1.8% Housing units lacking complete kitchen facilities: 1.6%
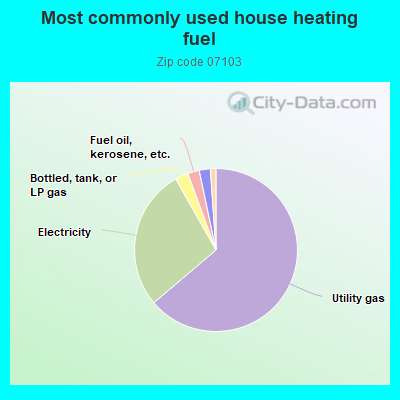
63.8%Utility gas
28.0%Electricity
2.6%Bottled, tank, or LP gas
2.3%Fuel oil, kerosene, etc.
2.2%No fuel used
0.6%Other fuel
0.5%Solar energy
Population in 1990: 36,949.
Place of birth for U.S.-born residents:
This state: 20,356
Northeast: 2,970
Midwest: 181
South: 2,094
West: 105
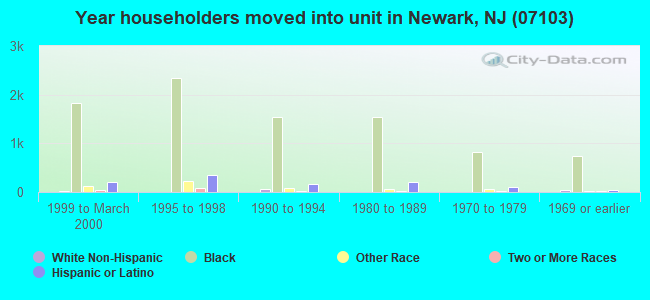
57% of the 07103 zip code residents lived in the same house 5 years ago. Out of people who lived in different houses, 78% lived in this county. Out of people who lived in different counties, 50% lived in New Jersey.
87% of the 07103 zip code residents lived in the same house 1 year ago. Out of people who lived in different houses, 60% moved from this county. Out of people who lived in different houses, 18% moved from different county within same state. Out of people who lived in different houses, 11% moved from different state. Out of people who lived in different houses, 7% moved from abroad.
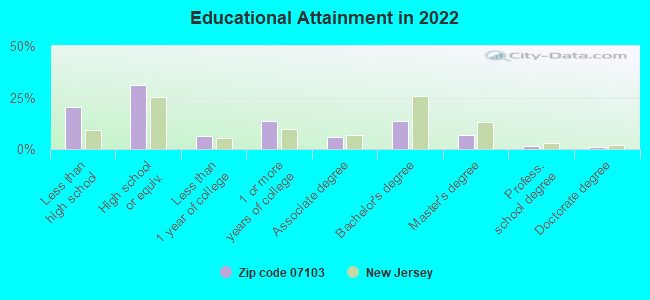
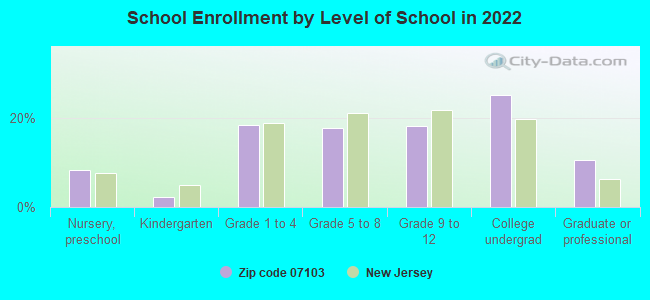
Private vs. public school enrollment:
Students in private schools in grades 1 to 8 (elementary and middle school): 317
Here:
7.6%
New Jersey:
12.3%
Students in private schools in grades 9 to 12 (high school): 108
Here:
5.1%
New Jersey:
13.1%
Students in private undergraduate colleges: 1,058
Here:
36.2%
New Jersey:
33.2%
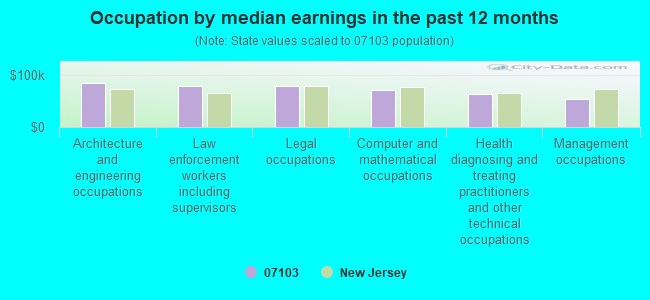
Occupation by median earnings in the past 12 months ($)
84,003Architecture and engineering occupations
79,000Law enforcement workers including supervisors
78,527Legal occupations
71,392Computer and mathematical occupations
63,642Health diagnosing and treating practitioners and other technical occupations
53,723Management occupations
Companies with federal contracts located in this zip code:
REVA INC (211 WARREN ST in NEWARK, NJ; small business) : $5,232,995 in 35 contractsfrom 2002 to 2006
Contracts for Construction of Structures and Facilities -- Other Non-Building Facilities, Maintenance, Repair or Alteration of Real Property -- Hospitals and Infirmaries, Maintenance, Repair or Alteration of Real Property -- Office Buildings, Maintenance, Repair or Alteration of Real Property -- Miscellaneous Buildings, and moreby Army, Department of Veterans Affairs, Navy, Federal Emergency Management Agency, and others Signed by year:2000: $0; 2001: $0; 2002: $60,246; 2003: $1,334,764; 2004: $1,798,038; 2005: $1,488,615; 2006: $551,332.
Biggest contracts:
$1,083,889 with Army for Construction of Structures and Facilities -- Other Non-Building Facilities. Signed on 2003-09-29. Completion date: 2004-03-29.
$779,848 with Department of Veterans Affairs for Maintenance, Repair or Alteration of Real Property -- Hospitals and Infirmaries. Signed on 2004-09-24. Completion date: 2004-09-30.
$440,000 with Army for Maintenance, Repair or Alteration of Real Property -- Office Buildings. Signed on 2005-09-26. Completion date: 2006-02-17.
$402,190, same as above.Signed on 2004-09-30. Completion date: 2005-04-15.
NOBLE DEVICE TECHNOLOGIES CORP (211 WARREN ST in NEWARK, NY; small business)
$89,240 with Air Force for Other Defense -- Applied Research and Exploratory Development (R&D). Signed on 2004-05-13. Completion date: 2005-05-12.
NATIONAL FUEL OIL INC (175 ORANGE ST in NEWARK, NJ; small business) : $31,924 in 2 contractsfrom 2001 to 2002
$159,504 with Defense Logistics Agency for Fuel Oils. Signed on 2002-08-01. Completion date: 2005-07-31.
-$127,580, same as above.Signed on 2001-11-26. Completion date: 2002-07-31.
Top industries in this zip code by the number of employees in 2005:
Health Care and Social Assistance: General Medical and Surgical Hospitals (over 1000 employees: 1 establishment)
Health Care and Social Assistance: Nursing Care Facilities (250-499: 2)
Health Care and Social Assistance: Other Community Housing Services (250-499: 1, 1-4: 2)
Health Care and Social Assistance: Child Day Care Services (50-99: 1, 20-49: 4, 10-19: 7, 5-9: 3, 1-4: 7)
Other Services (except Public Administration): Religious Organizations (50-99: 1, 20-49: 2, 10-19: 3, 5-9: 4, 1-4: 17)
Professional, Scientific, and Technical Services: Research and Development in the Physical, Engineering, and Life Sciences (100-249: 1, 20-49: 1, 5-9: 1, 1-4: 1)
Health Care and Social Assistance: Child and Youth Services (50-99: 2, 20-49: 1)
Health Care and Social Assistance: Other Individual and Family Services (50-99: 2, 10-19: 2)
People in group quarters in 2010:
1,067 people in college/university student housing
511 people in nursing facilities/skilled-nursing facilities
509 people in other noninstitutional facilities
377 people in emergency and transitional shelters (with sleeping facilities) for people experiencing homelessness
247 people in residential treatment centers for adults
96 people in correctional facilities intended for juveniles
33 people in residential treatment centers for juveniles (non-correctional)
4 people in hospitals with patients who have no usual home elsewhere
People in group quarters in 2000:
1,506 people in college dormitories (includes college quarters off campus)
586 people in nursing homes
314 people in other noninstitutional group quarters
294 people in mental (psychiatric) hospitals or wards
267 people in training schools for juvenile delinquents
23 people in religious group quarters
19 people in homes or halfway houses for drug/alcohol abuse
Fatal accident statistics in 2013:
Fatal accident count: 2
Vehicles involved in fatal accidents: 3
Fatal accidents caused by drunken drivers: 0
Fatalities: 2
Persons involved in fatal accidents: 3
Pedestrians involved in fatal accidents: 1
Fatal accident statistics in 2012:
Fatal accident count: 6
Vehicles involved in fatal accidents: 12
Fatal accidents caused by drunken drivers: 0
Fatalities: 6
Persons involved in fatal accidents: 23
Pedestrians involved in fatal accidents: 2
Home Mortgage Disclosure Act Aggregated Statistics For Year 2009 (Based on 18 full and 18 partial tracts)
A) FHA, FSA/RHS & VA Home Purchase Loans
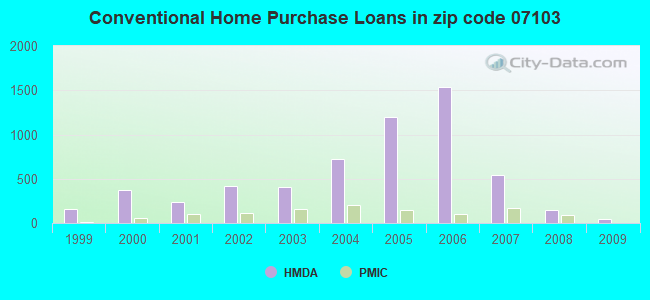
B) Conventional Home Purchase Loans
C) Refinancings
D) Home Improvement Loans
E) Loans on Dwellings For 5+ Families
F) Non-occupant Loans on < 5 Family Dwellings (A B C & D)
G) Loans On Manufactured Home Dwelling (A B C & D)
Number
Average Value
Number
Average Value
Number
Average Value
Number
Average Value
Number
Average Value
Number
Average Value
Number
Average Value
LOANS ORIGINATED
117
$246,626
45
$225,809
190
$229,837
8
$98,794
9
$563,104
32
$212,744
0
$0
APPLICATIONS APPROVED, NOT ACCEPTED
20
$215,742
9
$233,420
26
$218,266
2
$152,375
1
$561,960
6
$118,488
0
$0
APPLICATIONS DENIED
90
$276,111
60
$242,703
248
$206,878
35
$51,071
0
$0
66
$192,949
0
$0
APPLICATIONS WITHDRAWN
45
$233,209
14
$203,924
118
$212,498
13
$116,372
4
$1,750,522
20
$180,996
1
$187,320
FILES CLOSED FOR INCOMPLETENESS
47
$289,702
8
$188,375
58
$236,539
5
$179,168
0
$0
19
$180,593
0
$0
Aggregated Statistics For Year 2008 (Based on 18 full and 18 partial tracts)
A) FHA, FSA/RHS & VA Home Purchase Loans
B) Conventional Home Purchase Loans
C) Refinancings
D) Home Improvement Loans
E) Loans on Dwellings For 5+ Families
F) Non-occupant Loans on < 5 Family Dwellings (A B C & D)
Number
Average Value
Number
Average Value
Number
Average Value
Number
Average Value
Number
Average Value
Number
Average Value
LOANS ORIGINATED
134
$293,019
143
$269,589
243
$216,086
40
$92,788
14
$355,444
65
$196,179
APPLICATIONS APPROVED, NOT ACCEPTED
17
$265,772
46
$265,439
81
$192,405
14
$137,726
0
$0
34
$187,744
APPLICATIONS DENIED
64
$302,725
133
$295,498
451
$225,675
100
$69,833
1
$582,280
137
$222,637
APPLICATIONS WITHDRAWN
54
$280,807
57
$312,688
123
$232,249
12
$49,431
0
$0
25
$255,200
FILES CLOSED FOR INCOMPLETENESS
17
$338,782
37
$284,662
47
$236,277
0
$0
1
$3,122,930
10
$235,603
Aggregated Statistics For Year 2007 (Based on 18 full and 18 partial tracts)
A) FHA, FSA/RHS & VA Home Purchase Loans
B) Conventional Home Purchase Loans
C) Refinancings
D) Home Improvement Loans
E) Loans on Dwellings For 5+ Families
F) Non-occupant Loans on < 5 Family Dwellings (A B C & D)
G) Loans On Manufactured Home Dwelling (A B C & D)
Number
Average Value
Number
Average Value
Number
Average Value
Number
Average Value
Number
Average Value
Number
Average Value
Number
Average Value
LOANS ORIGINATED
49
$322,969
537
$253,204
628
$221,662
71
$106,129
16
$409,074
239
$235,974
0
$0
APPLICATIONS APPROVED, NOT ACCEPTED
5
$274,702
196
$251,394
202
$214,023
25
$90,090
1
$580,210
71
$227,919
0
$0
APPLICATIONS DENIED
25
$322,788
683
$274,514
832
$219,699
183
$78,986
11
$2,900,021
298
$255,733
4
$215,322
APPLICATIONS WITHDRAWN
27
$324,960
176
$270,547
323
$222,226
28
$98,786
5
$477,468
87
$256,041
0
$0
FILES CLOSED FOR INCOMPLETENESS
2
$273,090
74
$273,348
76
$235,604
6
$230,168
0
$0
17
$260,990
0
$0
Aggregated Statistics For Year 2006 (Based on 18 full and 18 partial tracts)
A) FHA, FSA/RHS & VA Home Purchase Loans
B) Conventional Home Purchase Loans
C) Refinancings
D) Home Improvement Loans
E) Loans on Dwellings For 5+ Families
F) Non-occupant Loans on < 5 Family Dwellings (A B C & D)
G) Loans On Manufactured Home Dwelling (A B C & D)
Number
Average Value
Number
Average Value
Number
Average Value
Number
Average Value
Number
Average Value
Number
Average Value
Number
Average Value
LOANS ORIGINATED
32
$314,365
1,542
$205,627
1,019
$200,549
117
$102,354
27
$348,158
484
$204,585
0
$0
APPLICATIONS APPROVED, NOT ACCEPTED
5
$296,496
309
$220,889
258
$180,714
27
$118,474
5
$426,000
107
$218,482
0
$0
APPLICATIONS DENIED
9
$244,879
958
$216,394
867
$210,862
184
$80,360
6
$392,195
338
$211,730
6
$50,355
APPLICATIONS WITHDRAWN
20
$250,911
475
$200,520
459
$193,472
25
$77,206
6
$337,570
148
$215,178
1
$215,420
FILES CLOSED FOR INCOMPLETENESS
0
$0
88
$209,521
152
$202,159
5
$215,894
1
$274,420
26
$217,582
0
$0
Aggregated Statistics For Year 2005 (Based on 18 full and 18 partial tracts)
A) FHA, FSA/RHS & VA Home Purchase Loans
B) Conventional Home Purchase Loans
C) Refinancings
D) Home Improvement Loans
E) Loans on Dwellings For 5+ Families
F) Non-occupant Loans on < 5 Family Dwellings (A B C & D)
G) Loans On Manufactured Home Dwelling (A B C & D)
Number
Average Value
Number
Average Value
Number
Average Value
Number
Average Value
Number
Average Value
Number
Average Value
Number
Average Value
LOANS ORIGINATED
67
$276,604
1,200
$189,721
918
$170,659
91
$124,343
20
$555,448
528
$189,059
0
$0
APPLICATIONS APPROVED, NOT ACCEPTED
13
$249,435
264
$183,717
215
$167,794
43
$159,488
7
$234,231
89
$183,194
0
$0
APPLICATIONS DENIED
20
$257,658
608
$187,259
769
$163,421
200
$61,905
13
$400,234
251
$186,142
3
$36,660
APPLICATIONS WITHDRAWN
18
$218,847
564
$189,969
531
$162,488
46
$150,867
6
$167,370
226
$183,463
2
$289,320
FILES CLOSED FOR INCOMPLETENESS
2
$340,695
85
$212,413
120
$184,701
7
$121,357
2
$128,985
16
$186,341
3
$294,307
Aggregated Statistics For Year 2004 (Based on 18 full and 18 partial tracts)
A) FHA, FSA/RHS & VA Home Purchase Loans
B) Conventional Home Purchase Loans
C) Refinancings
D) Home Improvement Loans
E) Loans on Dwellings For 5+ Families
F) Non-occupant Loans on < 5 Family Dwellings (A B C & D)
G) Loans On Manufactured Home Dwelling (A B C & D)
Number
Average Value
Number
Average Value
Number
Average Value
Number
Average Value
Number
Average Value
Number
Average Value
Number
Average Value
LOANS ORIGINATED
138
$211,367
725
$170,939
645
$139,514
95
$77,129
16
$2,683,698
347
$158,848
4
$93,762
APPLICATIONS APPROVED, NOT ACCEPTED
31
$249,171
211
$189,288
192
$140,263
22
$101,146
2
$198,220
107
$172,484
0
$0
APPLICATIONS DENIED
37
$227,653
283
$178,208
722
$131,606
178
$51,533
8
$1,075,084
209
$160,137
1
$40,000
APPLICATIONS WITHDRAWN
50
$231,011
170
$176,963
420
$133,385
42
$96,675
3
$283,323
116
$161,351
0
$0
FILES CLOSED FOR INCOMPLETENESS
1
$334,160
36
$151,890
40
$132,578
6
$93,665
2
$314,170
8
$232,555
0
$0
Aggregated Statistics For Year 2003 (Based on 18 full and 18 partial tracts)
A) FHA, FSA/RHS & VA Home Purchase Loans
B) Conventional Home Purchase Loans
C) Refinancings
D) Home Improvement Loans
E) Loans on Dwellings For 5+ Families
F) Non-occupant Loans on < 5 Family Dwellings (A B C & D)
Number
Average Value
Number
Average Value
Number
Average Value
Number
Average Value
Number
Average Value
Number
Average Value
LOANS ORIGINATED
139
$162,001
412
$138,075
786
$116,676
33
$39,045
11
$508,773
260
$129,494
APPLICATIONS APPROVED, NOT ACCEPTED
19
$172,183
121
$154,044
240
$115,465
24
$31,341
0
$0
79
$130,565
APPLICATIONS DENIED
40
$171,731
207
$136,659
668
$119,012
116
$32,550
7
$291,036
162
$132,247
APPLICATIONS WITHDRAWN
38
$170,507
144
$145,073
367
$125,462
30
$56,056
0
$0
105
$133,922
FILES CLOSED FOR INCOMPLETENESS
5
$159,962
26
$168,515
48
$108,702
2
$17,920
0
$0
8
$140,781
Aggregated Statistics For Year 2002 (Based on 18 full and 16 partial tracts)
A) FHA, FSA/RHS & VA Home Purchase Loans
B) Conventional Home Purchase Loans
C) Refinancings
D) Home Improvement Loans
E) Loans on Dwellings For 5+ Families
F) Non-occupant Loans on < 5 Family Dwellings (A B C & D)
Number
Average Value
Number
Average Value
Number
Average Value
Number
Average Value
Number
Average Value
Number
Average Value
LOANS ORIGINATED
119
$144,249
415
$118,998
416
$101,115
80
$25,620
12
$1,508,457
167
$109,434
APPLICATIONS APPROVED, NOT ACCEPTED
23
$135,727
108
$116,536
168
$88,804
45
$25,752
0
$0
54
$95,354
APPLICATIONS DENIED
37
$125,272
183
$113,947
475
$89,808
124
$32,812
1
$104,900
124
$104,386
APPLICATIONS WITHDRAWN
40
$142,134
82
$124,978
279
$99,227
29
$49,226
0
$0
41
$96,287
FILES CLOSED FOR INCOMPLETENESS
5
$141,594
19
$113,906
46
$92,474
0
$0
0
$0
8
$103,935
Aggregated Statistics For Year 2001 (Based on 18 full and 16 partial tracts)
A) FHA, FSA/RHS & VA Home Purchase Loans
B) Conventional Home Purchase Loans
C) Refinancings
D) Home Improvement Loans
E) Loans on Dwellings For 5+ Families
F) Non-occupant Loans on < 5 Family Dwellings (A B C & D)
Number
Average Value
Number
Average Value
Number
Average Value
Number
Average Value
Number
Average Value
Number
Average Value
LOANS ORIGINATED
109
$120,284
236
$102,623
298
$84,924
47
$25,573
5
$87,244
76
$90,868
APPLICATIONS APPROVED, NOT ACCEPTED
16
$126,470
68
$99,596
146
$80,716
14
$25,319
5
$107,968
35
$81,330
APPLICATIONS DENIED
33
$103,921
156
$95,453
545
$72,004
128
$18,799
1
$6,054,400
82
$78,067
APPLICATIONS WITHDRAWN
30
$111,934
65
$98,223
234
$86,714
37
$30,476
3
$204,257
23
$104,295
FILES CLOSED FOR INCOMPLETENESS
3
$124,947
18
$78,166
64
$87,031
1
$27,180
1
$475,000
6
$77,710
Aggregated Statistics For Year 2000 (Based on 18 full and 16 partial tracts)
A) FHA, FSA/RHS & VA Home Purchase Loans
B) Conventional Home Purchase Loans
C) Refinancings
D) Home Improvement Loans
E) Loans on Dwellings For 5+ Families
F) Non-occupant Loans on < 5 Family Dwellings (A B C & D)
Number
Average Value
Number
Average Value
Number
Average Value
Number
Average Value
Number
Average Value
Number
Average Value
LOANS ORIGINATED
77
$108,333
370
$86,155
137
$67,043
51
$21,219
3
$639,093
94
$67,356
APPLICATIONS APPROVED, NOT ACCEPTED
24
$102,065
40
$74,437
55
$76,738
39
$29,886
0
$0
15
$90,253
APPLICATIONS DENIED
25
$99,617
116
$90,284
359
$60,782
124
$21,459
4
$82,095
66
$70,482
APPLICATIONS WITHDRAWN
14
$119,328
61
$88,780
203
$80,912
16
$22,801
5
$52,776
34
$73,160
FILES CLOSED FOR INCOMPLETENESS
4
$96,262
19
$110,508
72
$88,316
1
$86,000
0
$0
9
$63,647
Aggregated Statistics For Year 1999 (Based on 12 full and 12 partial tracts)
A) FHA, FSA/RHS & VA Home Purchase Loans
B) Conventional Home Purchase Loans
C) Refinancings
D) Home Improvement Loans
E) Loans on Dwellings For 5+ Families
F) Non-occupant Loans on < 5 Family Dwellings (A B C & D)
2002 - 2018 National Fire Incident Reporting System (NFIRS) incidents
Based on the data from the years 2002 - 2018 the average number of fire incidents per year is 84. The highest number of reported fires - 245 took place in 2017, and the least - 0 in 2004. The data has a growing trend.
When looking into fire subcategories, the most incidents belonged to: Structure Fires (57.8%), and Outside Fires (26.2%).
Fire incident types reported to NFIRS in Zip Code 07103


 Nearest zip codes: 07108, 07102, 07107, 07018, 07112, 07106.


 Based on the data from the years 2002 - 2018 the average number of fire incidents per year is 84. The highest number of reported fires - 245 took place in 2017, and the least - 0 in 2004. The data has a growing trend.
 When looking into fire subcategories, the most incidents belonged to: Structure Fires (57.8%), and Outside Fires (26.2%).