Estimated zip code population in 2022: 10,378 Zip code population in 2010: 10,179 Zip code population in 2000: 10,037
Houses and condos: 3,900 Renter-occupied apartments: 97
% of renters here:
3%
State:
34%
March 2022 cost of living index in zip code 06883: 137.3 (high, U.S. average is 100)
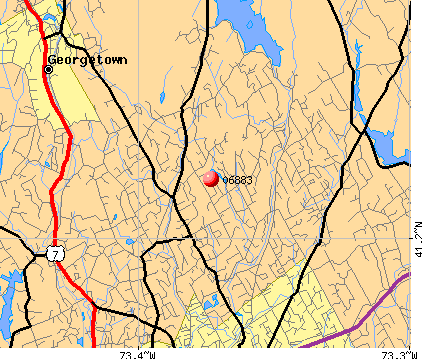
Land area: 19.8 sq. mi. Water area: 0.9 sq. mi.
Population density: 525 people per square mile
(low).
OSM Map
Google Map
MSN Map
OSM Map
General Map
Google Map
MSN Map
OSM Map
Google Map
MSN Map
OSM Map
Google Map
MSN Map
Please wait while loading the map...
Real estate property taxes paid for housing units in 2022:
This zip code:
1.0% ($9,545)
Connecticut:
1.8% ($6,189)
Median real estate property taxes paid for housing units with mortgages in 2022: $9,526 (0.9%) Median real estate property taxes paid for housing units with no mortgage in 2022: $9,598 (1.0%)
Business Search- 14 Million verified businesses
Males: 5,106
(49.2%)
Females: 5,272
(50.8%)
For population 25 years and over in 06883:
High school or higher: 99.1%
Bachelor's degree or higher: 79.8%
Graduate or professional degree: 45.4%
Unemployed: 3.1%
Mean travel time to work (commute): 41.9 minutes
For population 15 years and over in 06883:
Never married: 24.7%
Now married: 62.8%
Separated: 0.2%
Widowed: 2.6%
Divorced: 9.7%
Zip code 06883 compared to state average:
Median household income significantly above state average.
Median house value significantly above state average.
Black race population percentage below state average.
Hispanic race population percentage below state average.
Median age above state average.
Renting percentage significantly below state average.
Length of stay since moving in significantly above state average.
Number of rooms per house significantly above state average.
Percentage of population with a bachelor's degree or higher above state average.
Estimated median house/condo value in 2022: $995,157
06883:
$995,157
Connecticut:
$347,200
According to our research of Connecticut and other state lists, there was 1 registered sex offender living in 06883 zip code as of May 28, 2024. The ratio of all residents to sex offenders in zip code 06883 is 10,495 to 1. The ratio of registered sex offenders to all residents in this zip code is much lower than the state average.
Median resident age:
This zip code:
46.1 years
Connecticut median age:
40.9 years
Average household size:
This zip code:
2.9 people
Connecticut:
2.5 people
Averages for the 2020 tax year for zip code 06883, filed in 2021:
Average Adjusted Gross Income (AGI) in 2020: $319,823 (Individual Income Tax Returns)
Here:
$319,823
State:
$105,931
Salary/wage: $263,425 (reported on 74.6% of returns)
Here:
$263,425
State:
$83,540
(% of AGI for various income ranges: 1098.2% for AGIs below $25k, 3556.3% for AGIs $25k-50k, 7813.3% for AGIs $50k-75k, 9505.7% for AGIs $75k-100k, 20143.5% for AGIs $100k-200k, 158243.3% for AGIs over 200k)
Taxable interest for individuals: $5,911 (reported on 62.1% of returns)
This zip code:
$5,911
Connecticut:
$3,402
(% of AGI for various income ranges: 53.2% for AGIs below $25k, 177.9% for AGIs $25k-50k, 146.0% for AGIs $50k-75k, 322.1% for AGIs $75k-100k, 457.4% for AGIs $100k-200k, 2789.4% for AGIs over 200k)
Ordinary dividends: $23,106 (reported on 60.7% of returns)
Here:
$23,106
State:
$12,683
(% of AGI for various income ranges: 195.8% for AGIs below $25k, 600.5% for AGIs $25k-50k, 896.0% for AGIs $50k-75k, 1400.7% for AGIs $75k-100k, 1763.5% for AGIs $100k-200k, 10543.5% for AGIs over 200k)
Net capital gain/loss in AGI: +$66,413 (reported on 56.9% of returns)
Here:
+$66,413
State:
+$44,158
(% of AGI for various income ranges: 195.8% for AGIs below $25k, 479.5% for AGIs $25k-50k, 596.0% for AGIs $50k-75k, 744.3% for AGIs $75k-100k, 1822.6% for AGIs $100k-200k, 32564.5% for AGIs over 200k)
Profit/loss from business: +$63,271 (reported on 28.1% of returns)
Here:
+$63,271
State:
+$22,988
(% of AGI for various income ranges: 326.3% for AGIs below $25k, 1015.3% for AGIs $25k-50k, 981.3% for AGIs $50k-75k, 1775.0% for AGIs $75k-100k, 2858.5% for AGIs $100k-200k, 12831.8% for AGIs over 200k)
Taxable individual retirement arrangement distribution: $37,847 (reported on 13.2% of returns)
06883:
$37,847
Connecticut:
$22,031
(% of AGI for various income ranges: 96.1% for AGIs below $25k, 488.9% for AGIs $25k-50k, 565.3% for AGIs $50k-75k, 874.3% for AGIs $75k-100k, 1592.6% for AGIs $100k-200k, 2765.1% for AGIs over 200k)
Self-employed (Keogh) retirement plans: $36,162 (reported on 5.8% of returns)
06883:
$36,162
Connecticut:
$29,016
(% of AGI for various income ranges: 272.1% for AGIs $100k-200k, 1730.0% for AGIs over 200k)
Total itemized deductions: $44,165 (reported on 42.2% of returns)
Here:
$44,165
State:
$37,613
(% of AGI for various income ranges: 342.6% for AGIs below $25k, 1267.9% for AGIs $25k-50k, 1868.7% for AGIs $50k-75k, 2055.0% for AGIs $75k-100k, 3481.8% for AGIs $100k-200k, 12702.7% for AGIs over 200k)
Charity contributions: $13,965 (reported on 36.2% of returns)
Here:
$13,965
State:
$13,557
(% of AGI for various income ranges: 8.7% for AGIs below $25k, 70.0% for AGIs $25k-50k, 214.0% for AGIs $50k-75k, 188.6% for AGIs $75k-100k, 382.6% for AGIs $100k-200k, 4198.4% for AGIs over 200k)
Taxes paid: $9,821 (reported on 42.2% of returns)
06883:
$9,821
State:
$9,096
(% of AGI for various income ranges: 83.2% for AGIs below $25k, 345.8% for AGIs $25k-50k, 582.7% for AGIs $50k-75k, 648.6% for AGIs $75k-100k, 1052.9% for AGIs $100k-200k, 2495.3% for AGIs over 200k)
Earned income credit: $1,642 (reported on 2.7% of returns)
Here:
$1,642
State:
$2,059
(% of AGI for various income ranges: 34.2% for AGIs below $25k, 35.3% for AGIs $25k-50k)
Percentage of individuals using paid preparers for their 2020 taxes: 92.2%
Here:
92%
State:
93%
(% for various income ranges: 90.9% for AGIs below $25k, 86.5% for AGIs $25k-50k, 90.6% for AGIs $50k-75k, 89.3% for AGIs $75k-100k, 91.0% for AGIs $100k-200k, 95.1% for AGIs over 200k)
Averages for the 2012 tax year for zip code 06883, filed in 2013:
Average Adjusted Gross Income (AGI) in 2012: $338,737 (Individual Income Tax Returns)
Here:
$338,737
State:
$93,290
Salary/wage: $255,886 (reported on 73.2% of returns)
Here:
$255,886
State:
$73,117
(% of AGI for various income ranges: 54.9% for AGIs below $25k, 56.5% for AGIs $25k-50k, 53.7% for AGIs $50k-75k, 52.4% for AGIs $75k-100k, 57.6% for AGIs $100k-200k, 55.2% for AGIs over 200k)
Taxable interest for individuals: $12,478 (reported on 69.9% of returns)
This zip code:
$12,478
Connecticut:
$2,530
(% of AGI for various income ranges: 4.2% for AGIs below $25k, 2.5% for AGIs $25k-50k, 2.2% for AGIs $50k-75k, 2.7% for AGIs $75k-100k, 1.7% for AGIs $100k-200k, 2.6% for AGIs over 200k)
Ordinary dividends: $22,178 (reported on 63.5% of returns)
Here:
$22,178
State:
$10,909
(% of AGI for various income ranges: 15.0% for AGIs below $25k, 6.8% for AGIs $25k-50k, 6.8% for AGIs $50k-75k, 6.1% for AGIs $75k-100k, 5.0% for AGIs $100k-200k, 3.9% for AGIs over 200k)
Net capital gain/loss in AGI: +$77,219 (reported on 55.3% of returns)
Here:
+$77,219
State:
+$34,090
(% of AGI for various income ranges: 3.2% for AGIs below $25k, 5.0% for AGIs $25k-50k, 3.0% for AGIs $50k-75k, 5.1% for AGIs $75k-100k, 3.6% for AGIs $100k-200k, 13.7% for AGIs over 200k)
Profit/loss from business: +$64,279 (reported on 26.8% of returns)
Here:
+$64,279
State:
+$22,741
(% of AGI for various income ranges: 16.2% for AGIs below $25k, 13.0% for AGIs $25k-50k, 12.1% for AGIs $50k-75k, 10.0% for AGIs $75k-100k, 9.8% for AGIs $100k-200k, 4.4% for AGIs over 200k)
Taxable individual retirement arrangement distribution: $57,275 (reported on 17.0% of returns)
06883:
$57,275
Connecticut:
$19,976
(% of AGI for various income ranges: 4.1% for AGIs below $25k, 6.6% for AGIs $25k-50k, 5.9% for AGIs $50k-75k, 8.4% for AGIs $75k-100k, 7.9% for AGIs $100k-200k, 2.3% for AGIs over 200k)
Self-employment retirement plans: $32,115 (reported on 7.3% of returns)
06883:
$32,115
Connecticut:
$24,004
(% of AGI for various income ranges: 2.2% for AGIs $50k-75k, 1.6% for AGIs $100k-200k, 0.6% for AGIs over 200k)
Total itemized deductions: $84,117 (17% of AGI, reported on 68.4% of returns)
Here:
$84,117
State:
$33,239
Here:
17.3% of AGI
State:
18.9% of AGI
(% of AGI for various income ranges: 39.6% for AGIs below $25k, 35.6% for AGIs $25k-50k, 34.9% for AGIs $50k-75k, 38.7% for AGIs $75k-100k, 27.4% for AGIs $100k-200k, 15.2% for AGIs over 200k)
Charity contributions: $10,822 (reported on 61.5% of returns)
Here:
$10,822
State:
$4,947
(% of AGI for various income ranges: 1.5% for AGIs below $25k, 1.7% for AGIs $25k-50k, 1.7% for AGIs $50k-75k, 2.1% for AGIs $75k-100k, 2.1% for AGIs $100k-200k, 2.0% for AGIs over 200k)
Taxes paid: $49,635 (reported on 68.1% of returns)
06883:
$49,635
State:
$17,397
(% of AGI for various income ranges: 16.3% for AGIs below $25k, 13.8% for AGIs $25k-50k, 14.7% for AGIs $50k-75k, 15.3% for AGIs $75k-100k, 14.0% for AGIs $100k-200k, 9.4% for AGIs over 200k)
Earned income credit: $1,530 (reported on 2.2% of returns)
Here:
$1,530
State:
$2,053
(% of AGI for various income ranges: 1.2% for AGIs below $25k, 0.3% for AGIs $25k-50k)
Percentage of individuals using paid preparers for their 2012 taxes: 72.8%
Here:
73%
State:
55%
(% for various income ranges: 68.1% for AGIs below $25k, 62.5% for AGIs $25k-50k, 68.8% for AGIs $50k-75k, 70.8% for AGIs $75k-100k, 72.4% for AGIs $100k-200k, 79.9% for AGIs over 200k)
Averages for the 2004 tax year for zip code 06883, filed in 2005:
Average Adjusted Gross Income (AGI) in 2004: $289,891 (Individual Income Tax Returns)
Here:
$289,891
State:
$73,265
Salary/wage: $263,134 (reported on 68.4% of returns)
Here:
$263,134
State:
$62,030
(% of AGI for various income ranges: 46.6% for AGIs $10k-25k, 54.5% for AGIs $25k-50k, 51.3% for AGIs $50k-75k, 51.7% for AGIs $75k-100k, 62.0% for AGIs over 100k)
Taxable interest for individuals: $7,841 (reported on 79.1% of returns)
This zip code:
$7,841
Connecticut:
$2,287
(% of AGI for various income ranges: 9.8% for AGIs $10k-25k, 7.2% for AGIs $25k-50k, 3.8% for AGIs $50k-75k, 4.2% for AGIs $75k-100k, 1.9% for AGIs over 100k)
Taxable dividends: $12,553 (reported on 72.1% of returns)
Here:
$12,553
State:
$5,735
(% of AGI for various income ranges: 12.8% for AGIs $10k-25k, 6.2% for AGIs $25k-50k, 5.8% for AGIs $50k-75k, 6.3% for AGIs $75k-100k, 2.8% for AGIs over 100k)
Net capital gain/loss: +$56,583 (reported on 67.6% of returns)
Here:
+$56,583
State:
+$23,694
(% of AGI for various income ranges: 6.8% for AGIs $10k-25k, 5.8% for AGIs $25k-50k, 4.8% for AGIs $50k-75k, 3.1% for AGIs $75k-100k, 13.6% for AGIs over 100k)
Profit/loss from business: +$57,174 (reported on 25.1% of returns)
Here:
+$57,174
State:
+$20,783
(% of AGI for various income ranges: 16.5% for AGIs $10k-25k, 12.1% for AGIs $25k-50k, 10.5% for AGIs $50k-75k, 13.7% for AGIs $75k-100k, 4.5% for AGIs over 100k)
IRA payment deduction: $3,918 (reported on 4.0% of returns)
06883:
$3,918
Connecticut:
$3,216
(% of AGI for various income ranges: 0.8% for AGIs $10k-25k, 0.5% for AGIs $25k-50k, 0.5% for AGIs $50k-75k, 0.2% for AGIs $75k-100k, 0.0% for AGIs over 100k)
Self-employed pension: $28,699 (reported on 7.8% of returns)
Here:
$28,699
Connecticut:
$17,335
(% of AGI for various income ranges: 0.7% for AGIs $25k-50k, 1.0% for AGIs $50k-75k, 1.4% for AGIs $75k-100k, 0.8% for AGIs over 100k)
Total itemized deductions: $59,689 (13% of AGI, reported on 64.8% of returns)
Here:
$59,689
State:
$24,919
Here:
13.5% of AGI
State:
18.6% of AGI
(% of AGI for various income ranges: 45.7% for AGIs $10k-25k, 37.9% for AGIs $25k-50k, 38.8% for AGIs $50k-75k, 33.0% for AGIs $75k-100k, 12.0% for AGIs over 100k)
Charity contributions deductions: $8,746 (2% of AGI, reported on 61.4% of returns)
Here:
$8,746
State:
$3,762
Here:
1.9% of AGI
State:
2.7% of AGI
(% of AGI for various income ranges: 2.4% for AGIs $10k-25k, 2.9% for AGIs $25k-50k, 2.8% for AGIs $50k-75k, 2.7% for AGIs $75k-100k, 1.8% for AGIs over 100k)
Total tax: $88,226 (reported on 81.5% of returns)
06883:
$88,226
State:
$15,148
(% of AGI for various income ranges: 6.2% for AGIs $10k-25k, 8.6% for AGIs $25k-50k, 9.8% for AGIs $50k-75k, 11.0% for AGIs $75k-100k, 25.4% for AGIs over 100k)
Earned income credit: $1,097 (reported on 1.6% of returns)
Here:
$1,097
State:
$1,570
Percentage of individuals using paid preparers for their 2004 taxes: 74.6%
Here:
75%
State:
59%
(% for various income ranges: 73.7% for AGIs below $10k, 68.5% for AGIs $10k-25k, 66.3% for AGIs $25k-50k, 74.7% for AGIs $50k-75k, 71.2% for AGIs $75k-100k, 78.1% for AGIs over 100k)
Household received Food Stamps/SNAP in the past 12 months: 24 Household did not receive Food Stamps/SNAP in the past 12 months: 3,563
Women who had a birth in the past 12 months: 54 (52 now married, 0 unmarried) Women who did not have a birth in the past 12 months: 2,156 (899 now married, 1,247 unmarried)
Housing units in zip code 06883 with a mortgage: 2,568 (509 second mortgage, 45 home equity loan, 397 both second mortgage and home equity loan) Houses without a mortgage: 34
Median monthly owner costs for units with a mortgage: $3,810 Median monthly owner costs for units without a mortgage: $1,443
Residents with income below the poverty level in 2022:
This zip code:
1.8%
Whole state:
9.8%
Residents with income below 50% of the poverty level in 2022:
This zip code:
0.8%
Whole state:
4.8%
Median number of rooms in houses and condos:
Here:
10.0
State:
6.5
Median number of rooms in apartments:
Here:
9.8
State:
4.0
Notable locations in this zip code not listed on our city pages
Notable locations in zip code 06883: Aspetuck Valley Country Club (A), Weston Public Library (B), Weston Volunteer Emergency Medical Services (C), Weston Volunteer Fire Department Station 2 (D), Weston Town Fire Chief's Office (E), Weston Volunteer Fire Department Station 1 Headquarters (F). Display/hide their locations on the map
Lakes and reservoirs: Cobbs Mill Pond (A), Davidge Pond (B), Godfrey Pond (C), Laurel Lake (D), Princes Pond (E), Beaver Brook Pond (F), Held Pond (G), Saugatuck Reservoir (H). Display/hide their locations on the map
Streams, rivers, and creeks: North Branch West Branch Saugatuck River (A), Beaver Brook (B), Davidge Brook (C), Godfrey Brook (D), Hawleys Brook (E), Jennings Brook (F), Kettle Creek (G). Display/hide their locations on the map
In group quarters: 1 (-1 institutionalized population)
Size of family households: 1,280 2-persons, 543 3-persons, 856 4-persons, 253 5-persons, 38 6-persons, 8 7-or-more-persons
Size of nonfamily households: 455 1-person, 110 2-persons
2,386 married couples with children.
322 single-parent households (116 men, 206 women).
83.0% of residents of 06883 zip code speak English at home.
4.2% of residents speak Spanish at home (80% very well, 10% well, 5% not well, 5% not at all).
6.1% of residents speak other Indo-European language at home (78% very well, 22% well).
3.6% of residents speak Asian or Pacific Island language at home (57% very well, 38% well, 5% not well).
2.7% of residents speak other language at home (100% very well).
Foreign born population: 1,643 (15.8%) (67.3% of them are naturalized citizens)
This zip code:
15.8%
Whole state:
15.7%
17%Uganda
14%Sweden
7%United Kingdom, excluding England and Scotland
6%Greece
4%France
4%Bhutan
3%Germany
11%American
7%Italian
7%European
7%Eastern European
6%English
5%Polish
4%Irish
Year of entry for the foreign-born population
3842010 or later
2712000 to 2009
3681990 to 1999
699Before 1990
Facilities with environmental interests located in this zip code:
HURLBUTT ELEMENTARY SCHOOL (9 SCHOOL RD in WESTON, CT)
COMPLIANCE ACTIVITY (Tracking inspections of insecticide, fungicide, and rodenticide, and toxic substances) (National Center for Education Statistics) - STATE ID-1 Organizations: WESTON SCHOOL DISTRICT (SCHOOL DISTRICT)
HOMEBOUND (24 SCHOOL ROAD in WESTON, CT)
(National Center for Education Statistics) - STATE ID-88 Organizations: WESTON SCHOOL DISTRICT (SCHOOL DISTRICT)
NU POLE #776 (ROGUES RIDGE ROAD in WESTON, CT)
COMPLIANCE ACTIVITY (Tracking inspections of insecticide, fungicide, and rodenticide, and toxic substances)
NU SPILL (GOODHILL RD. EXT. in WESTON, CT)
COMPLIANCE ACTIVITY (Tracking inspections of insecticide, fungicide, and rodenticide, and toxic substances)
Housing units lacking complete kitchen facilities: 0.5%
71.1%Fuel oil, kerosene, etc.
16.8%Utility gas
7.3%Bottled, tank, or LP gas
3.1%Electricity
0.7%Wood
0.7%Other fuel
Population in 1990: 8,517. Population change in the 1990s: +1,520 (+17.8%).
Place of birth for U.S.-born residents:
This state: 3,237
Northeast: 3,953
Midwest: 750
South: 491
West: 279
62% of the 06883 zip code residents lived in the same house 5 years ago. Out of people who lived in different houses, 58% lived in this county. Out of people who lived in different counties, 50% lived in Connecticut.
94% of the 06883 zip code residents lived in the same house 1 year ago. Out of people who lived in different houses, 38% moved from this county. Out of people who lived in different houses, 3% moved from different county within same state. Out of people who lived in different houses, 65% moved from different state. Out of people who lived in different houses, 7% moved from abroad.
Private vs. public school enrollment:
Students in private schools in grades 1 to 8 (elementary and middle school): 40
Here:
3.0%
Connecticut:
9.5%
Students in private schools in grades 9 to 12 (high school): 114
Here:
11.6%
Connecticut:
12.9%
Students in private undergraduate colleges: 139
Here:
41.8%
Connecticut:
35.5%
Occupation by median earnings in the past 12 months ($)
250,276Architecture and engineering occupations
213,789Legal occupations
169,332Business and financial operations occupations
160,150Management occupations
131,333Computer and mathematical occupations
125,038Life, physical, and social science occupations
Top industries in this zip code by the number of employees in 2005:
Health Care and Social Assistance: Offices of Physicians (except Mental Health Specialists) (50-99 employees: 1 establishment, 10-19 employees: 1 establishment, 1-4 employees: 1 establishment)
Arts, Entertainment, and Recreation: Golf Courses and Country Clubs (50-99: 1)
Health Care and Social Assistance: Child Day Care Services (20-49: 2)
Other Services (except Public Administration): Religious Organizations (20-49: 1, 10-19: 1, 5-9: 1)
Arts, Entertainment, and Recreation: Fitness and Recreational Sports Centers (20-49: 1, 10-19: 1, 1-4: 1)
Accommodation and Food Services: Full-Service Restaurants (20-49: 1, 5-9: 1)
Administrative and Support and Waste Management and Remediation Services: Landscaping Services (10-19: 1, 5-9: 1, 1-4: 2)
Detailed PMIC statistics for the following Tracts:0551.00
, 0552.00
2002 - 2018 National Fire Incident Reporting System (NFIRS) incidents
Based on the data from the years 2002 - 2018 the average number of fire incidents per year is 33. The highest number of fires - 49 took place in 2005, and the least - 18 in 2002. The data has a growing trend.
When looking into fire subcategories, the most reports belonged to: Structure Fires (62.7%), and Outside Fires (26.0%).
Fire incident types reported to NFIRS in Zip Code 06883


 Nearest zip codes: 06612, 06897, 06896, 06851, 06880, 06824.


 Based on the data from the years 2002 - 2018 the average number of fire incidents per year is 33. The highest number of fires - 49 took place in 2005, and the least - 18 in 2002. The data has a growing trend.
 When looking into fire subcategories, the most reports belonged to: Structure Fires (62.7%), and Outside Fires (26.0%).