Estimated zip code population in 2022: 9,449 Zip code population in 2010: 9,376 Zip code population in 2000: 8,660
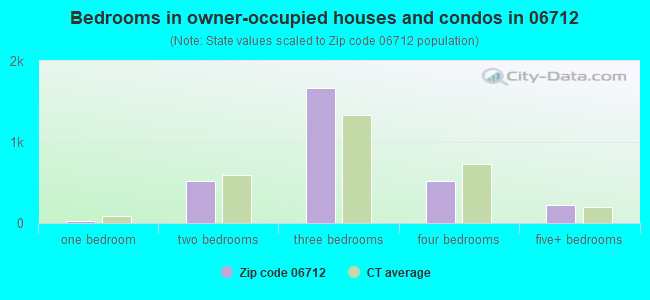
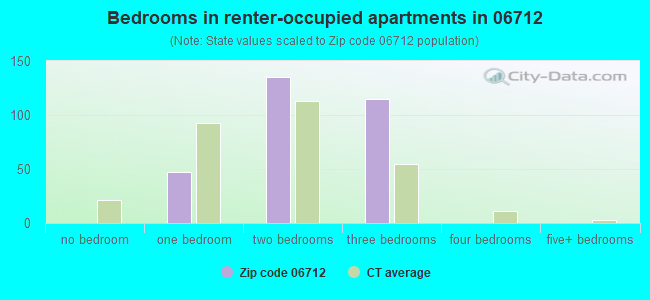
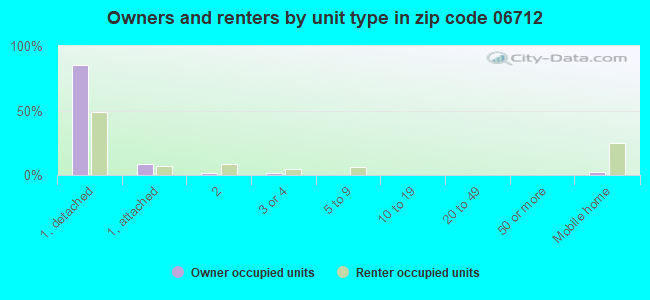
Houses and condos: 3,514 Renter-occupied apartments: 302
% of renters here:
9%
State:
34%
March 2022 cost of living index in zip code 06712: 126.8 (high, U.S. average is 100)
Land area: 14.2 sq. mi. Water area: 0.2 sq. mi.
Population density: 664 people per square mile
(low).
OSM Map
Google Map
MSN Map
OSM Map
General Map
Google Map
MSN Map
OSM Map
Google Map
MSN Map
OSM Map
Google Map
MSN Map
Please wait while loading the map...
Real estate property taxes paid for housing units in 2022:
This zip code:
1.7% ($6,126)
Connecticut:
1.8% ($6,189)
Median real estate property taxes paid for housing units with mortgages in 2022: $6,317 (1.7%) Median real estate property taxes paid for housing units with no mortgage in 2022: $5,387 (1.9%)
Estimated median house/condo value in 2022: $355,137
06712:
$355,137
Connecticut:
$347,200
According to our research of Connecticut and other state lists, there were 10 registered sex offenders living in 06712 zip code as of May 28, 2024. The ratio of all residents to sex offenders in zip code 06712 is 986 to 1. The ratio of registered sex offenders to all residents in this zip code is lower than the state average.
Median resident age:
This zip code:
45.7 years
Connecticut median age:
40.9 years
Average household size:
This zip code:
2.9 people
Connecticut:
2.5 people
Averages for the 2020 tax year for zip code 06712, filed in 2021:
Average Adjusted Gross Income (AGI) in 2020: $85,952 (Individual Income Tax Returns)
Here:
$85,952
State:
$105,931
Salary/wage: $77,230 (reported on 79.2% of returns)
Here:
$77,230
State:
$83,540
(% of AGI for various income ranges: 997.8% for AGIs below $25k, 3420.2% for AGIs $25k-50k, 5726.0% for AGIs $50k-75k, 9047.4% for AGIs $75k-100k, 18083.7% for AGIs $100k-200k, 70237.3% for AGIs over 200k)
Taxable interest for individuals: $1,346 (reported on 46.7% of returns)
This zip code:
$1,346
Connecticut:
$3,402
(% of AGI for various income ranges: 27.4% for AGIs below $25k, 41.7% for AGIs $25k-50k, 52.7% for AGIs $50k-75k, 127.9% for AGIs $75k-100k, 161.2% for AGIs $100k-200k, 626.4% for AGIs over 200k)
Ordinary dividends: $3,829 (reported on 30.7% of returns)
Here:
$3,829
State:
$12,683
(% of AGI for various income ranges: 39.7% for AGIs below $25k, 65.6% for AGIs $25k-50k, 113.1% for AGIs $50k-75k, 141.7% for AGIs $75k-100k, 269.3% for AGIs $100k-200k, 1833.6% for AGIs over 200k)
Net capital gain/loss in AGI: +$7,024 (reported on 25.5% of returns)
Here:
+$7,024
State:
+$44,158
(% of AGI for various income ranges: 9.7% for AGIs below $25k, 38.0% for AGIs $25k-50k, 104.5% for AGIs $50k-75k, 176.2% for AGIs $75k-100k, 399.5% for AGIs $100k-200k, 4095.5% for AGIs over 200k)
Profit/loss from business: +$21,142 (reported on 15.2% of returns)
Here:
+$21,142
State:
+$22,988
(% of AGI for various income ranges: 88.0% for AGIs below $25k, 173.2% for AGIs $25k-50k, 306.5% for AGIs $50k-75k, 325.2% for AGIs $75k-100k, 666.3% for AGIs $100k-200k, 5955.5% for AGIs over 200k)
Taxable individual retirement arrangement distribution: $19,168 (reported on 14.1% of returns)
06712:
$19,168
Connecticut:
$22,031
(% of AGI for various income ranges: 146.6% for AGIs below $25k, 223.9% for AGIs $25k-50k, 239.8% for AGIs $50k-75k, 358.3% for AGIs $75k-100k, 824.7% for AGIs $100k-200k, 1975.5% for AGIs over 200k)
Self-employed (Keogh) retirement plans: $16,120 (reported on 1.0% of returns)
06712:
$16,120
Connecticut:
$29,016
(% of AGI for various income ranges: 110.4% for AGIs $100k-200k)
Total itemized deductions: $25,248 (reported on 12.9% of returns)
Here:
$25,248
State:
$37,613
(% of AGI for various income ranges: 118.9% for AGIs below $25k, 167.1% for AGIs $25k-50k, 500.5% for AGIs $50k-75k, 682.9% for AGIs $75k-100k, 839.3% for AGIs $100k-200k, 2414.5% for AGIs over 200k)
Charity contributions: $4,427 (reported on 9.5% of returns)
Here:
$4,427
State:
$13,557
(% of AGI for various income ranges: 13.0% for AGIs $25k-50k, 48.7% for AGIs $50k-75k, 58.6% for AGIs $75k-100k, 120.0% for AGIs $100k-200k, 590.0% for AGIs over 200k)
Taxes paid: $8,945 (reported on 12.9% of returns)
06712:
$8,945
State:
$9,096
(% of AGI for various income ranges: 24.9% for AGIs below $25k, 56.2% for AGIs $25k-50k, 190.7% for AGIs $50k-75k, 270.7% for AGIs $75k-100k, 311.0% for AGIs $100k-200k, 725.5% for AGIs over 200k)
Earned income credit: $1,652 (reported on 5.7% of returns)
Here:
$1,652
State:
$2,059
(% of AGI for various income ranges: 32.8% for AGIs below $25k, 34.8% for AGIs $25k-50k)
Percentage of individuals using paid preparers for their 2020 taxes: 91.9%
Here:
92%
State:
93%
(% for various income ranges: 90.4% for AGIs below $25k, 92.1% for AGIs $25k-50k, 92.1% for AGIs $50k-75k, 91.9% for AGIs $75k-100k, 93.0% for AGIs $100k-200k, 91.4% for AGIs over 200k)
Averages for the 2012 tax year for zip code 06712, filed in 2013:
Average Adjusted Gross Income (AGI) in 2012: $70,820 (Individual Income Tax Returns)
Here:
$70,820
State:
$93,290
Salary/wage: $65,163 (reported on 83.3% of returns)
Here:
$65,163
State:
$73,117
(% of AGI for various income ranges: 69.9% for AGIs below $25k, 71.3% for AGIs $25k-50k, 73.8% for AGIs $50k-75k, 75.5% for AGIs $75k-100k, 82.6% for AGIs $100k-200k, 69.7% for AGIs over 200k)
Taxable interest for individuals: $841 (reported on 58.7% of returns)
This zip code:
$841
Connecticut:
$2,530
(% of AGI for various income ranges: 1.4% for AGIs below $25k, 0.9% for AGIs $25k-50k, 0.4% for AGIs $50k-75k, 0.6% for AGIs $75k-100k, 0.6% for AGIs $100k-200k, 1.0% for AGIs over 200k)
Ordinary dividends: $2,346 (reported on 32.8% of returns)
Here:
$2,346
State:
$10,909
(% of AGI for various income ranges: 2.7% for AGIs below $25k, 1.5% for AGIs $25k-50k, 1.0% for AGIs $50k-75k, 1.2% for AGIs $75k-100k, 0.8% for AGIs $100k-200k, 1.1% for AGIs over 200k)
Net capital gain/loss in AGI: +$2,158 (reported on 22.1% of returns)
Here:
+$2,158
State:
+$34,090
(% of AGI for various income ranges: 0.8% for AGIs $75k-100k, 0.7% for AGIs $100k-200k, 2.2% for AGIs over 200k)
Profit/loss from business: +$18,630 (reported on 15.2% of returns)
Here:
+$18,630
State:
+$22,741
(% of AGI for various income ranges: 6.5% for AGIs below $25k, 6.1% for AGIs $25k-50k, 4.5% for AGIs $50k-75k, 2.7% for AGIs $75k-100k, 2.4% for AGIs $100k-200k, 7.1% for AGIs over 200k)
Taxable individual retirement arrangement distribution: $15,559 (reported on 13.2% of returns)
06712:
$15,559
Connecticut:
$19,976
(% of AGI for various income ranges: 5.4% for AGIs below $25k, 3.8% for AGIs $25k-50k, 2.7% for AGIs $50k-75k, 3.0% for AGIs $75k-100k, 2.0% for AGIs $100k-200k, 3.9% for AGIs over 200k)
Self-employment retirement plans: $14,240 (reported on 1.0% of returns)
06712:
$14,240
Connecticut:
$24,004
Total itemized deductions: $23,036 (21% of AGI, reported on 51.6% of returns)
Here:
$23,036
State:
$33,239
Here:
21.3% of AGI
State:
18.9% of AGI
(% of AGI for various income ranges: 14.4% for AGIs below $25k, 15.4% for AGIs $25k-50k, 18.7% for AGIs $50k-75k, 18.6% for AGIs $75k-100k, 17.3% for AGIs $100k-200k, 13.5% for AGIs over 200k)
Charity contributions: $2,052 (reported on 44.9% of returns)
Here:
$2,052
State:
$4,947
(% of AGI for various income ranges: 0.7% for AGIs below $25k, 1.0% for AGIs $25k-50k, 1.3% for AGIs $50k-75k, 1.5% for AGIs $75k-100k, 1.4% for AGIs $100k-200k, 1.3% for AGIs over 200k)
Taxes paid: $11,516 (reported on 51.6% of returns)
06712:
$11,516
State:
$17,397
(% of AGI for various income ranges: 4.7% for AGIs below $25k, 6.2% for AGIs $25k-50k, 7.5% for AGIs $50k-75k, 8.7% for AGIs $75k-100k, 9.4% for AGIs $100k-200k, 8.4% for AGIs over 200k)
Earned income credit: $1,635 (reported on 6.5% of returns)
Here:
$1,635
State:
$2,053
(% of AGI for various income ranges: 2.3% for AGIs below $25k, 0.5% for AGIs $25k-50k)
Percentage of individuals using paid preparers for their 2012 taxes: 58.0%
Here:
58%
State:
55%
(% for various income ranges: 50.4% for AGIs below $25k, 55.1% for AGIs $25k-50k, 66.2% for AGIs $50k-75k, 61.4% for AGIs $75k-100k, 61.5% for AGIs $100k-200k, 66.7% for AGIs over 200k)
Averages for the 2004 tax year for zip code 06712, filed in 2005:
Average Adjusted Gross Income (AGI) in 2004: $59,161 (Individual Income Tax Returns)
Here:
$59,161
State:
$73,265
Salary/wage: $56,283 (reported on 86.0% of returns)
Here:
$56,283
State:
$62,030
(% of AGI for various income ranges: 94.9% for AGIs below $10k, 68.5% for AGIs $10k-25k, 77.0% for AGIs $25k-50k, 82.2% for AGIs $50k-75k, 85.4% for AGIs $75k-100k, 82.5% for AGIs over 100k)
Taxable interest for individuals: $904 (reported on 71.7% of returns)
This zip code:
$904
Connecticut:
$2,287
(% of AGI for various income ranges: 6.3% for AGIs below $10k, 2.6% for AGIs $10k-25k, 1.2% for AGIs $25k-50k, 1.2% for AGIs $50k-75k, 1.1% for AGIs $75k-100k, 0.7% for AGIs over 100k)
Taxable dividends: $1,541 (reported on 38.3% of returns)
Here:
$1,541
State:
$5,735
(% of AGI for various income ranges: 4.6% for AGIs below $10k, 2.1% for AGIs $10k-25k, 1.2% for AGIs $25k-50k, 0.8% for AGIs $50k-75k, 0.6% for AGIs $75k-100k, 1.0% for AGIs over 100k)
Net capital gain/loss: +$3,948 (reported on 28.0% of returns)
Here:
+$3,948
State:
+$23,694
(% of AGI for various income ranges: -0.2% for AGIs below $10k, -0.4% for AGIs $10k-25k, 0.5% for AGIs $25k-50k, 0.7% for AGIs $50k-75k, 0.8% for AGIs $75k-100k, 3.4% for AGIs over 100k)
Profit/loss from business: +$17,257 (reported on 15.3% of returns)
Here:
+$17,257
State:
+$20,783
(% of AGI for various income ranges: -2.8% for AGIs below $10k, 5.3% for AGIs $10k-25k, 5.4% for AGIs $25k-50k, 4.1% for AGIs $50k-75k, 3.8% for AGIs $75k-100k, 4.7% for AGIs over 100k)
IRA payment deduction: $3,466 (reported on 4.4% of returns)
06712:
$3,466
Connecticut:
$3,216
(% of AGI for various income ranges: 0.6% for AGIs $10k-25k, 0.5% for AGIs $25k-50k, 0.3% for AGIs $50k-75k, 0.3% for AGIs $75k-100k, 0.1% for AGIs over 100k)
Self-employed pension: $12,657 (reported on 1.6% of returns)
Here:
$12,657
Connecticut:
$17,335
(% of AGI for various income ranges: 0.3% for AGIs $50k-75k, 0.1% for AGIs $75k-100k, 0.6% for AGIs over 100k)
Total itemized deductions: $19,655 (22% of AGI, reported on 51.6% of returns)
Here:
$19,655
State:
$24,919
Here:
21.5% of AGI
State:
18.6% of AGI
(% of AGI for various income ranges: 20.0% for AGIs below $10k, 14.4% for AGIs $10k-25k, 15.1% for AGIs $25k-50k, 18.5% for AGIs $50k-75k, 19.5% for AGIs $75k-100k, 16.4% for AGIs over 100k)
Charity contributions deductions: $1,886 (2% of AGI, reported on 47.8% of returns)
Here:
$1,886
State:
$3,762
Here:
2.0% of AGI
State:
2.7% of AGI
(% of AGI for various income ranges: 0.7% for AGIs below $10k, 0.9% for AGIs $10k-25k, 1.2% for AGIs $25k-50k, 1.6% for AGIs $50k-75k, 1.8% for AGIs $75k-100k, 1.5% for AGIs over 100k)
Total tax: $8,470 (reported on 83.9% of returns)
06712:
$8,470
State:
$15,148
(% of AGI for various income ranges: 2.5% for AGIs below $10k, 5.0% for AGIs $10k-25k, 8.2% for AGIs $25k-50k, 9.1% for AGIs $50k-75k, 9.8% for AGIs $75k-100k, 16.0% for AGIs over 100k)
Earned income credit: $1,379 (reported on 4.9% of returns)
Here:
$1,379
State:
$1,570
Percentage of individuals using paid preparers for their 2004 taxes: 58.4%
Here:
58%
State:
59%
(% for various income ranges: 47.2% for AGIs below $10k, 54.6% for AGIs $10k-25k, 61.4% for AGIs $25k-50k, 64.5% for AGIs $50k-75k, 63.7% for AGIs $75k-100k, 59.2% for AGIs over 100k)
Household received Food Stamps/SNAP in the past 12 months: 159 Household did not receive Food Stamps/SNAP in the past 12 months: 3,090
Women who had a birth in the past 12 months: 44 (42 now married, 0 unmarried) Women who did not have a birth in the past 12 months: 1,710 (864 now married, 826 unmarried)
Housing units in zip code 06712 with a mortgage: 2,012 (333 second mortgage, 8 home equity loan, 163 both second mortgage and home equity loan) Houses without a mortgage: 86
Median monthly owner costs for units with a mortgage: $2,294 Median monthly owner costs for units without a mortgage: $945
Residents with income below the poverty level in 2022:
This zip code:
2.5%
Whole state:
9.8%
Residents with income below 50% of the poverty level in 2022:
This zip code:
1.9%
Whole state:
4.8%
Median number of rooms in houses and condos:
Here:
6.5
State:
6.5
Median number of rooms in apartments:
Here:
4.4
State:
4.0
Notable locations in this zip code not listed on our city pages
Notable locations in zip code 06712: Highland Greens Golf Course (A), Hotchkiss House (B), United Church of Christ Library (C), Prospect Town Garage (D), Prospect Public Library (E), Volunteer Fire Department of Prospect (F). Display/hide their locations on the map
Lakes and reservoirs: Beer Pond (A), Brooks Pond (B), Waterbury Reservoir Number 2 (C), Old Naugatuck Reservoir (D), West Brook Reservoir (E), Cheshire Reservoir (F), New Naugatuck Reservoir (G). Display/hide their locations on the map
Parks in zip code 06712 include: Town Hall Field (1), McGrath Park (2), Confield Park (3), Fusco Field (4), Hotchkiss Field (5). Display/hide their locations on the map
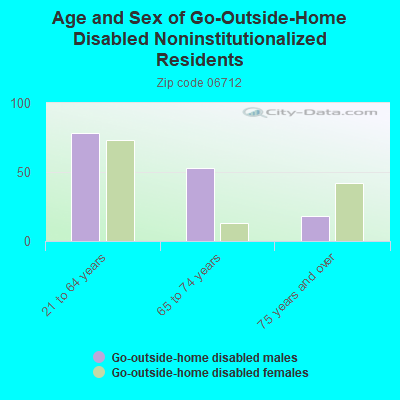
In group quarters: 129 (-1 institutionalized population)
Size of family households: 1,020 2-persons, 337 3-persons, 667 4-persons, 99 5-persons, 193 6-persons, 57 7-or-more-persons
Size of nonfamily households: 690 1-person, 174 2-persons, 16 3-persons
1,274 married couples with children.
437 single-parent households (272 men, 165 women).
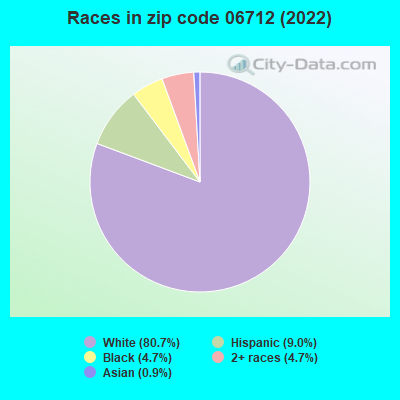
81.6% of residents of 06712 zip code speak English at home.
8.5% of residents speak Spanish at home (48% very well, 33% well, 20% not at all).
7.6% of residents speak other Indo-European language at home (66% very well, 29% well, 4% not well, 2% not at all).
1.1% of residents speak Asian or Pacific Island language at home (51% very well, 49% well).
1.6% of residents speak other language at home (49% very well, 51% not well).
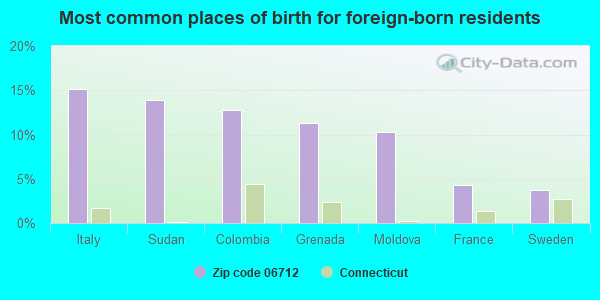
Foreign born population: 1,103 (11.7%) (64.0% of them are naturalized citizens)
This zip code:
11.7%
Whole state:
15.7%
15%Italy
14%Sudan
13%Colombia
11%Grenada
10%Moldova
4%France
4%Sweden
29%Italian
8%German
8%Irish
7%Portuguese
5%French Canadian
4%Jamaican
4%American
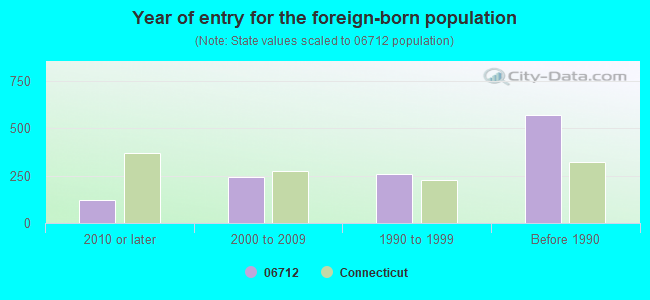
Year of entry for the foreign-born population
1202010 or later
2432000 to 2009
2591990 to 1999
569Before 1990
Major facilities with environmental interests located in this zip code:
ALGONQUIN SCHOOL (30 COER ROAD in PROSPECT, CT)
(Geographic Names Information System) (National Center for Education Statistics) - STATE ID-3 Organizations: REGIONAL SCHOOL DISTRICT 16 (SCHOOL DISTRICT)
COMMUNITY SCHOOL (12 CENTER STREET in PROSPECT, CT)
(National Center for Education Statistics) - STATE ID-2 Organizations: REGIONAL SCHOOL DISTRICT 16 (SCHOOL DISTRICT)
HOMEBOUND (207 NEW HAVEN ROAD in PROSPECT, CT)
(National Center for Education Statistics) - STATE ID-88 Organizations: REGIONAL SCHOOL DISTRICT 16 (SCHOOL DISTRICT)
CLIMCO ENVIRONMENTAL SERVICE INC (26 HYDELOR AVE in PROSPECT, CT)
EAGLE AUTO BODY INC (128 UNION CITY RD RTE 68 in PROSPECT, CT)
Conditionally Exempt Small Quantity Generators, less than 100 kg/month of hazardous waste (Resource Conservation and Recovery Act (tracking hazardous waste)) Business NAICS classification: AUTOMOTIVE BODY, PAINT, AND INTERIOR REPAIR AND MAINTENANCE. Organizations: ANTHONY J SCIANTI (CONTACT/OWNER)
GREAT BROOK INDUSTRIAL PARK (675-730 NORTH MAIN ST in WATERBURY, CT)
COMPLIANCE ACTIVITY (Tracking inspections of insecticide, fungicide, and rodenticide, and toxic substances)
HERITAGE POLLUTION CONTROL INC (XXXX in PROSPECT, CT)
(Resource Conservation and Recovery Act (tracking hazardous waste)) Organizations: DONALD MULCAHY (CONTACT/OWNER)
O & G INDUSTRIES, INC (SALEM RD in PROSPECT, CT)
AIR SYNTHETIC MINOR (AIRS/AFS) AIR MINOR (AIRS/AFS) Business SIC classification: CRUSHED AND BROKEN STONE
EXXONMOBIL OIL CORP SERV STA P34 (JCT RTES 68 & 69 in PROSPECT, CT)
Small Quantity Generators, between 100 kg and 1000 kg of hazardous waste/month (Resource Conservation and Recovery Act (tracking hazardous waste)) - notification Organizations: OPERNAME (CONTACT/OPERATOR)
, MOBIL OIL CORP MKTG ENVR (CONTACT/OWNER)
C V S 1244 (73 WATERBURY RD in PROSPECT, CT)
Small Quantity Generators, between 100 kg and 1000 kg of hazardous waste/month (Resource Conservation and Recovery Act (tracking hazardous waste)) - notification Organizations: CVS PHARMACY (CONTACT/OWNER)
COCCIOLA PROPERTY (ROUTE 68 in PROSPECT, CT)
COMPLIANCE ACTIVITY (Tracking inspections of insecticide, fungicide, and rodenticide, and toxic substances) Alternative names: COCCIOLA PROPERTY (SUNSHINE CONSTR.)
DURACORE RADIATOR OF PROSPECT (150 WATERBURY RD in PROSPECT, CT)
Small Quantity Generators, between 100 kg and 1000 kg of hazardous waste/month (Resource Conservation and Recovery Act (tracking hazardous waste)) - notification Organizations: MICHELE & DAVID LAMONTAGNE (CONTACT/OWNER)
EDWARDS PRINTING & PREPRESS (16 WATERBURY RD in PROSPECT, CT)
Conditionally Exempt Small Quantity Generators, less than 100 kg/month of hazardous waste (Resource Conservation and Recovery Act (tracking hazardous waste)) - notification Organizations: BEN EDWARDS SR (CONTACT/OWNER)
Housing units lacking complete plumbing facilities: 1.2% Housing units lacking complete kitchen facilities: 1.3%
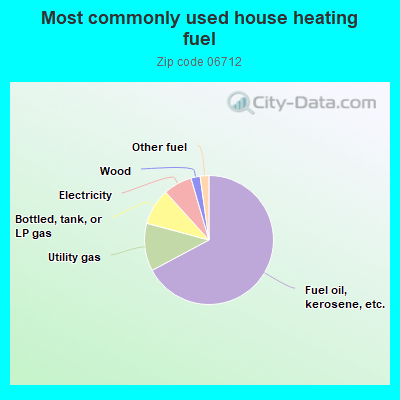
67.2%Fuel oil, kerosene, etc.
12.0%Utility gas
9.1%Bottled, tank, or LP gas
7.2%Electricity
2.3%Wood
2.2%Other fuel
Population in 1990: 7,775. Population change in the 1990s: +885 (+11.4%).
Place of birth for U.S.-born residents:
This state: 6,948
Northeast: 860
Midwest: 104
South: 145
West: 53
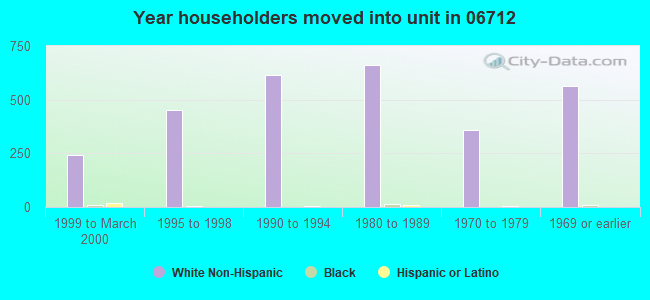
75% of the 06712 zip code residents lived in the same house 5 years ago. Out of people who lived in different houses, 85% lived in this county. Out of people who lived in different counties, 50% lived in Connecticut.
89% of the 06712 zip code residents lived in the same house 1 year ago. Out of people who lived in different houses, 57% moved from this county. Out of people who lived in different houses, 12% moved from different county within same state. Out of people who lived in different houses, 26% moved from different state.
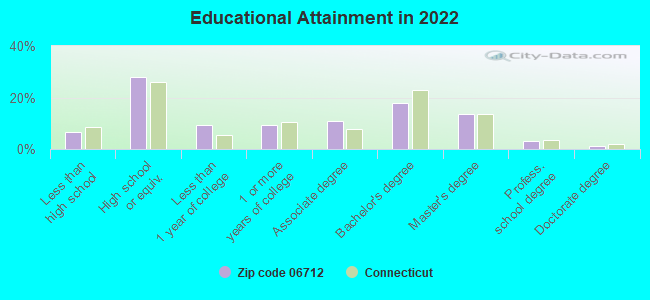
Private vs. public school enrollment:
Students in private schools in grades 1 to 8 (elementary and middle school): 56
Here:
5.2%
Connecticut:
9.5%
Students in private schools in grades 9 to 12 (high school): 144
Here:
28.6%
Connecticut:
12.9%
Students in private undergraduate colleges: 51
Here:
17.1%
Connecticut:
35.5%
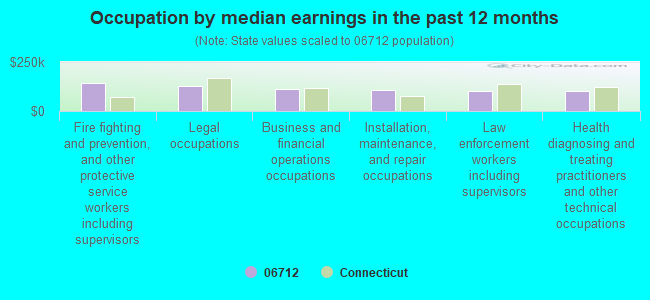
Occupation by median earnings in the past 12 months ($)
142,742Fire fighting and prevention, and other protective service workers including supervisors
126,507Legal occupations
113,095Business and financial operations occupations
105,611Installation, maintenance, and repair occupations
100,823Law enforcement workers including supervisors
100,631Health diagnosing and treating practitioners and other technical occupations
Companies with federal contracts located in this zip code:
DOM MOFFO TRUCKING INC (152 WATERBURY ROAD in PROSPECT, CT; small business) : $67,158 in 9 contractsfrom 2002 to 2005
Contracts for Snow Removal/Salt Service (also spreading aggregate or other snow melting material) by Army Signed by year:2000: $0; 2001: $0; 2002: $13,983; 2003: $14,268; 2004: $16,751; 2005: $22,156; 2006: $0.
Biggest contracts:
$20,118 with Army for Snow Removal/Salt Service (also spreading aggregate or other snow melting material). Signed on 2005-11-16. Completion date: 2006-10-31.
$14,763, same as above.Signed on 2004-11-01. Completion date: 2005-10-31.
$14,373, same as above.Signed on 2003-11-01. Completion date: 2004-10-31.
$13,983, same as above.Signed on 2002-11-01. Completion date: 2003-10-31.
VALCORE MANUFACTURING LLC (31 TRESS RD in PROSPECT, CT; small business) : $24,798 in 3 contractsfrom 2002 to 2005
$19,695 with Defense Logistics Agency for Nuts and Washers. Signed on 2005-04-07. Completion date: 2005-12-04.
$5,103 with Army for Small Craft. Signed on 2003-07-22. Completion date: 2003-12-01.
$0 with Defense Logistics Agency for Night Vision Equipment, Emitted and Reflected Radiation. Signed on 2002-09-09. Completion date: 2002-12-26.
Top industries in this zip code by the number of employees in 2005:
Health Care and Social Assistance: Nursing Care Facilities (100-249 employees: 1 establishment, 10-19 employees: 1 establishment, 5-9 employees: 1 establishment)
Administrative and Support and Waste Management and Remediation Services: Temporary Help Services (100-249: 1)
Health Care and Social Assistance: Residential Mental Retardation Facilities (50-99: 1)
Accommodation and Food Services: Snack and Nonalcoholic Beverage Bars (20-49: 1, 10-19: 1, 5-9: 1, 1-4: 1)
Health Care and Social Assistance: Offices of Physicians (except Mental Health Specialists) (20-49: 1, 10-19: 1, 5-9: 1, 1-4: 1)
Health Care and Social Assistance: Other Residential Care Facilities (20-49: 1, 10-19: 1)
Other Services (except Public Administration): Automotive Body, Paint, and Interior Repair and Maintenance (20-49: 1, 10-19: 1)
Administrative and Support and Waste Management and Remediation Services: Landscaping Services (10-19: 2, 1-4: 7)
Construction: Site Preparation Contractors (10-19: 2, 5-9: 1, 1-4: 1)
People in group quarters in 2010:
118 people in nursing facilities/skilled-nursing facilities
19 people in group homes intended for adults
People in group quarters in 2000:
142 people in nursing homes
4 people in religious group quarters
Fatal accident statistics in 2014:
Fatal accident count: 1
Vehicles involved in fatal accidents: 2
Fatal accidents caused by drunken drivers: 1
Fatalities: 1
Persons involved in fatal accidents: 3
Pedestrians involved in fatal accidents: 0
Fatal accident statistics in 2013:
Fatal accident count: 1
Vehicles involved in fatal accidents: 1
Fatal accidents caused by drunken drivers: 0
Fatalities: 1
Persons involved in fatal accidents: 1
Pedestrians involved in fatal accidents: 1
Home Mortgage Disclosure Act Aggregated Statistics For Year 2009 (Based on 4 full tracts)
A) FHA, FSA/RHS & VA Home Purchase Loans
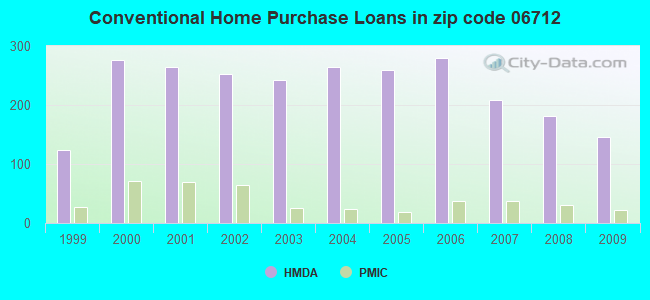
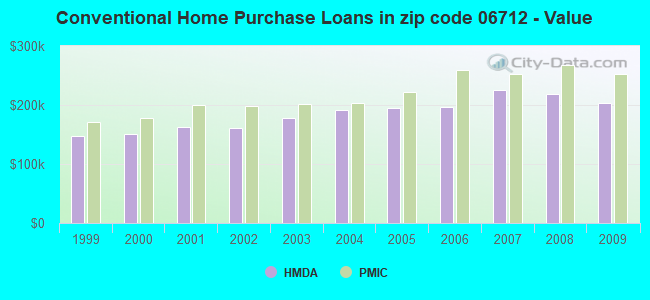
B) Conventional Home Purchase Loans
C) Refinancings
D) Home Improvement Loans
F) Non-occupant Loans on < 5 Family Dwellings (A B C & D)
G) Loans On Manufactured Home Dwelling (A B C & D)
Number
Average Value
Number
Average Value
Number
Average Value
Number
Average Value
Number
Average Value
Number
Average Value
LOANS ORIGINATED
65
$241,498
145
$203,540
505
$208,341
40
$92,142
2
$44,780
4
$43,785
APPLICATIONS APPROVED, NOT ACCEPTED
2
$204,920
24
$188,466
48
$210,621
4
$139,315
2
$99,510
0
$0
APPLICATIONS DENIED
14
$266,970
16
$222,405
163
$218,655
28
$30,198
4
$96,028
0
$0
APPLICATIONS WITHDRAWN
6
$169,548
10
$261,904
113
$226,894
2
$79,610
4
$220,912
0
$0
FILES CLOSED FOR INCOMPLETENESS
2
$392,070
6
$255,017
34
$200,441
0
$0
0
$0
2
$53,735
Aggregated Statistics For Year 2008 (Based on 4 full tracts)
A) FHA, FSA/RHS & VA Home Purchase Loans
B) Conventional Home Purchase Loans
C) Refinancings
D) Home Improvement Loans
F) Non-occupant Loans on < 5 Family Dwellings (A B C & D)
G) Loans On Manufactured Home Dwelling (A B C & D)
Number
Average Value
Number
Average Value
Number
Average Value
Number
Average Value
Number
Average Value
Number
Average Value
LOANS ORIGINATED
32
$227,728
181
$218,075
252
$207,725
69
$59,895
18
$147,003
2
$13,930
APPLICATIONS APPROVED, NOT ACCEPTED
4
$270,668
42
$189,626
71
$215,533
12
$33,336
4
$129,435
2
$27,865
APPLICATIONS DENIED
6
$252,978
22
$249,038
133
$256,730
16
$135,163
4
$151,628
0
$0
APPLICATIONS WITHDRAWN
6
$167,332
8
$248,250
67
$240,203
4
$130,688
2
$69,655
0
$0
FILES CLOSED FOR INCOMPLETENESS
0
$0
8
$191,089
16
$248,861
4
$24,878
0
$0
2
$15,920
Aggregated Statistics For Year 2007 (Based on 4 full tracts)
A) FHA, FSA/RHS & VA Home Purchase Loans
B) Conventional Home Purchase Loans
C) Refinancings
D) Home Improvement Loans
F) Non-occupant Loans on < 5 Family Dwellings (A B C & D)
G) Loans On Manufactured Home Dwelling (A B C & D)
Number
Average Value
Number
Average Value
Number
Average Value
Number
Average Value
Number
Average Value
Number
Average Value
LOANS ORIGINATED
12
$216,556
208
$225,516
353
$194,027
89
$79,468
12
$202,207
12
$37,648
APPLICATIONS APPROVED, NOT ACCEPTED
2
$267,975
22
$196,349
81
$166,383
22
$57,420
4
$168,670
0
$0
APPLICATIONS DENIED
0
$0
69
$204,485
206
$223,174
46
$103,492
12
$102,518
4
$41,298
APPLICATIONS WITHDRAWN
6
$230,577
18
$182,673
65
$214,033
6
$117,753
2
$170,160
0
$0
FILES CLOSED FOR INCOMPLETENESS
0
$0
6
$363,548
20
$257,191
6
$55,898
0
$0
0
$0
Aggregated Statistics For Year 2006 (Based on 4 full tracts)
A) FHA, FSA/RHS & VA Home Purchase Loans
B) Conventional Home Purchase Loans
C) Refinancings
D) Home Improvement Loans
F) Non-occupant Loans on < 5 Family Dwellings (A B C & D)
G) Loans On Manufactured Home Dwelling (A B C & D)
Number
Average Value
Number
Average Value
Number
Average Value
Number
Average Value
Number
Average Value
Number
Average Value
LOANS ORIGINATED
4
$213,788
279
$197,420
446
$172,636
162
$76,594
24
$136,112
8
$26,121
APPLICATIONS APPROVED, NOT ACCEPTED
0
$0
24
$210,065
81
$182,058
18
$38,544
0
$0
0
$0
APPLICATIONS DENIED
0
$0
54
$190,405
204
$194,533
54
$97,133
14
$258,568
8
$46,315
APPLICATIONS WITHDRAWN
0
$0
12
$218,261
166
$200,913
16
$70,648
0
$0
0
$0
FILES CLOSED FOR INCOMPLETENESS
0
$0
16
$277,502
46
$219,221
18
$94,801
0
$0
0
$0
Aggregated Statistics For Year 2005 (Based on 4 full tracts)
A) FHA, FSA/RHS & VA Home Purchase Loans
B) Conventional Home Purchase Loans
C) Refinancings
D) Home Improvement Loans
E) Loans on Dwellings For 5+ Families
F) Non-occupant Loans on < 5 Family Dwellings (A B C & D)
G) Loans On Manufactured Home Dwelling (A B C & D)
Number
Average Value
Number
Average Value
Number
Average Value
Number
Average Value
Number
Average Value
Number
Average Value
Number
Average Value
LOANS ORIGINATED
6
$188,187
259
$195,086
590
$176,961
105
$84,809
2
$373,165
6
$202,068
6
$42,790
APPLICATIONS APPROVED, NOT ACCEPTED
6
$243,468
30
$219,916
117
$175,581
10
$21,200
0
$0
2
$275,855
4
$37,815
APPLICATIONS DENIED
0
$0
26
$254,412
240
$184,372
48
$72,114
2
$522,155
2
$147,780
0
$0
APPLICATIONS WITHDRAWN
2
$244,795
38
$208,194
236
$193,322
20
$154,776
0
$0
8
$225,934
2
$59,705
FILES CLOSED FOR INCOMPLETENESS
0
$0
10
$210,768
101
$232,148
6
$50,618
0
$0
0
$0
0
$0
Aggregated Statistics For Year 2004 (Based on 4 full tracts)
A) FHA, FSA/RHS & VA Home Purchase Loans
B) Conventional Home Purchase Loans
C) Refinancings
D) Home Improvement Loans
E) Loans on Dwellings For 5+ Families
F) Non-occupant Loans on < 5 Family Dwellings (A B C & D)
G) Loans On Manufactured Home Dwelling (A B C & D)
Number
Average Value
Number
Average Value
Number
Average Value
Number
Average Value
Number
Average Value
Number
Average Value
Number
Average Value
LOANS ORIGINATED
12
$201,096
265
$191,041
572
$164,158
111
$67,278
2
$320,190
18
$147,948
0
$0
APPLICATIONS APPROVED, NOT ACCEPTED
0
$0
30
$221,489
123
$158,262
16
$87,856
0
$0
4
$146,488
0
$0
APPLICATIONS DENIED
4
$201,065
26
$173,264
188
$195,237
53
$65,910
0
$0
10
$135,513
4
$29,852
APPLICATIONS WITHDRAWN
6
$185,420
24
$172,990
204
$201,828
22
$53,855
0
$0
4
$215,265
2
$246,300
FILES CLOSED FOR INCOMPLETENESS
0
$0
8
$226,385
83
$192,009
2
$124,390
0
$0
0
$0
0
$0
Aggregated Statistics For Year 2003 (Based on 4 full tracts)
A) FHA, FSA/RHS & VA Home Purchase Loans
B) Conventional Home Purchase Loans
C) Refinancings
D) Home Improvement Loans
F) Non-occupant Loans on < 5 Family Dwellings (A B C & D)
Number
Average Value
Number
Average Value
Number
Average Value
Number
Average Value
Number
Average Value
LOANS ORIGINATED
16
$224,599
242
$177,760
1,441
$154,240
59
$48,952
8
$80,305
APPLICATIONS APPROVED, NOT ACCEPTED
0
$0
26
$174,496
214
$148,162
26
$23,822
2
$39,805
APPLICATIONS DENIED
0
$0
24
$141,947
271
$164,475
38
$44,855
8
$166,499
APPLICATIONS WITHDRAWN
2
$154,240
44
$166,084
216
$172,317
12
$21,362
2
$206,890
FILES CLOSED FOR INCOMPLETENESS
0
$0
6
$206,113
42
$147,449
2
$22,885
0
$0
Aggregated Statistics For Year 2002 (Based on 4 full tracts)
A) FHA, FSA/RHS & VA Home Purchase Loans
B) Conventional Home Purchase Loans
C) Refinancings
D) Home Improvement Loans
F) Non-occupant Loans on < 5 Family Dwellings (A B C & D)
Number
Average Value
Number
Average Value
Number
Average Value
Number
Average Value
Number
Average Value
LOANS ORIGINATED
32
$161,534
252
$160,711
767
$151,184
69
$26,531
14
$159,009
APPLICATIONS APPROVED, NOT ACCEPTED
2
$237,435
20
$181,067
117
$123,837
32
$29,448
2
$194,045
APPLICATIONS DENIED
0
$0
12
$163,890
153
$145,152
38
$39,887
0
$0
APPLICATIONS WITHDRAWN
6
$156,577
24
$182,155
119
$150,105
10
$29,072
2
$84,585
FILES CLOSED FOR INCOMPLETENESS
0
$0
6
$160,338
38
$165,840
0
$0
0
$0
Aggregated Statistics For Year 2001 (Based on 4 full tracts)
A) FHA, FSA/RHS & VA Home Purchase Loans
B) Conventional Home Purchase Loans
C) Refinancings
D) Home Improvement Loans
F) Non-occupant Loans on < 5 Family Dwellings (A B C & D)
Number
Average Value
Number
Average Value
Number
Average Value
Number
Average Value
Number
Average Value
LOANS ORIGINATED
28
$166,626
264
$162,857
553
$142,225
73
$27,174
2
$51,230
APPLICATIONS APPROVED, NOT ACCEPTED
0
$0
28
$153,639
85
$107,826
14
$23,589
2
$143,295
APPLICATIONS DENIED
2
$133,000
20
$118,878
175
$107,243
54
$26,455
4
$41,795
APPLICATIONS WITHDRAWN
2
$172,150
18
$95,508
121
$105,248
12
$47,318
0
$0
FILES CLOSED FOR INCOMPLETENESS
2
$128,075
8
$133,582
34
$153,236
0
$0
0
$0
Aggregated Statistics For Year 2000 (Based on 4 full tracts)
A) FHA, FSA/RHS & VA Home Purchase Loans
B) Conventional Home Purchase Loans
C) Refinancings
D) Home Improvement Loans
E) Loans on Dwellings For 5+ Families
F) Non-occupant Loans on < 5 Family Dwellings (A B C & D)
Number
Average Value
Number
Average Value
Number
Average Value
Number
Average Value
Number
Average Value
Number
Average Value
LOANS ORIGINATED
44
$145,728
276
$151,418
141
$96,953
67
$24,447
0
$0
6
$96,588
APPLICATIONS APPROVED, NOT ACCEPTED
4
$148,488
34
$154,931
36
$122,280
16
$27,371
0
$0
0
$0
APPLICATIONS DENIED
0
$0
53
$154,519
123
$93,327
38
$20,438
0
$0
2
$143,295
APPLICATIONS WITHDRAWN
6
$132,345
20
$142,852
79
$78,045
10
$81,692
2
$354,670
0
$0
FILES CLOSED FOR INCOMPLETENESS
0
$0
2
$59,705
34
$117,711
0
$0
0
$0
2
$104,485
Aggregated Statistics For Year 1999 (Based on 2 full tracts)
A) FHA, FSA/RHS & VA Home Purchase Loans
B) Conventional Home Purchase Loans
C) Refinancings
D) Home Improvement Loans
E) Loans on Dwellings For 5+ Families
F) Non-occupant Loans on < 5 Family Dwellings (A B C & D)
Detailed PMIC statistics for the following Tracts:3471.00
, 3472.00
2002 - 2018 National Fire Incident Reporting System (NFIRS) incidents
According to the data from the years 2002 - 2018 the average number of fires per year is 18. The highest number of fires - 37 took place in 2015, and the least - 8 in 2018. The data has a dropping trend.
When looking into fire subcategories, the most reports belonged to: Structure Fires (40.1%), and Mobile Property/Vehicle Fires (26.1%).
Fire incident types reported to NFIRS in Zip Code 06712


 Nearest zip codes: 06705, 06706, 06410, 06444, 06770, 06524.


 According to the data from the years 2002 - 2018 the average number of fires per year is 18. The highest number of fires - 37 took place in 2015, and the least - 8 in 2018. The data has a dropping trend.
 When looking into fire subcategories, the most reports belonged to: Structure Fires (40.1%), and Mobile Property/Vehicle Fires (26.1%).