Estimated zip code population in 2022: 8,240 Zip code population in 2010: 7,858 Zip code population in 2000: 8,130
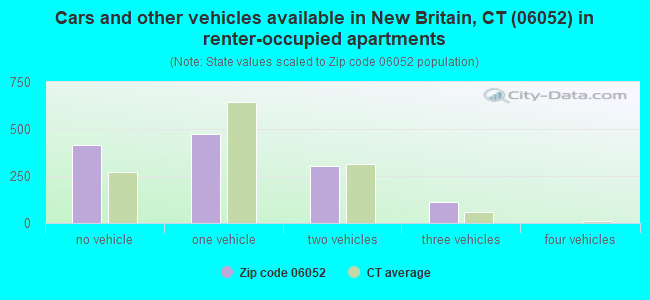
Houses and condos: 3,793 Renter-occupied apartments: 1,305
% of renters here:
39%
State:
34%
March 2022 cost of living index in zip code 06052: 103.5 (near average, U.S. average is 100)
Land area: 2.6 sq. mi. Water area: 0.0 sq. mi.
Population density: 3,231 people per square mile
(average).
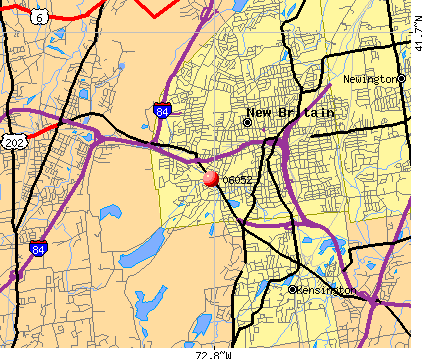
OSM Map
Google Map
MSN Map
OSM Map
General Map
Google Map
MSN Map
OSM Map
Google Map
MSN Map
OSM Map
Google Map
MSN Map
Please wait while loading the map...
Real estate property taxes paid for housing units in 2022:
This zip code:
2.7% ($6,303)
Connecticut:
1.8% ($6,189)
Median real estate property taxes paid for housing units with mortgages in 2022: $6,229 (2.6%) Median real estate property taxes paid for housing units with no mortgage in 2022: $6,516 (3.0%)
Averages for the 2020 tax year for zip code 06052, filed in 2021:
Average Adjusted Gross Income (AGI) in 2020: $56,509 (Individual Income Tax Returns)
Here:
$56,509
State:
$105,931
Salary/wage: $49,116 (reported on 83.8% of returns)
Here:
$49,116
State:
$83,540
(% of AGI for various income ranges: 1102.6% for AGIs below $25k, 3605.4% for AGIs $25k-50k, 6706.7% for AGIs $50k-75k, 9241.1% for AGIs $75k-100k, 18300.0% for AGIs $100k-200k, 52467.5% for AGIs over 200k)
Taxable interest for individuals: $1,284 (reported on 23.0% of returns)
This zip code:
$1,284
Connecticut:
$3,402
(% of AGI for various income ranges: 7.3% for AGIs below $25k, 9.1% for AGIs $25k-50k, 40.7% for AGIs $50k-75k, 38.1% for AGIs $75k-100k, 247.2% for AGIs $100k-200k, 380.0% for AGIs over 200k)
Ordinary dividends: $5,949 (reported on 16.4% of returns)
Here:
$5,949
State:
$12,683
(% of AGI for various income ranges: 19.0% for AGIs below $25k, 29.8% for AGIs $25k-50k, 96.3% for AGIs $50k-75k, 149.3% for AGIs $75k-100k, 604.0% for AGIs $100k-200k, 3100.0% for AGIs over 200k)
Net capital gain/loss in AGI: +$7,227 (reported on 13.8% of returns)
Here:
+$7,227
State:
+$44,158
(% of AGI for various income ranges: 13.2% for AGIs below $25k, 9.9% for AGIs $25k-50k, 51.1% for AGIs $50k-75k, 172.2% for AGIs $75k-100k, 616.4% for AGIs $100k-200k, 4375.0% for AGIs over 200k)
Profit/loss from business: +$16,684 (reported on 13.6% of returns)
Here:
+$16,684
State:
+$22,988
(% of AGI for various income ranges: 85.1% for AGIs below $25k, 124.2% for AGIs $25k-50k, 219.3% for AGIs $50k-75k, 148.9% for AGIs $75k-100k, 747.6% for AGIs $100k-200k, 10292.5% for AGIs over 200k)
Taxable individual retirement arrangement distribution: $15,106 (reported on 8.0% of returns)
06052:
$15,106
Connecticut:
$22,031
(% of AGI for various income ranges: 38.8% for AGIs below $25k, 50.1% for AGIs $25k-50k, 144.3% for AGIs $50k-75k, 293.7% for AGIs $75k-100k, 1068.0% for AGIs $100k-200k)
Self-employed (Keogh) retirement plans: $14,500 (reported on 0.7% of returns)
06052:
$14,500
Connecticut:
$29,016
(% of AGI for various income ranges: 174.0% for AGIs $100k-200k)
Total itemized deductions: $25,846 (reported on 9.2% of returns)
Here:
$25,846
State:
$37,613
(% of AGI for various income ranges: 68.6% for AGIs below $25k, 111.2% for AGIs $25k-50k, 451.3% for AGIs $50k-75k, 503.3% for AGIs $75k-100k, 1252.0% for AGIs $100k-200k, 3362.5% for AGIs over 200k)
Charity contributions: $5,683 (reported on 7.0% of returns)
Here:
$5,683
State:
$13,557
(% of AGI for various income ranges: 15.5% for AGIs $25k-50k, 68.0% for AGIs $50k-75k, 60.0% for AGIs $75k-100k, 262.8% for AGIs $100k-200k, 905.0% for AGIs over 200k)
Taxes paid: $8,562 (reported on 9.2% of returns)
06052:
$8,562
State:
$9,096
(% of AGI for various income ranges: 16.6% for AGIs below $25k, 37.0% for AGIs $25k-50k, 165.0% for AGIs $50k-75k, 226.7% for AGIs $75k-100k, 384.8% for AGIs $100k-200k, 835.0% for AGIs over 200k)
Earned income credit: $2,183 (reported on 16.9% of returns)
Here:
$2,183
State:
$2,059
(% of AGI for various income ranges: 92.0% for AGIs below $25k, 64.6% for AGIs $25k-50k)
Percentage of individuals using paid preparers for their 2020 taxes: 92.7%
Here:
93%
State:
93%
(% for various income ranges: 91.6% for AGIs below $25k, 93.5% for AGIs $25k-50k, 93.2% for AGIs $50k-75k, 94.7% for AGIs $75k-100k, 91.8% for AGIs $100k-200k, 90.9% for AGIs over 200k)
Averages for the 2012 tax year for zip code 06052, filed in 2013:
Average Adjusted Gross Income (AGI) in 2012: $55,736 (Individual Income Tax Returns)
Here:
$55,736
State:
$93,290
Salary/wage: $47,213 (reported on 84.1% of returns)
Here:
$47,213
State:
$73,117
(% of AGI for various income ranges: 73.9% for AGIs below $25k, 83.6% for AGIs $25k-50k, 77.9% for AGIs $50k-75k, 74.2% for AGIs $75k-100k, 70.1% for AGIs $100k-200k, 52.9% for AGIs over 200k)
Taxable interest for individuals: $927 (reported on 39.2% of returns)
This zip code:
$927
Connecticut:
$2,530
(% of AGI for various income ranges: 0.8% for AGIs below $25k, 0.6% for AGIs $25k-50k, 0.6% for AGIs $50k-75k, 0.6% for AGIs $75k-100k, 0.6% for AGIs $100k-200k, 0.8% for AGIs over 200k)
Ordinary dividends: $4,854 (reported on 22.2% of returns)
Here:
$4,854
State:
$10,909
(% of AGI for various income ranges: 1.7% for AGIs below $25k, 1.1% for AGIs $25k-50k, 1.5% for AGIs $50k-75k, 1.8% for AGIs $75k-100k, 2.1% for AGIs $100k-200k, 3.0% for AGIs over 200k)
Net capital gain/loss in AGI: +$5,197 (reported on 15.7% of returns)
Here:
+$5,197
State:
+$34,090
(% of AGI for various income ranges: 0.2% for AGIs $25k-50k, 0.5% for AGIs $50k-75k, 0.9% for AGIs $75k-100k, 1.5% for AGIs $100k-200k, 4.5% for AGIs over 200k)
Profit/loss from business: +$18,166 (reported on 13.1% of returns)
Here:
+$18,166
State:
+$22,741
(% of AGI for various income ranges: 6.8% for AGIs below $25k, 2.3% for AGIs $25k-50k, 2.9% for AGIs $50k-75k, 4.5% for AGIs $75k-100k, 3.4% for AGIs $100k-200k, 6.8% for AGIs over 200k)
Taxable individual retirement arrangement distribution: $15,837 (reported on 10.7% of returns)
06052:
$15,837
Connecticut:
$19,976
(% of AGI for various income ranges: 3.5% for AGIs below $25k, 2.2% for AGIs $25k-50k, 1.3% for AGIs $50k-75k, 3.0% for AGIs $75k-100k, 7.2% for AGIs $100k-200k)
Self-employment retirement plans: $28,867 (reported on 0.8% of returns)
06052:
$28,867
Connecticut:
$24,004
Total itemized deductions: $22,294 (22% of AGI, reported on 35.8% of returns)
Here:
$22,294
State:
$33,239
Here:
21.6% of AGI
State:
18.9% of AGI
(% of AGI for various income ranges: 9.7% for AGIs below $25k, 11.2% for AGIs $25k-50k, 15.5% for AGIs $50k-75k, 17.3% for AGIs $75k-100k, 17.6% for AGIs $100k-200k, 11.9% for AGIs over 200k)
Charity contributions: $3,158 (reported on 29.2% of returns)
Here:
$3,158
State:
$4,947
(% of AGI for various income ranges: 0.4% for AGIs below $25k, 0.9% for AGIs $25k-50k, 1.4% for AGIs $50k-75k, 1.4% for AGIs $75k-100k, 2.3% for AGIs $100k-200k, 2.5% for AGIs over 200k)
Taxes paid: $11,095 (reported on 35.8% of returns)
06052:
$11,095
State:
$17,397
(% of AGI for various income ranges: 3.4% for AGIs below $25k, 4.4% for AGIs $25k-50k, 6.4% for AGIs $50k-75k, 8.8% for AGIs $75k-100k, 9.3% for AGIs $100k-200k, 7.9% for AGIs over 200k)
Earned income credit: $2,288 (reported on 17.5% of returns)
Here:
$2,288
State:
$2,053
(% of AGI for various income ranges: 6.4% for AGIs below $25k, 1.0% for AGIs $25k-50k)
Percentage of individuals using paid preparers for their 2012 taxes: 52.5%
Here:
52%
State:
55%
(% for various income ranges: 46.5% for AGIs below $25k, 49.0% for AGIs $25k-50k, 54.4% for AGIs $50k-75k, 63.9% for AGIs $75k-100k, 63.2% for AGIs $100k-200k, 87.5% for AGIs over 200k)
Averages for the 2004 tax year for zip code 06052, filed in 2005:
Average Adjusted Gross Income (AGI) in 2004: $49,139 (Individual Income Tax Returns)
Here:
$49,139
State:
$73,265
Salary/wage: $42,587 (reported on 82.3% of returns)
Here:
$42,587
State:
$62,030
(% of AGI for various income ranges: 117.8% for AGIs below $10k, 78.5% for AGIs $10k-25k, 81.7% for AGIs $25k-50k, 81.1% for AGIs $50k-75k, 78.5% for AGIs $75k-100k, 54.8% for AGIs over 100k)
Taxable interest for individuals: $1,422 (reported on 56.7% of returns)
This zip code:
$1,422
Connecticut:
$2,287
(% of AGI for various income ranges: 6.8% for AGIs below $10k, 2.0% for AGIs $10k-25k, 1.3% for AGIs $25k-50k, 1.2% for AGIs $50k-75k, 1.4% for AGIs $75k-100k, 1.9% for AGIs over 100k)
Taxable dividends: $4,607 (reported on 30.0% of returns)
Here:
$4,607
State:
$5,735
(% of AGI for various income ranges: 7.2% for AGIs below $10k, 2.4% for AGIs $10k-25k, 1.4% for AGIs $25k-50k, 1.6% for AGIs $50k-75k, 1.4% for AGIs $75k-100k, 4.7% for AGIs over 100k)
Net capital gain/loss: +$8,460 (reported on 21.6% of returns)
Here:
+$8,460
State:
+$23,694
(% of AGI for various income ranges: -3.6% for AGIs below $10k, 0.1% for AGIs $10k-25k, 0.8% for AGIs $25k-50k, 0.6% for AGIs $50k-75k, 2.7% for AGIs $75k-100k, 8.3% for AGIs over 100k)
Profit/loss from business: +$23,136 (reported on 11.6% of returns)
Here:
+$23,136
State:
+$20,783
(% of AGI for various income ranges: 12.4% for AGIs below $10k, 3.7% for AGIs $10k-25k, 3.0% for AGIs $25k-50k, 2.6% for AGIs $50k-75k, 4.4% for AGIs $75k-100k, 8.8% for AGIs over 100k)
IRA payment deduction: $3,075 (reported on 2.4% of returns)
06052:
$3,075
Connecticut:
$3,216
(% of AGI for various income ranges: 0.2% for AGIs $10k-25k, 0.2% for AGIs $25k-50k, 0.2% for AGIs $50k-75k, 0.1% for AGIs $75k-100k, 0.1% for AGIs over 100k)
Self-employed pension: $14,360 (reported on 1.3% of returns)
Here:
$14,360
Connecticut:
$17,335
Total itemized deductions: $18,982 (22% of AGI, reported on 38.7% of returns)
Here:
$18,982
State:
$24,919
Here:
21.9% of AGI
State:
18.6% of AGI
(% of AGI for various income ranges: 25.0% for AGIs below $10k, 10.8% for AGIs $10k-25k, 13.3% for AGIs $25k-50k, 16.4% for AGIs $50k-75k, 17.2% for AGIs $75k-100k, 14.7% for AGIs over 100k)
Charity contributions deductions: $3,087 (3% of AGI, reported on 35.3% of returns)
Here:
$3,087
State:
$3,762
Here:
3.4% of AGI
State:
2.7% of AGI
(% of AGI for various income ranges: 1.1% for AGIs below $10k, 0.8% for AGIs $10k-25k, 1.3% for AGIs $25k-50k, 1.9% for AGIs $50k-75k, 2.0% for AGIs $75k-100k, 3.3% for AGIs over 100k)
Total tax: $7,872 (reported on 78.1% of returns)
06052:
$7,872
State:
$15,148
(% of AGI for various income ranges: 3.6% for AGIs below $10k, 4.2% for AGIs $10k-25k, 7.9% for AGIs $25k-50k, 10.0% for AGIs $50k-75k, 11.1% for AGIs $75k-100k, 18.9% for AGIs over 100k)
Earned income credit: $1,523 (reported on 12.1% of returns)
Here:
$1,523
State:
$1,570
Percentage of individuals using paid preparers for their 2004 taxes: 57.2%
Here:
57%
State:
59%
(% for various income ranges: 50.2% for AGIs below $10k, 55.9% for AGIs $10k-25k, 55.2% for AGIs $25k-50k, 58.8% for AGIs $50k-75k, 64.9% for AGIs $75k-100k, 69.3% for AGIs over 100k)
Likely homosexual households (counted as self-reported same-sex unmarried-partner households)
Lesbian couples: 0.8% of all households
Gay men: 0.2% of all households
Household received Food Stamps/SNAP in the past 12 months: 965 Household did not receive Food Stamps/SNAP in the past 12 months: 2,410
Women who had a birth in the past 12 months: 22 (21 now married, 0 unmarried) Women who did not have a birth in the past 12 months: 1,921 (809 now married, 1,103 unmarried)
Housing units in zip code 06052 with a mortgage: 1,411 (149 second mortgage, 108 both second mortgage and home equity loan) Houses without a mortgage: 71
Median monthly owner costs for units with a mortgage: $1,913 Median monthly owner costs for units without a mortgage: $861
Residents with income below the poverty level in 2022:
This zip code:
12.3%
Whole state:
9.8%
Residents with income below 50% of the poverty level in 2022:
This zip code:
5.7%
Whole state:
4.8%
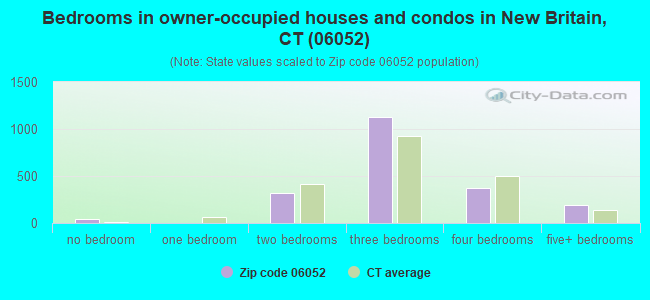
Median number of rooms in houses and condos:
Here:
6.6
State:
6.5
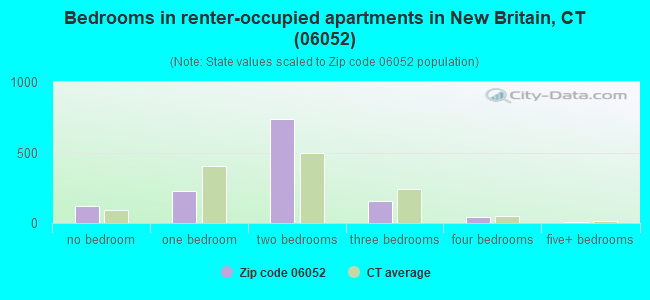
Median number of rooms in apartments:
Here:
4.5
State:
4.0
Notable locations in this zip code not listed on our city pages
Notable locations in zip code 06052: New Britain Museum of American Art Library (A), New Britain Museum of American Art (B), New Britain Fire Department Station 4 (C). Display/hide their locations on the map
Churches in zip code 06052 include: First Church of Christ (A), First Polish Baptist Church (B), Mision Hispana Episcopal (C), New Born Church of God (D), Saint George Greek Orthodox Church (E), Saint Johns Evangelical Lutheran Church (F), Saint Maurice Roman Catholic Church (G), Temple B'Nai Israel (H). Display/hide their locations on the map
In group quarters: 135 (-1 institutionalized population)
Size of family households: 983 2-persons, 397 3-persons, 395 4-persons, 145 5-persons, 110 6-persons, 33 7-or-more-persons
Size of nonfamily households: 1,062 1-person, 196 2-persons, 33 3-persons
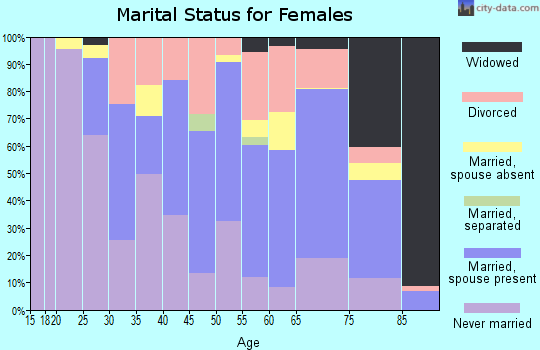
850 married couples with children.
742 single-parent households (35 men, 707 women).
64.6% of residents of 06052 zip code speak English at home.
28.4% of residents speak Spanish at home (64% very well, 20% well, 11% not well, 5% not at all).
6.1% of residents speak other Indo-European language at home (73% very well, 22% well, 5% not well).
0.9% of residents speak Asian or Pacific Island language at home (56% very well, 14% well, 31% not well).
0.8% of residents speak other language at home (100% not well).
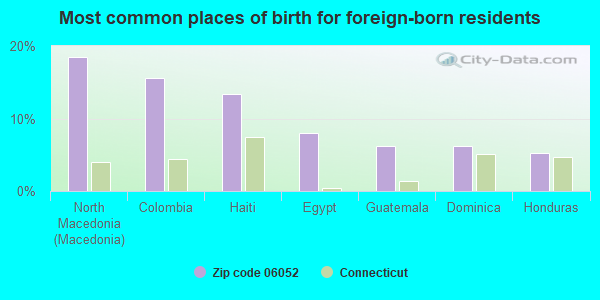
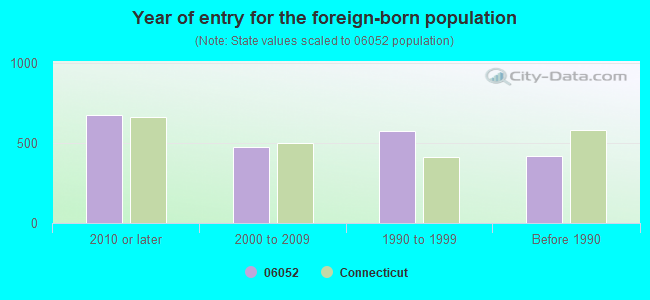
Foreign born population: 1,236 (15.0%) (61.3% of them are naturalized citizens)
Facilities with environmental interests located in this zip code:
ACME-MONACO CORP (75 WINCHELL DRIVE in NEW BRITAIN, CT)
National Pollutant Discharge Elimination System NON-MAJOR (Tracking pollutant discharge elimination systems) - permit Small Quantity Generators, between 100 kg and 1000 kg of hazardous waste/month (Resource Conservation and Recovery Act (tracking hazardous waste)) - notification (Resource Conservation and Recovery Act (tracking hazardous waste)) TRI REPORTER (Tracking of toxic chemicals releasing facilities) Business SIC classification: HARDWARE; WIRE SPRINGS Business NAICS classification: SPRING (HEAVY GAUGE) MANUFACTURING. Organizations: OWNERNAME (CONTACT/OWNER)
, JOHN KARABIN (CONTACT/OWNER)
Alternative names: MONACO SPRING INC
DIXWELL ASSOC DBA GATEWAY CROS (I HARTFORD SQUARE in NEW BRITAIN, CT)
AIR MINOR (AIRS/AFS) CRITERIA AND HAZARDOUS AIR POLLUTANT INVENTORY (Inventory of air pollution sources) Business SIC classification: OPERATORS OF NONRESIDENTIAL BUILDINGS Alternative names: DIXWELL ASSOC DBA GATEWAY CROSSINGS
AMODIO GATEWAY CROSSINGS (1 HARTFORD SQ in NEW BRITAIN, CT)
COMPLIANCE ACTIVITY (Tracking inspections of insecticide, fungicide, and rodenticide, and toxic substances)
CT LIGHT & POWER NEW BRITAIN AREA WORK CENTER (66 CURTIS ST in NEW BRITAIN, CT)
Conditionally Exempt Small Quantity Generators, less than 100 kg/month of hazardous waste (Resource Conservation and Recovery Act (tracking hazardous waste)) - notification USED OIL PROGRAM (Resource Conservation and Recovery Act (tracking hazardous waste)) Alternative names: NEW BRITAIN REGIONAL SEV CENTER
Housing units lacking complete plumbing facilities: 0.9% Housing units lacking complete kitchen facilities: 2.7%
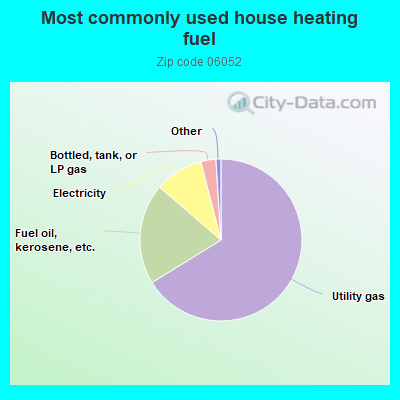
66.2%Utility gas
20.1%Fuel oil, kerosene, etc.
9.7%Electricity
3.0%Bottled, tank, or LP gas
Population in 1990: 8,798.
Place of birth for U.S.-born residents:
This state: 4,682
Northeast: 842
Midwest: 250
South: 227
West: 92
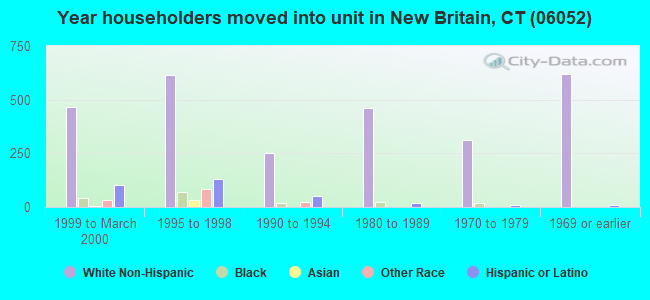
60% of the 06052 zip code residents lived in the same house 5 years ago. Out of people who lived in different houses, 79% lived in this county. Out of people who lived in different counties, 50% lived in Connecticut.
91% of the 06052 zip code residents lived in the same house 1 year ago. Out of people who lived in different houses, 60% moved from this county. Out of people who lived in different houses, 16% moved from different county within same state. Out of people who lived in different houses, 14% moved from different state.
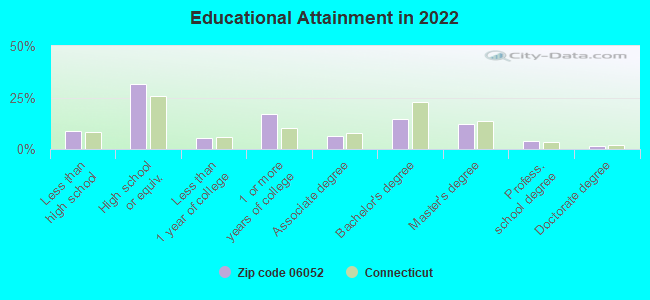
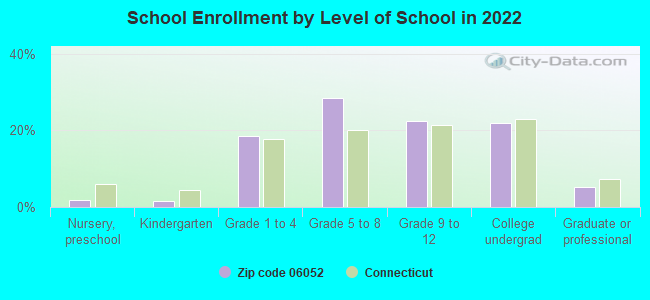
Private vs. public school enrollment:
Students in private schools in grades 1 to 8 (elementary and middle school): 60
Here:
6.9%
Connecticut:
9.5%
Students in private schools in grades 9 to 12 (high school): 89
Here:
20.7%
Connecticut:
12.9%
Students in private undergraduate colleges: 202
Here:
47.5%
Connecticut:
35.5%
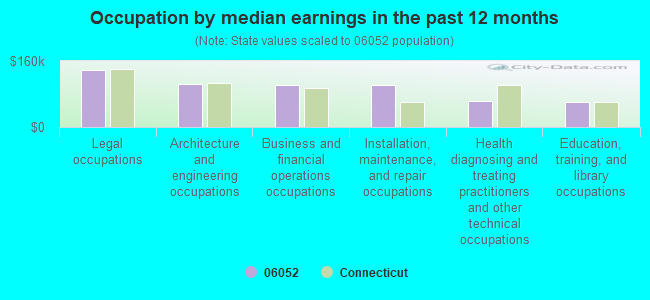
Occupation by median earnings in the past 12 months ($)
138,547Legal occupations
103,864Architecture and engineering occupations
100,950Business and financial operations occupations
100,850Installation, maintenance, and repair occupations
63,305Health diagnosing and treating practitioners and other technical occupations
60,428Education, training, and library occupations
Companies with federal contracts located in this zip code:
AMODIO WORLD-WIDE MOVING & STO (1 HARTFORD SQ in NEW BRITAIN, CT; small business) : $34,287 in 2 contractsin 2004
$21,980 with Air Force for Other Housekeeping Services. Taking place in MA. Signed on 2004-11-18. Completion date: 2004-12-07.
$12,307 with Public Buildings Service for . Signed on 2004-10-26. Completion date: 2004-10-31.
NEW ENGLAND AMERICAN COLLEGE O (100 GRAND ST in NEW BRITAIN, CT) : $15,000 in 3 contractsfrom 2002 to 2005
$5,000 with Army for Technical Assistance. Signed on 2005-02-01. Completion date: 2005-04-15.
$5,000, same as above.Signed on 2003-09-03. Completion date: 2003-12-31.
$5,000, same as above.Signed on 2002-09-25. Completion date: 2002-11-08.
TILCON CONNECTICUT INC (BLACK ROCK AVENUE in NEW BRITAIN, CT) : $7,022 in 2 contractsin 2005
$3,511 with U.S. Army Corps of Engineers - civil program financing only for Miscellaneous Construction Materials. Signed on 2005-09-21. Completion date: 2005-08-15.
$3,511 with Army for Miscellaneous Construction Materials. Signed on 2005-09-21. Completion date: 2005-08-15.
Top industries in this zip code by the number of employees in 2005:
Health Care and Social Assistance: General Medical and Surgical Hospitals (over 1000 employees: 1 establishment)
Health Care and Social Assistance: Other Residential Care Facilities (250-499: 1)
Health Care and Social Assistance: Nursing Care Facilities (100-249: 2)
Health Care and Social Assistance: Offices of Physicians (except Mental Health Specialists) (20-49: 3, 10-19: 6, 5-9: 11, 1-4: 16)
Health Care and Social Assistance: Outpatient Mental Health and Substance Abuse Centers (20-49: 5)
Health Care and Social Assistance: Home Health Care Services (100-249: 1)
Health Care and Social Assistance: Diagnostic Imaging Centers (100-249: 1)
Health Care and Social Assistance: Offices of Dentists (20-49: 1, 10-19: 3, 5-9: 3, 1-4: 3)
Utilities: Electric Power Distribution (50-99: 1)
People in group quarters in 2010:
27 people in group homes intended for adults
14 people in residential treatment centers for juveniles (non-correctional)
9 people in group homes for juveniles (non-correctional)
People in group quarters in 2000:
336 people in nursing homes
81 people in other nonhousehold living situations
12 people in other noninstitutional group quarters
Fatal accident statistics in 2013:
Fatal accident count: 1
Vehicles involved in fatal accidents: 1
Fatal accidents caused by drunken drivers: 0
Fatalities: 1
Persons involved in fatal accidents: 1
Pedestrians involved in fatal accidents: 0
Fatal accident statistics in 2012:
Fatal accident count: 1
Vehicles involved in fatal accidents: 1
Fatal accidents caused by drunken drivers: 1
Fatalities: 1
Persons involved in fatal accidents: 2
Pedestrians involved in fatal accidents: 0
Home Mortgage Disclosure Act Aggregated Statistics For Year 2009 (Based on 4 full and 2 partial tracts)
A) FHA, FSA/RHS & VA Home Purchase Loans
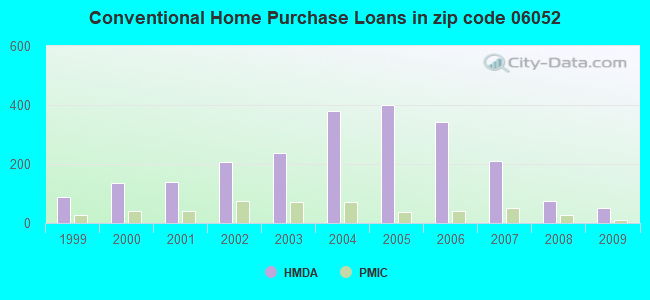
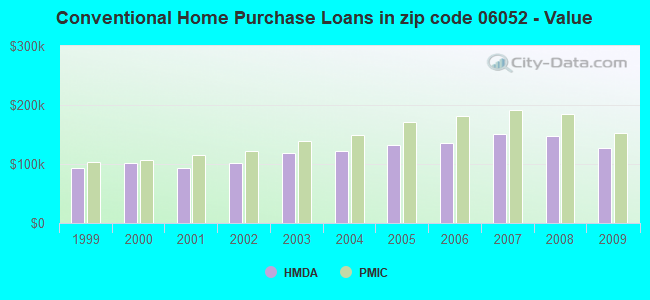
B) Conventional Home Purchase Loans
C) Refinancings
D) Home Improvement Loans
E) Loans on Dwellings For 5+ Families
F) Non-occupant Loans on < 5 Family Dwellings (A B C & D)
Number
Average Value
Number
Average Value
Number
Average Value
Number
Average Value
Number
Average Value
Number
Average Value
LOANS ORIGINATED
91
$167,423
50
$127,312
212
$169,030
36
$90,714
6
$219,313
15
$130,569
APPLICATIONS APPROVED, NOT ACCEPTED
2
$187,305
0
$0
38
$154,510
2
$24,905
0
$0
0
$0
APPLICATIONS DENIED
11
$182,399
20
$171,458
140
$172,382
27
$56,324
0
$0
26
$170,877
APPLICATIONS WITHDRAWN
12
$195,420
6
$79,013
73
$157,347
2
$8,040
0
$0
2
$32,880
FILES CLOSED FOR INCOMPLETENESS
0
$0
2
$56,280
22
$172,548
0
$0
0
$0
0
$0
Aggregated Statistics For Year 2008 (Based on 4 full and 2 partial tracts)
A) FHA, FSA/RHS & VA Home Purchase Loans
B) Conventional Home Purchase Loans
C) Refinancings
D) Home Improvement Loans
E) Loans on Dwellings For 5+ Families
F) Non-occupant Loans on < 5 Family Dwellings (A B C & D)
Number
Average Value
Number
Average Value
Number
Average Value
Number
Average Value
Number
Average Value
Number
Average Value
LOANS ORIGINATED
66
$193,985
76
$146,956
159
$154,576
45
$42,326
4
$4,127,275
37
$129,982
APPLICATIONS APPROVED, NOT ACCEPTED
10
$200,451
19
$139,482
29
$168,663
4
$28,892
0
$0
7
$118,200
APPLICATIONS DENIED
32
$205,536
25
$208,049
127
$187,695
37
$53,008
4
$129,568
20
$200,156
APPLICATIONS WITHDRAWN
17
$200,358
13
$177,595
42
$168,536
4
$73,138
0
$0
4
$172,100
FILES CLOSED FOR INCOMPLETENESS
4
$199,260
2
$86,335
15
$185,597
5
$144,792
0
$0
2
$188,940
Aggregated Statistics For Year 2007 (Based on 4 full and 2 partial tracts)
A) FHA, FSA/RHS & VA Home Purchase Loans
B) Conventional Home Purchase Loans
C) Refinancings
D) Home Improvement Loans
E) Loans on Dwellings For 5+ Families
F) Non-occupant Loans on < 5 Family Dwellings (A B C & D)
Number
Average Value
Number
Average Value
Number
Average Value
Number
Average Value
Number
Average Value
Number
Average Value
LOANS ORIGINATED
40
$193,568
209
$150,586
261
$152,049
80
$56,045
4
$470,552
45
$121,758
APPLICATIONS APPROVED, NOT ACCEPTED
2
$148,740
43
$175,493
64
$147,807
16
$86,454
0
$0
5
$133,142
APPLICATIONS DENIED
11
$225,643
81
$180,346
198
$162,991
75
$78,546
0
$0
40
$151,086
APPLICATIONS WITHDRAWN
0
$0
26
$169,009
115
$146,674
12
$58,053
2
$537,210
12
$151,128
FILES CLOSED FOR INCOMPLETENESS
0
$0
13
$180,602
35
$177,328
2
$49,815
0
$0
6
$151,935
Aggregated Statistics For Year 2006 (Based on 4 full and 2 partial tracts)
A) FHA, FSA/RHS & VA Home Purchase Loans
B) Conventional Home Purchase Loans
C) Refinancings
D) Home Improvement Loans
E) Loans on Dwellings For 5+ Families
F) Non-occupant Loans on < 5 Family Dwellings (A B C & D)
G) Loans On Manufactured Home Dwelling (A B C & D)
Number
Average Value
Number
Average Value
Number
Average Value
Number
Average Value
Number
Average Value
Number
Average Value
Number
Average Value
LOANS ORIGINATED
43
$188,320
341
$136,400
338
$137,525
112
$46,257
2
$518,020
77
$139,956
0
$0
APPLICATIONS APPROVED, NOT ACCEPTED
0
$0
66
$133,940
64
$118,852
14
$92,656
0
$0
21
$147,599
0
$0
APPLICATIONS DENIED
8
$192,192
147
$132,678
234
$158,511
61
$87,021
0
$0
53
$134,347
2
$209,225
APPLICATIONS WITHDRAWN
0
$0
59
$115,007
150
$155,117
26
$83,129
3
$185,993
14
$131,983
0
$0
FILES CLOSED FOR INCOMPLETENESS
0
$0
14
$145,386
46
$180,704
2
$9,595
0
$0
4
$149,805
0
$0
Aggregated Statistics For Year 2005 (Based on 4 full and 2 partial tracts)
A) FHA, FSA/RHS & VA Home Purchase Loans
B) Conventional Home Purchase Loans
C) Refinancings
D) Home Improvement Loans
E) Loans on Dwellings For 5+ Families
F) Non-occupant Loans on < 5 Family Dwellings (A B C & D)
G) Loans On Manufactured Home Dwelling (A B C & D)
Number
Average Value
Number
Average Value
Number
Average Value
Number
Average Value
Number
Average Value
Number
Average Value
Number
Average Value
LOANS ORIGINATED
48
$194,863
401
$132,897
342
$137,598
102
$60,224
7
$436,664
91
$126,536
0
$0
APPLICATIONS APPROVED, NOT ACCEPTED
7
$176,696
58
$130,890
74
$143,304
8
$78,585
4
$583,735
15
$147,387
0
$0
APPLICATIONS DENIED
7
$205,993
148
$149,692
322
$147,885
65
$56,992
0
$0
57
$129,783
0
$0
APPLICATIONS WITHDRAWN
6
$236,508
97
$125,989
313
$153,865
15
$96,873
6
$389,795
42
$131,129
0
$0
FILES CLOSED FOR INCOMPLETENESS
0
$0
15
$114,042
31
$172,072
4
$30,238
0
$0
4
$138,318
2
$88,440
Aggregated Statistics For Year 2004 (Based on 4 full and 2 partial tracts)
A) FHA, FSA/RHS & VA Home Purchase Loans
B) Conventional Home Purchase Loans
C) Refinancings
D) Home Improvement Loans
E) Loans on Dwellings For 5+ Families
F) Non-occupant Loans on < 5 Family Dwellings (A B C & D)
G) Loans On Manufactured Home Dwelling (A B C & D)
Number
Average Value
Number
Average Value
Number
Average Value
Number
Average Value
Number
Average Value
Number
Average Value
Number
Average Value
LOANS ORIGINATED
50
$146,059
379
$122,296
378
$130,415
73
$70,902
4
$460,465
68
$112,091
2
$74,720
APPLICATIONS APPROVED, NOT ACCEPTED
2
$132,660
30
$140,618
82
$108,386
9
$50,194
2
$151,570
7
$125,213
0
$0
APPLICATIONS DENIED
9
$132,664
81
$125,072
264
$135,220
63
$35,701
0
$0
38
$96,309
2
$14,390
APPLICATIONS WITHDRAWN
5
$158,568
31
$134,516
288
$133,786
18
$100,301
0
$0
9
$113,133
0
$0
FILES CLOSED FOR INCOMPLETENESS
2
$96,640
4
$18,228
39
$129,699
2
$33,575
0
$0
4
$85,662
0
$0
Aggregated Statistics For Year 2003 (Based on 4 full and 2 partial tracts)
A) FHA, FSA/RHS & VA Home Purchase Loans
B) Conventional Home Purchase Loans
C) Refinancings
D) Home Improvement Loans
F) Non-occupant Loans on < 5 Family Dwellings (A B C & D)
Number
Average Value
Number
Average Value
Number
Average Value
Number
Average Value
Number
Average Value
LOANS ORIGINATED
60
$132,340
238
$118,739
761
$115,731
43
$38,675
51
$100,715
APPLICATIONS APPROVED, NOT ACCEPTED
3
$141,503
41
$120,291
193
$124,930
13
$27,539
21
$93,346
APPLICATIONS DENIED
2
$124,535
58
$113,793
260
$109,603
42
$28,127
18
$83,071
APPLICATIONS WITHDRAWN
6
$167,017
27
$144,904
191
$123,574
6
$37,883
9
$108,964
FILES CLOSED FOR INCOMPLETENESS
4
$128,110
2
$92,095
30
$129,716
4
$28,105
2
$12,060
Aggregated Statistics For Year 2002 (Based on 4 full and 2 partial tracts)
A) FHA, FSA/RHS & VA Home Purchase Loans
B) Conventional Home Purchase Loans
C) Refinancings
D) Home Improvement Loans
E) Loans on Dwellings For 5+ Families
F) Non-occupant Loans on < 5 Family Dwellings (A B C & D)
Number
Average Value
Number
Average Value
Number
Average Value
Number
Average Value
Number
Average Value
Number
Average Value
LOANS ORIGINATED
61
$123,422
208
$102,296
382
$108,623
50
$25,921
4
$406,742
37
$72,754
APPLICATIONS APPROVED, NOT ACCEPTED
6
$113,910
23
$144,226
68
$112,584
9
$17,886
0
$0
10
$68,360
APPLICATIONS DENIED
10
$131,449
37
$85,184
161
$70,995
23
$23,001
0
$0
9
$120,024
APPLICATIONS WITHDRAWN
3
$143,647
18
$160,227
110
$92,642
7
$53,427
0
$0
9
$85,426
FILES CLOSED FOR INCOMPLETENESS
3
$153,833
13
$107,588
33
$110,098
0
$0
0
$0
4
$108,070
Aggregated Statistics For Year 2001 (Based on 4 full and 2 partial tracts)
A) FHA, FSA/RHS & VA Home Purchase Loans
B) Conventional Home Purchase Loans
C) Refinancings
D) Home Improvement Loans
E) Loans on Dwellings For 5+ Families
F) Non-occupant Loans on < 5 Family Dwellings (A B C & D)
Number
Average Value
Number
Average Value
Number
Average Value
Number
Average Value
Number
Average Value
Number
Average Value
LOANS ORIGINATED
77
$116,107
140
$93,403
289
$101,025
44
$32,202
2
$223,515
39
$73,298
APPLICATIONS APPROVED, NOT ACCEPTED
2
$98,890
16
$73,619
48
$105,366
18
$33,683
0
$0
2
$73,725
APPLICATIONS DENIED
8
$109,416
36
$89,378
137
$97,523
35
$14,576
0
$0
19
$78,844
APPLICATIONS WITHDRAWN
5
$155,020
6
$105,158
83
$92,033
9
$33,066
0
$0
3
$119,527
FILES CLOSED FOR INCOMPLETENESS
2
$66,750
8
$87,246
19
$93,897
4
$30,068
0
$0
4
$59,248
Aggregated Statistics For Year 2000 (Based on 4 full and 2 partial tracts)
A) FHA, FSA/RHS & VA Home Purchase Loans
B) Conventional Home Purchase Loans
C) Refinancings
D) Home Improvement Loans
E) Loans on Dwellings For 5+ Families
F) Non-occupant Loans on < 5 Family Dwellings (A B C & D)
Number
Average Value
Number
Average Value
Number
Average Value
Number
Average Value
Number
Average Value
Number
Average Value
LOANS ORIGINATED
72
$100,986
134
$101,780
95
$86,051
55
$24,595
2
$32,160
17
$80,658
APPLICATIONS APPROVED, NOT ACCEPTED
5
$94,550
11
$109,534
32
$94,719
14
$22,320
6
$66,192
3
$71,823
APPLICATIONS DENIED
19
$88,183
37
$95,017
118
$63,670
30
$24,201
2
$197,615
15
$68,277
APPLICATIONS WITHDRAWN
2
$104,520
18
$80,853
73
$77,096
6
$29,708
0
$0
4
$65,108
FILES CLOSED FOR INCOMPLETENESS
2
$145,815
5
$76,540
28
$110,591
0
$0
0
$0
0
$0
Aggregated Statistics For Year 1999 (Based on 2 full and 1 partial tracts)
A) FHA, FSA/RHS & VA Home Purchase Loans
B) Conventional Home Purchase Loans
C) Refinancings
D) Home Improvement Loans
E) Loans on Dwellings For 5+ Families
F) Non-occupant Loans on < 5 Family Dwellings (A B C & D)
2002 - 2018 National Fire Incident Reporting System (NFIRS) incidents
According to the data from the years 2002 - 2018 the average number of fires per year is 79. The highest number of fire incidents - 305 took place in 2006, and the least - 10 in 2009. The data has an increasing trend.
When looking into fire subcategories, the most reports belonged to: Outside Fires (42.9%), and Structure Fires (36.5%).
Fire incident types reported to NFIRS in Zip Code 06052


 Nearest zip codes: 06053, 06051, 06037, 06062, 06032, 06489.


 According to the data from the years 2002 - 2018 the average number of fires per year is 79. The highest number of fire incidents - 305 took place in 2006, and the least - 10 in 2009. The data has an increasing trend.
 When looking into fire subcategories, the most reports belonged to: Outside Fires (42.9%), and Structure Fires (36.5%).