Averages for the 2020 tax year for zip code 02163, filed in 2021:
Average Adjusted Gross Income (AGI) in 2020: $101,664 (Individual Income Tax Returns)
Here:
$101,664
State:
$105,130
Salary/wage: $96,479 (reported on 94.4% of returns)
Here:
$96,479
State:
$82,951
(% of AGI for various income ranges: 1083.3% for AGIs below $25k, 3891.4% for AGIs $25k-50k, 6115.0% for AGIs $50k-75k, 9755.0% for AGIs $75k-100k, 16521.7% for AGIs $100k-200k, 61350.0% for AGIs over 200k)
Taxable interest for individuals: $694 (reported on 50.0% of returns)
This zip code:
$694
Massachusetts:
$2,361
(% of AGI for various income ranges: 11.4% for AGIs $25k-50k, 31.7% for AGIs $50k-75k, 22.5% for AGIs $75k-100k, 48.3% for AGIs $100k-200k, 300.0% for AGIs over 200k)
Ordinary dividends: $1,270 (reported on 55.6% of returns)
Here:
$1,270
State:
$10,365
(% of AGI for various income ranges: 34.3% for AGIs $25k-50k, 50.0% for AGIs $50k-75k, 35.0% for AGIs $75k-100k, 240.0% for AGIs $100k-200k, 210.0% for AGIs over 200k)
Net capital gain/loss in AGI: +$7,200 (reported on 50.0% of returns)
Here:
+$7,200
State:
+$48,178
(% of AGI for various income ranges: 122.9% for AGIs $25k-50k, 125.0% for AGIs $50k-75k, 45.0% for AGIs $75k-100k, 1073.3% for AGIs $100k-200k, 2365.0% for AGIs over 200k)
Profit/loss from business: +$10,750 (reported on 11.1% of returns)
Here:
+$10,750
State:
+$20,792
(% of AGI for various income ranges: 716.7% for AGIs $50k-75k)
Percentage of individuals using paid preparers for their 2020 taxes: 100.0%
Here:
100%
State:
92%
(% for various income ranges: 100.0% for AGIs below $25k, 100.0% for AGIs $25k-50k, 100.0% for AGIs $50k-75k, 100.0% for AGIs $75k-100k, 100.0% for AGIs $100k-200k, 100.0% for AGIs over 200k)
Averages for the 2012 tax year for zip code 02163, filed in 2013:
Average Adjusted Gross Income (AGI) in 2012: $92,681 (Individual Income Tax Returns)
Here:
$92,681
State:
$81,425
Salary/wage: $90,496 (reported on 93.8% of returns)
Here:
$90,496
State:
$64,752
(% of AGI for various income ranges: 103.3% for AGIs below $25k, 90.5% for AGIs $25k-50k, 93.5% for AGIs $50k-75k, 95.3% for AGIs $75k-100k, 92.2% for AGIs $100k-200k, 88.8% for AGIs over 200k)
Taxable interest for individuals: $679 (reported on 58.3% of returns)
This zip code:
$679
Massachusetts:
$2,136
(% of AGI for various income ranges: 0.6% for AGIs below $25k, 0.5% for AGIs $25k-50k, 0.3% for AGIs $50k-75k, 0.2% for AGIs $75k-100k, 0.5% for AGIs $100k-200k, 0.4% for AGIs over 200k)
Ordinary dividends: $2,235 (reported on 47.9% of returns)
Here:
$2,235
State:
$9,473
(% of AGI for various income ranges: 3.3% for AGIs below $25k, 1.9% for AGIs $25k-50k, 1.3% for AGIs $50k-75k, 0.9% for AGIs $75k-100k, 0.8% for AGIs $100k-200k, 1.1% for AGIs over 200k)
Net capital gain/loss in AGI: +$3,128 (reported on 37.5% of returns)
Here:
+$3,128
State:
+$31,437
(% of AGI for various income ranges: 0.4% for AGIs $50k-75k, 0.1% for AGIs $75k-100k, 2.0% for AGIs $100k-200k, 1.8% for AGIs over 200k)
Profit/loss from business: +$6,933 (reported on 6.2% of returns)
Here:
+$6,933
State:
+$20,662
Total itemized deductions: $29,868 (20% of AGI, reported on 45.8% of returns)
Here:
$29,868
State:
$28,907
Here:
19.9% of AGI
State:
18.2% of AGI
(% of AGI for various income ranges: 79.7% for AGIs below $25k, 15.0% for AGIs $50k-75k, 14.6% for AGIs $75k-100k, 17.1% for AGIs $100k-200k, 12.7% for AGIs over 200k)
Charity contributions: $2,633 (reported on 31.2% of returns)
Here:
$2,633
State:
$4,208
(% of AGI for various income ranges: 1.7% for AGIs $50k-75k, 1.4% for AGIs $75k-100k, 1.0% for AGIs $100k-200k, 0.6% for AGIs over 200k)
Taxes paid: $12,045 (reported on 45.8% of returns)
02163:
$12,045
State:
$13,303
(% of AGI for various income ranges: 7.8% for AGIs below $25k, 2.7% for AGIs $50k-75k, 4.9% for AGIs $75k-100k, 6.8% for AGIs $100k-200k, 8.1% for AGIs over 200k)
Earned income credit: $1,350 (reported on 4.2% of returns)
Here:
$1,350
State:
$1,971
(% of AGI for various income ranges: 2.6% for AGIs below $25k)
Percentage of individuals using paid preparers for their 2012 taxes: 41.7%
Here:
42%
State:
56%
(% for various income ranges: 37.5% for AGIs below $25k, 36.4% for AGIs $25k-50k, 44.4% for AGIs $50k-75k, 50.0% for AGIs $75k-100k, 37.5% for AGIs $100k-200k, 50.0% for AGIs over 200k)
Averages for the 2004 tax year for zip code 02163, filed in 2005:
Average Adjusted Gross Income (AGI) in 2004: $51,457 (Individual Income Tax Returns)
Here:
$51,457
State:
$62,877
Salary/wage: $52,622 (reported on 86.6% of returns)
Here:
$52,622
State:
$52,969
(% of AGI for various income ranges: 202.9% for AGIs below $10k, 87.5% for AGIs $10k-25k, 93.1% for AGIs $25k-50k, 94.3% for AGIs $50k-75k, 94.1% for AGIs $75k-100k, 81.7% for AGIs over 100k)
Taxable interest for individuals: $687 (reported on 56.7% of returns)
This zip code:
$687
Massachusetts:
$1,945
(% of AGI for various income ranges: 2.9% for AGIs below $10k, 1.1% for AGIs $10k-25k, 0.9% for AGIs $25k-50k, 1.0% for AGIs $50k-75k, 0.6% for AGIs $75k-100k, 0.6% for AGIs over 100k)
Taxable dividends: $1,567 (reported on 43.5% of returns)
Here:
$1,567
State:
$5,323
(% of AGI for various income ranges: 3.3% for AGIs below $10k, 2.2% for AGIs $10k-25k, 1.5% for AGIs $25k-50k, 0.8% for AGIs $50k-75k, 0.4% for AGIs $75k-100k, 1.4% for AGIs over 100k)
Net capital gain/loss: +$5,752 (reported on 35.2% of returns)
Here:
+$5,752
State:
+$20,377
(% of AGI for various income ranges: 2.5% for AGIs below $10k, -0.6% for AGIs $10k-25k, 1.6% for AGIs $25k-50k, -0.5% for AGIs $50k-75k, -0.2% for AGIs $75k-100k, 8.1% for AGIs over 100k)
Profit/loss from business: +$3,091 (reported on 5.0% of returns)
Here:
+$3,091
State:
+$17,837
Total itemized deductions: $22,892 (28% of AGI, reported on 43.3% of returns)
Here:
$22,892
State:
$22,573
Here:
28.2% of AGI
State:
19.5% of AGI
(% of AGI for various income ranges: 100.0% for AGIs below $10k, 30.3% for AGIs $10k-25k, 17.7% for AGIs $25k-50k, 23.5% for AGIs $50k-75k, 17.9% for AGIs $75k-100k, 15.8% for AGIs over 100k)
Charity contributions deductions: $1,955 (2% of AGI, reported on 26.6% of returns)
Here:
$1,955
State:
$3,295
Here:
1.9% of AGI
State:
2.7% of AGI
(% of AGI for various income ranges: 0.5% for AGIs $10k-25k, 0.7% for AGIs $25k-50k, 0.7% for AGIs $50k-75k, 1.3% for AGIs $75k-100k, 1.3% for AGIs over 100k)
Total tax: $10,283 (reported on 70.2% of returns)
02163:
$10,283
State:
$11,494
(% of AGI for various income ranges: 4.0% for AGIs below $10k, 3.1% for AGIs $10k-25k, 6.9% for AGIs $25k-50k, 11.0% for AGIs $50k-75k, 13.3% for AGIs $75k-100k, 20.2% for AGIs over 100k)
Earned income credit: $519 (reported on 4.1% of returns)
Here:
$519
State:
$1,518
Percentage of individuals using paid preparers for their 2004 taxes: 44.5%
Here:
45%
State:
58%
(% for various income ranges: 17.8% for AGIs below $10k, 42.9% for AGIs $10k-25k, 48.4% for AGIs $25k-50k, 60.8% for AGIs $50k-75k, 46.8% for AGIs $75k-100k, 64.0% for AGIs over 100k)
Household received Food Stamps/SNAP in the past 12 months: 0 Household did not receive Food Stamps/SNAP in the past 12 months: 449
Women who had a birth in the past 12 months: 18 (19 now married, 0 unmarried) Women who did not have a birth in the past 12 months: 788 (126 now married, 672 unmarried)
Residents with income below the poverty level in 2022:
This zip code:
37.9%
Whole state:
10.4%
Residents with income below 50% of the poverty level in 2022:
This zip code:
16.6%
Whole state:
5.1%
Median number of rooms in apartments:
Here:
3.3
State:
4.0
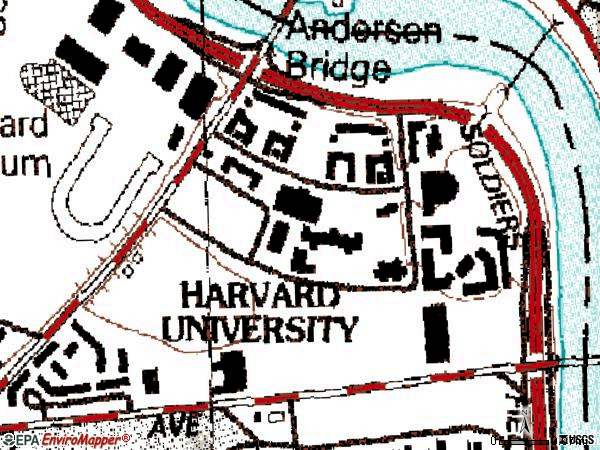
Notable locations in this zip code not listed on our city pages
Notable locations in zip code 02163: Aldrich Building (A), Baker Library (B), Burden Building (C), Chase Building (D), Cumnock Building (E), Fowler Building (F), Gallatin (G), Glass Building (H), Hamilton Building (I), Humphrey Building (J), Kresge Building (K), Ludcke Buildling (L), McCollum Building (M), McCulloch Building (N), Mellon Hall (O), Morgan Building (P), Morris Building (Q), Shad Building (R), Sherman Building (S), Soldiers Field Park Building (T). Display/hide their locations on the map
In group quarters: 1,111 (-1 institutionalized population)
Size of family households: 41 2-persons, 78 3-persons, 6 5-persons
Size of nonfamily households: 170 1-person, 91 2-persons, 73 3-persons
104 married couples with children.
0 single-parent households ().
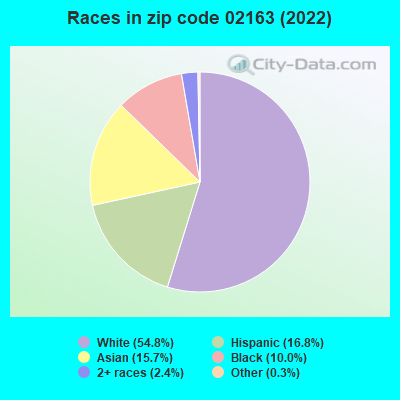
57.0% of residents of 02163 zip code speak English at home.
14.3% of residents speak Spanish at home (98% very well, 2% well).
12.8% of residents speak other Indo-European language at home (86% very well, 13% well, 2% not well).
9.3% of residents speak Asian or Pacific Island language at home (85% very well, 15% well).
5.7% of residents speak other language at home (100% very well).
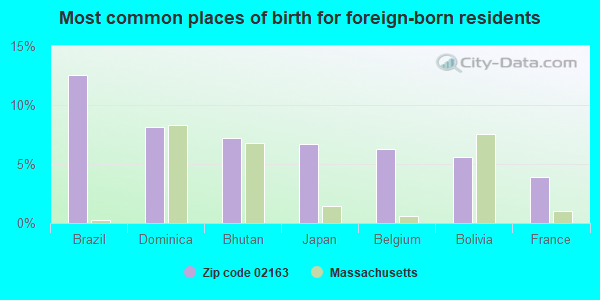
Foreign born population: 742 (37.2%) (7.4% of them are naturalized citizens)
Facilities with environmental interests located in this zip code:
WYETH RESEARCH (87 CAMBRIDGE PARK DRIVE in CAMBRIDGE, MA)
AIR MINOR (AIRS/AFS) CRITERIA AND HAZARDOUS AIR POLLUTANT INVENTORY (Inventory of air pollution sources) HAZARDOUS WASTE BIENNIAL REPORTER (Resource Conservation and Recovery Act (tracking hazardous waste)) Large Quantity Generators, more that 1000 kg of hazardous waste/month (Resource Conservation and Recovery Act (tracking hazardous waste)) - notification TRI REPORTER (Tracking of toxic chemicals releasing facilities) Business SIC classification: PHARMACEUTICAL PREPARATIONS; IN VITRO AND IN VIVO DIAGNOSTIC SUBSTANCES; COMMERCIAL PHYSICAL AND BIOLOGICAL RESEARCH Organizations: TIM MCDERMOTT, SENIOR DIRECTOR (CONTACT/OPERATOR)
, WYETH RESERCH, DIV. WYETH PHARMACEUTICAL (CONTACT/OWNER)
Alternative names: GENETICS INSTITUTE, GENETICS INSTITUTE LLC, WYETH RESEARCH (FORMERLY GENETICS INSTITUTE)
CAMBRIDGE TOWN OF (795 MASSACHUSETTS AVE in CAMBRIDGE, MA)
(Integrated Compliance Information System) - ICIS-01-1996-0083, FORMAL ENFORCEMENT ACTION
BIOGEN IDEC INC (12 CAMBRIDGE CENTER in CAMBRIDGE, MA)
HAZARDOUS WASTE BIENNIAL REPORTER (Resource Conservation and Recovery Act (tracking hazardous waste)) Large Quantity Generators, more that 1000 kg of hazardous waste/month (Resource Conservation and Recovery Act (tracking hazardous waste)) - notification Business NAICS classification: PHARMACEUTICAL PREPARATION MANUFACTURING. Alternative names: BIOGEN INC
MIT - PDSI LAB (77 MASSACHUSETTS AVE. in CAMBRIDGE, MA)
National Pollutant Discharge Elimination System NON-MAJOR (Tracking pollutant discharge elimination systems) - permit
Housing units lacking complete kitchen facilities: 2.9%
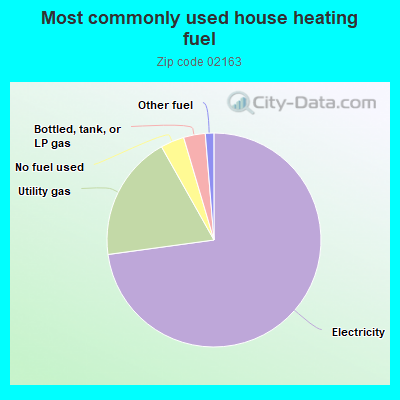
73.2%Electricity
19.1%Utility gas
3.6%No fuel used
3.3%Bottled, tank, or LP gas
1.3%Other fuel
Place of birth for U.S.-born residents:
This state: 214
Northeast: 406
Midwest: 182
South: 292
West: 141
9% of the 02163 zip code residents lived in the same house 5 years ago. Out of people who lived in different houses, 5% lived in this county. Out of people who lived in different counties, 50% lived in Massachusetts.
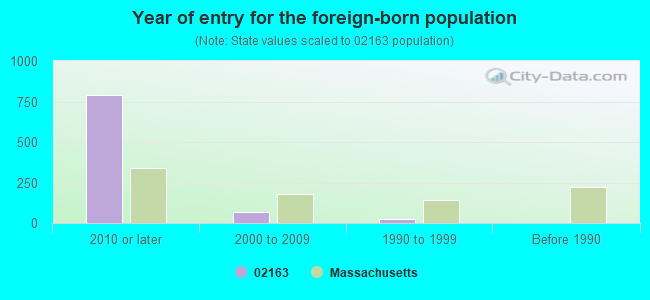
39% of the 02163 zip code residents lived in the same house 1 year ago. Out of people who lived in different houses, 20% moved from this county. Out of people who lived in different houses, 8% moved from different county within same state. Out of people who lived in different houses, 32% moved from different state. Out of people who lived in different houses, 49% moved from abroad.
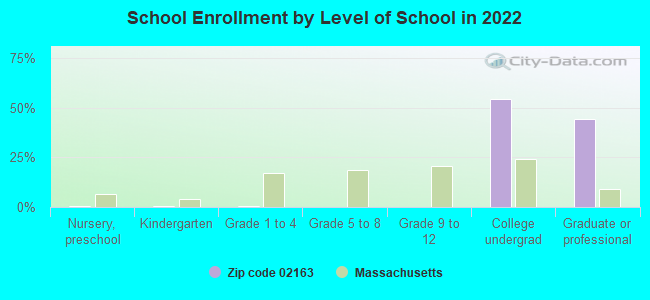
Private vs. public school enrollment:
Students in private schools in grades 1 to 8 (elementary and middle school):
Here:
0.0%
Massachusetts:
10.3%
Students in private undergraduate colleges: 763
Here:
95.7%
Massachusetts:
51.2%
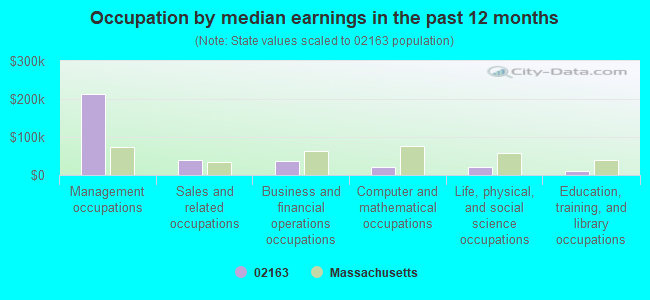
Occupation by median earnings in the past 12 months ($)
212,571Management occupations
39,681Sales and related occupations
37,165Business and financial operations occupations
22,317Computer and mathematical occupations
21,763Life, physical, and social science occupations
10,163Education, training, and library occupations
Companies with federal contracts located in this zip code:
havard business school (Harvard University, Solider Field in Boston, MA) : $1,438,686 in 3 contractsfrom 2003 to 2004
$707,844 with Offices, Boards and Divisions (includes Attorney General, Deputy Attorney General, etc.) for Expert Witness. Taking place in DC. Signed on 2004-05-02. Completion date: 2004-07-15.
$386,550, same as above.Signed on 2003-10-07. Completion date: 2004-07-15.
$344,292, same as above.Signed on 2003-10-01. Completion date: 2004-04-30.
HARVARD COLLEGE, PRESIDENT & F (COTTING HSE SLDIERS FLD in BOSTON, MA)
$43,692 with Defense Logistics Agency for Other Education and Training Services. Taking place in PA. Signed on 2003-10-02. Completion date: 2003-10-15.
Top industries in this zip code by the number of employees in 2005:
Accommodation and Food Services: Food Service Contractors (5-9 employees: 4 establishments, 1-4 employees: 6 establishments)
Health Care and Social Assistance: Child Day Care Services (20-49: 1)
Health Care and Social Assistance: Residential Mental Retardation Facilities (5-9: 1, 1-4: 2)
Wholesale Trade: Stationery and Office Supplies Merchant Wholesalers (5-9: 1)
Information: Television Broadcasting (5-9: 1)
Educational Services: Sports and Recreation Instruction (1-4: 3)
Accommodation and Food Services: Mobile Food Services (1-4: 1)
Real Estate and Rental and Leasing: Recreational Goods Rental (1-4: 1)
Information: Newspaper Publishers (1-4: 1)
People in group quarters in 2010:
1,503 people in college/university student housing
People in group quarters in 2000:
465 people in college dormitories (includes college quarters off campus)
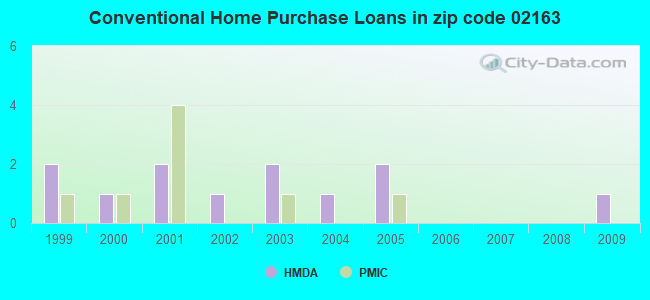
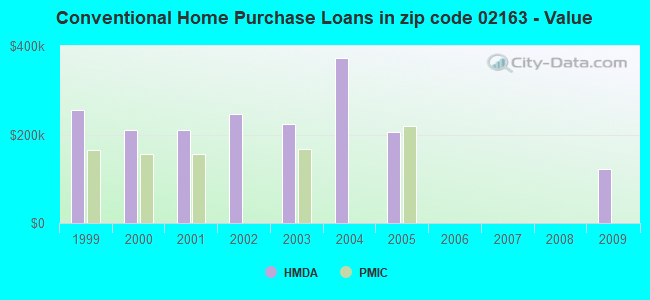
Home Mortgage Disclosure Act Aggregated Statistics For Year 2009 (Based on 2 partial tracts)
B) Conventional Home Purchase Loans
C) Refinancings
Number
Average Value
Number
Average Value
LOANS ORIGINATED
1
$121,730
1
$242,430
APPLICATIONS APPROVED, NOT ACCEPTED
0
$0
0
$0
APPLICATIONS DENIED
0
$0
0
$0
APPLICATIONS WITHDRAWN
0
$0
0
$0
FILES CLOSED FOR INCOMPLETENESS
0
$0
1
$188,270
Aggregated Statistics For Year 2008 (Based on 2 partial tracts)
B) Conventional Home Purchase Loans
C) Refinancings
F) Non-occupant Loans on < 5 Family Dwellings (A B C & D)
Number
Average Value
Number
Average Value
Number
Average Value
LOANS ORIGINATED
0
$0
1
$359,000
1
$215,090
APPLICATIONS APPROVED, NOT ACCEPTED
0
$0
0
$0
0
$0
APPLICATIONS DENIED
1
$137,200
1
$215,090
1
$215,090
APPLICATIONS WITHDRAWN
0
$0
0
$0
0
$0
FILES CLOSED FOR INCOMPLETENESS
0
$0
0
$0
0
$0
Aggregated Statistics For Year 2007 (Based on 2 partial tracts)
B) Conventional Home Purchase Loans
C) Refinancings
Number
Average Value
Number
Average Value
LOANS ORIGINATED
0
$0
1
$374,990
APPLICATIONS APPROVED, NOT ACCEPTED
0
$0
0
$0
APPLICATIONS DENIED
1
$116,060
0
$0
APPLICATIONS WITHDRAWN
0
$0
0
$0
FILES CLOSED FOR INCOMPLETENESS
0
$0
0
$0
Aggregated Statistics For Year 2006 (Based on 2 partial tracts)
B) Conventional Home Purchase Loans
C) Refinancings
F) Non-occupant Loans on < 5 Family Dwellings (A B C & D)
Number
Average Value
Number
Average Value
Number
Average Value
LOANS ORIGINATED
0
$0
0
$0
0
$0
APPLICATIONS APPROVED, NOT ACCEPTED
0
$0
0
$0
0
$0
APPLICATIONS DENIED
0
$0
1
$62,930
0
$0
APPLICATIONS WITHDRAWN
1
$179,500
0
$0
1
$179,500
FILES CLOSED FOR INCOMPLETENESS
0
$0
0
$0
0
$0
Aggregated Statistics For Year 2005 (Based on 2 partial tracts)
B) Conventional Home Purchase Loans
C) Refinancings
D) Home Improvement Loans
E) Loans on Dwellings For 5+ Families
F) Non-occupant Loans on < 5 Family Dwellings (A B C & D)
Number
Average Value
Number
Average Value
Number
Average Value
Number
Average Value
Number
Average Value
LOANS ORIGINATED
2
$206,320
1
$221,790
0
$0
1
$1,923,930
1
$193,940
APPLICATIONS APPROVED, NOT ACCEPTED
1
$25,790
0
$0
0
$0
0
$0
0
$0
APPLICATIONS DENIED
1
$203,740
3
$221,623
2
$10,315
0
$0
2
$10,315
APPLICATIONS WITHDRAWN
2
$177,435
0
$0
0
$0
0
$0
0
$0
FILES CLOSED FOR INCOMPLETENESS
0
$0
0
$0
0
$0
0
$0
0
$0
Aggregated Statistics For Year 2004 (Based on 2 partial tracts)
B) Conventional Home Purchase Loans
C) Refinancings
D) Home Improvement Loans
Number
Average Value
Number
Average Value
Number
Average Value
LOANS ORIGINATED
1
$373,440
1
$419,860
0
$0
APPLICATIONS APPROVED, NOT ACCEPTED
0
$0
0
$0
0
$0
APPLICATIONS DENIED
1
$91,300
0
$0
1
$64,480
APPLICATIONS WITHDRAWN
1
$245,520
1
$195,490
0
$0
FILES CLOSED FOR INCOMPLETENESS
0
$0
0
$0
0
$0
Aggregated Statistics For Year 2003 (Based on 2 partial tracts)
B) Conventional Home Purchase Loans
C) Refinancings
D) Home Improvement Loans
Number
Average Value
Number
Average Value
Number
Average Value
LOANS ORIGINATED
2
$223,085
4
$266,025
0
$0
APPLICATIONS APPROVED, NOT ACCEPTED
0
$0
0
$0
0
$0
APPLICATIONS DENIED
1
$148,030
1
$2,259,200
1
$4,130
APPLICATIONS WITHDRAWN
1
$127,920
0
$0
0
$0
FILES CLOSED FOR INCOMPLETENESS
0
$0
0
$0
0
$0
Aggregated Statistics For Year 2002 (Based on 2 partial tracts)
B) Conventional Home Purchase Loans
C) Refinancings
F) Non-occupant Loans on < 5 Family Dwellings (A B C & D)
Number
Average Value
Number
Average Value
Number
Average Value
LOANS ORIGINATED
1
$246,550
4
$237,268
3
$214,057
APPLICATIONS APPROVED, NOT ACCEPTED
0
$0
0
$0
0
$0
APPLICATIONS DENIED
0
$0
0
$0
0
$0
APPLICATIONS WITHDRAWN
1
$149,580
1
$128,950
1
$128,950
FILES CLOSED FOR INCOMPLETENESS
0
$0
0
$0
0
$0
Aggregated Statistics For Year 2001 (Based on 2 partial tracts)
B) Conventional Home Purchase Loans
C) Refinancings
D) Home Improvement Loans
F) Non-occupant Loans on < 5 Family Dwellings (A B C & D)
Number
Average Value
Number
Average Value
Number
Average Value
Number
Average Value
LOANS ORIGINATED
2
$209,415
3
$302,947
1
$25,790
2
$341,975
APPLICATIONS APPROVED, NOT ACCEPTED
1
$32,500
1
$144,420
0
$0
0
$0
APPLICATIONS DENIED
0
$0
0
$0
1
$1,550
0
$0
APPLICATIONS WITHDRAWN
1
$70,150
0
$0
0
$0
1
$70,150
FILES CLOSED FOR INCOMPLETENESS
0
$0
0
$0
0
$0
0
$0
Aggregated Statistics For Year 2000 (Based on 2 partial tracts)
A) FHA, FSA/RHS & VA Home Purchase Loans
B) Conventional Home Purchase Loans
C) Refinancings
D) Home Improvement Loans
F) Non-occupant Loans on < 5 Family Dwellings (A B C & D)
Number
Average Value
Number
Average Value
Number
Average Value
Number
Average Value
Number
Average Value
LOANS ORIGINATED
1
$56,740
1
$209,410
2
$130,495
0
$0
2
$152,420
APPLICATIONS APPROVED, NOT ACCEPTED
0
$0
0
$0
0
$0
0
$0
0
$0
APPLICATIONS DENIED
0
$0
1
$152,160
3
$116,913
1
$12,900
0
$0
APPLICATIONS WITHDRAWN
0
$0
0
$0
0
$0
0
$0
0
$0
FILES CLOSED FOR INCOMPLETENESS
0
$0
0
$0
0
$0
0
$0
0
$0
Aggregated Statistics For Year 1999 (Based on 2 partial tracts)
B) Conventional Home Purchase Loans
C) Refinancings
F) Non-occupant Loans on < 5 Family Dwellings (A B C & D)
Detailed PMIC statistics for the following Tracts:0008.01
2002 - 2018 National Fire Incident Reporting System (NFIRS) incidents
Based on the data from the years 2002 - 2018 the average number of fires per year is 7. The highest number of fire incidents - 21 took place in 2014, and the least - 0 in 2004. The data has a growing trend.
When looking into fire subcategories, the most incidents belonged to: Structure Fires (75.8%), and Outside Fires (16.7%).
Fire incident types reported to NFIRS in Zip Code 02163


 Nearest zip codes: 02134, 02138, 02139, 02446, 02215, 02140.


 Based on the data from the years 2002 - 2018 the average number of fires per year is 7. The highest number of fire incidents - 21 took place in 2014, and the least - 0 in 2004. The data has a growing trend.
 When looking into fire subcategories, the most incidents belonged to: Structure Fires (75.8%), and Outside Fires (16.7%).