Work and Jobs in Southeast Hidalgo, Texas (TX) Detailed Stats
Occupations, Industries, Unemployment, Workers, Commute
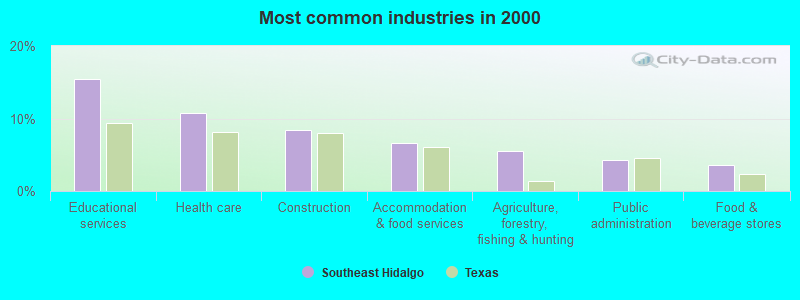
The most common industries in Southeast Hidalgo are: Educational services (15.4% of civilian employees), Health care (10.8% of civilian employees), Construction (8.4% of civilian employees). 66.7% of workers are employees of private companies, which is 4.3% less than the rate of 69.6% across the entire state of Texas.
Most common industries
Most common industries | |||
|---|---|---|---|
Industry | All | Males | Females |
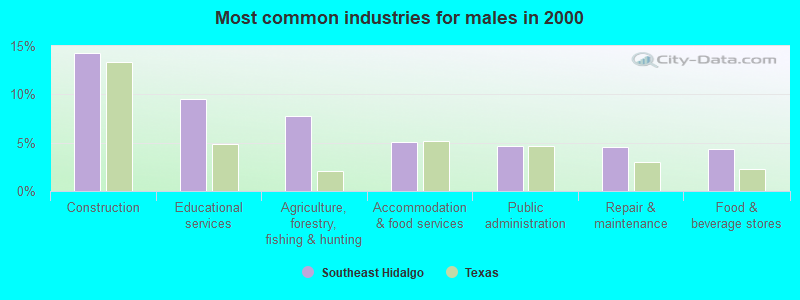
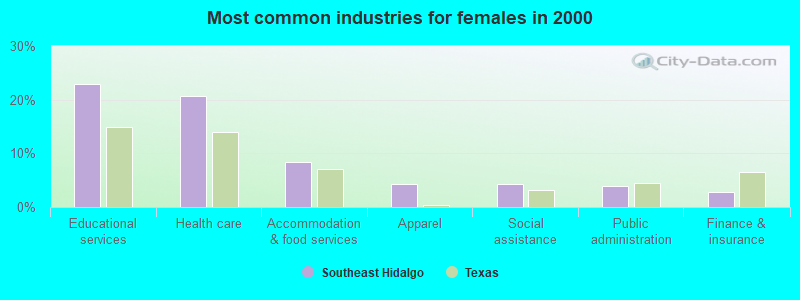
| Educational services | 15.4% (4,581) | 9.5% (1,559) | 22.8% (3,022) |
| Health care | 10.8% (3,205) | 2.8% (458) | 20.8% (2,747) |
| Construction | 8.4% (2,504) | 14.3% (2,352) | 1.1% (152) |
| Accommodation and food services | 6.6% (1,948) | 5.1% (838) | 8.4% (1,110) |
| Agriculture, forestry, fishing and hunting | 5.5% (1,619) | 7.7% (1,270) | 2.6% (349) |
| Public administration | 4.3% (1,263) | 4.6% (757) | 3.8% (506) |
| Food and beverage stores | 3.6% (1,073) | 4.3% (711) | 2.7% (362) |
| Apparel | 2.8% (820) | 1.5% (251) | 4.3% (569) |
| Repair and maintenance | 2.6% (780) | 4.6% (749) | 0.2% (31) |
| Truck transportation | 2.3% (686) | 4.1% (678) | 0.1% (8) |
| Department and other general merchandise stores | 2.3% (686) | 1.9% (319) | 2.8% (367) |
| Groceries and related products merchant wholesalers | 2.3% (680) | 2.7% (439) | 1.8% (241) |
| Administrative and support and waste management services | 2.3% (675) | 2.9% (476) | 1.5% (199) |
| Social assistance | 2.2% (649) | 0.5% (80) | 4.3% (569) |
| Finance and insurance | 2.1% (615) | 1.4% (234) | 2.9% (381) |
| Professional, scientific, and technical services | 2.0% (586) | 1.6% (267) | 2.4% (319) |
| Food | 1.9% (571) | 2.6% (430) | 1.1% (141) |
| Motor vehicle and parts dealers | 1.8% (520) | 2.7% (444) | 0.6% (76) |
| Broadcasting and telecommunications | 1.4% (419) | 1.9% (316) | 0.8% (103) |
| Real estate and rental and leasing | 1.3% (372) | 1.3% (213) | 1.2% (159) |
| Personal and laundry services | 1.2% (347) | 0.7% (120) | 1.7% (227) |
| Miscellaneous manufacturing | 1.1% (331) | 1.4% (225) | 0.8% (106) |
| Utilities | 1.1% (314) | 1.7% (287) | 0.2% (27) |
| Building material and garden equipment and supplies dealers | 0.9% (276) | 1.3% (219) | 0.4% (57) |
| Other transportation, and support activities, and couriers | 0.8% (247) | 1.2% (194) | 0.4% (53) |
| Other direct selling establishments | 0.8% (229) | 0.7% (122) | 0.8% (107) |
| Private households | 0.8% (229) | 0.2% (27) | 1.5% (202) |
| Religious, grantmaking, civic, professional, and similar organizations | 0.7% (217) | 0.5% (77) | 1.1% (140) |
| Furniture and related product manufacturing | 0.7% (215) | 1.3% (215) | 0.0% (0) |
| U. S. Postal service | 0.6% (179) | 0.7% (119) | 0.5% (60) |
| Used merchandise, gift, novelty, and souvenir, and other miscellaneous stores | 0.6% (179) | 0.5% (89) | 0.7% (90) |
| Miscellaneous nondurable goods merchant wholesalers | 0.6% (165) | 0.8% (130) | 0.3% (35) |
| Pharmacies and drug stores | 0.4% (127) | 0.2% (33) | 0.7% (94) |
| Clothing and accessories, including shoe, stores | 0.4% (123) | 0.2% (39) | 0.6% (84) |
| Machinery, equipment, and supplies merchant wholesalers | 0.4% (120) | 0.7% (112) | 0.1% (8) |
| Radio, TV, and computer stores | 0.4% (114) | 0.6% (93) | 0.2% (21) |
| Publishing, and motion picture and sound recording industries | 0.3% (103) | 0.5% (89) | 0.1% (14) |
| Furniture and home furnishings, and household appliance stores | 0.3% (101) | 0.3% (48) | 0.4% (53) |
| Arts, entertainment, and recreation | 0.3% (98) | 0.5% (89) | 0.1% (9) |
| Warehousing and storage | 0.3% (94) | 0.3% (56) | 0.3% (38) |
| Chemicals | 0.3% (92) | 0.4% (59) | 0.2% (33) |
| Mining, quarrying, and oil and gas extraction | 0.3% (89) | 0.5% (79) | 0.1% (10) |
| Gasoline stations | 0.3% (84) | 0.2% (39) | 0.3% (45) |
| Nonmetallic mineral products | 0.3% (83) | 0.5% (77) | 0.0% (6) |
| Transportation equipment | 0.3% (82) | 0.4% (72) | 0.1% (10) |
| Petroleum and coal products | 0.3% (79) | 0.5% (79) | 0.0% (0) |
| Leather and allied products | 0.3% (75) | 0.5% (75) | 0.0% (0) |
| Wood products | 0.2% (72) | 0.4% (65) | 0.1% (7) |
| Metal and metal products | 0.2% (66) | 0.3% (56) | 0.1% (10) |
| Hardware, plumbing and heating equipment, and supplies merchant wholesalers | 0.2% (60) | 0.2% (40) | 0.2% (20) |
| Retail florists | 0.2% (52) | 0.1% (10) | 0.3% (42) |
| Computer and electronic products | 0.2% (45) | 0.1% (22) | 0.2% (23) |
| Motor vehicles, parts and supplies merchant wholesalers | 0.1% (44) | 0.3% (44) | 0.0% (0) |
| Sporting goods, camera, and hobby and toy stores | 0.1% (44) | 0.2% (38) | 0.0% (6) |
| Printing and related support activities | 0.1% (43) | 0.2% (31) | 0.1% (12) |
| Apparel, fabrics, and notions merchant wholesalers | 0.1% (37) | 0.2% (37) | 0.0% (0) |
| Jewelry, luggage, and leather goods stores | 0.1% (37) | 0.1% (16) | 0.2% (21) |
| Farm supplies merchant wholesalers | 0.1% (33) | 0.1% (18) | 0.1% (15) |
| Drugs, sundries, and chemical and allied products merchant wholesalers | 0.1% (30) | 0.1% (18) | 0.1% (12) |
| Miscellaneous durable goods merchant wholesalers | 0.1% (30) | 0.2% (25) | 0.0% (5) |
| Petroleum and petroleum products merchant wholesalers | 0.1% (30) | 0.2% (30) | 0.0% (0) |
| Electrical and electronic goods merchant wholesalers | 0.1% (30) | 0.1% (21) | 0.1% (9) |
| Air transportation | 0.1% (29) | 0.1% (22) | 0.1% (7) |
| Farm product raw materials merchant wholesalers | 0.1% (29) | 0.2% (29) | 0.0% (0) |
| Recyclable material merchant wholesalers | 0.1% (26) | 0.2% (26) | 0.0% (0) |
| Machinery | 0.1% (23) | 0.1% (17) | 0.0% (6) |
| Professional and commercial equipment and supplies merchant wholesalers | 0.1% (21) | 0.1% (21) | 0.0% (0) |
| Paper and paper products merchant wholesalers | 0.1% (20) | 0.1% (20) | 0.0% (0) |
| Alcoholic beverages merchant wholesalers | 0.1% (19) | 0.1% (19) | 0.0% (0) |
Unemployment in Southeast Hidalgo
- Unemployment by race in 2000
- Unemployment rate for White non-Hispanic residents
- 4.4%Males
- 4.9%Females
- Unemployment rate for Black residents
- 33.3%Males
- Unemployment rate for American Indian and Alaska Native residents
- 18.2%Males
- 41.7%Females
- Unemployment rate for Asian residents
- 7.2%Males
- 8.8%Females
- Unemployment rate for other race residents
- 18.3%Males
- 20.5%Females
- Unemployment rate for two or more race residents
- 18.2%Males
- 22.6%Females
- Unemployment rate for Hispanic or Latino residents
- 15.8%Males
- 15.3%Females
Time leaving home to go to work

<5am:
| Southeast Hidalgo: | 3.2% (918) |
| Texas: | 3.1% (281,361) |
5:30am:
| Southeast Hidalgo: | 2.3% (680) |
| Texas: | 2.9% (262,060) |
6am:
| Southeast Hidalgo: | 3.8% (1,092) |
| Texas: | 4.4% (403,423) |
6:30am:
| Southeast Hidalgo: | 8.4% (2,443) |
| Texas: | 8.8% (808,876) |
7am:
| Southeast Hidalgo: | 10.5% (3,064) |
| Texas: | 10.7% (976,557) |
7:30am:
| Southeast Hidalgo: | 19.8% (5,776) |
| Texas: | 16.4% (1,500,904) |
8am:
| Southeast Hidalgo: | 18.6% (5,402) |
| Texas: | 16.8% (1,536,308) |
8:30am:
| Southeast Hidalgo: | 9.7% (2,820) |
| Texas: | 10.0% (913,601) |
9am:
| Southeast Hidalgo: | 3.5% (1,005) |
| Texas: | 4.4% (398,656) |
10am:
| Southeast Hidalgo: | 4.9% (1,417) |
| Texas: | 5.2% (472,592) |
11am:
| Southeast Hidalgo: | 1.5% (448) |
| Texas: | 2.2% (197,844) |
12pm:
| Southeast Hidalgo: | 0.7% (206) |
| Texas: | 0.9% (86,997) |
4pm:
| Southeast Hidalgo: | 4.5% (1,316) |
| Texas: | 5.5% (503,565) |
>4pm:
| Southeast Hidalgo: | 7.1% (2,060) |
| Texas: | 6.1% (563,107) |
Travel time to work


Less than 5 minutes:
| Southeast Hidalgo: | 2.6% (750) |
| Texas: | 3.0% (277,642) |
5 to 9 minutes:
| Southeast Hidalgo: | 12.3% (3,567) |
| Texas: | 10.3% (942,891) |
10 to 14 minutes:
| Southeast Hidalgo: | 19.6% (5,712) |
| Texas: | 14.4% (1,317,555) |
15 to 19 minutes:
| Southeast Hidalgo: | 19.8% (5,766) |
| Texas: | 16.0% (1,467,945) |
20 to 24 minutes:
| Southeast Hidalgo: | 13.5% (3,924) |
| Texas: | 13.9% (1,276,781) |
25 to 29 minutes:
| Southeast Hidalgo: | 4.5% (1,314) |
| Texas: | 5.3% (482,838) |
30 to 34 minutes:
| Southeast Hidalgo: | 16.9% (4,921) |
| Texas: | 14.3% (1,309,699) |
35 to 39 minutes:
| Southeast Hidalgo: | 1.4% (409) |
| Texas: | 2.4% (219,873) |
40 to 44 minutes:
| Southeast Hidalgo: | 0.8% (236) |
| Texas: | 3.1% (280,916) |
45 to 59 minutes:
| Southeast Hidalgo: | 3.2% (930) |
| Texas: | 7.6% (692,006) |
60 to 89 minutes:
| Southeast Hidalgo: | 2.2% (652) |
| Texas: | 4.6% (418,905) |
90 or more minutes:
| Southeast Hidalgo: | 1.6% (466) |
| Texas: | 2.4% (218,800) |
Means of transportation to work


Drove car alone:
| Southeast Hidalgo: | 73.6% (21,407) |
| Texas: | 77.7% (7,115,590) |
Carpooled:
| Southeast Hidalgo: | 19.5% (5,665) |
| Texas: | 14.5% (1,326,012) |
Bus or trolley bus:
| Southeast Hidalgo: | 0.1% (35) |
| Texas: | 1.7% (157,014) |
Ferryboat:
| Southeast Hidalgo: | 0.0% (9) |
| Texas: | 0.0% (738) |
Taxicab:
| Southeast Hidalgo: | 0.1% (41) |
| Texas: | 0.1% (6,102) |
Motorcycle:
| Southeast Hidalgo: | 0.0% (7) |
| Texas: | 0.1% (12,068) |
Bicycle:
| Southeast Hidalgo: | 0.1% (16) |
| Texas: | 0.2% (21,551) |
Walked:
| Southeast Hidalgo: | 2.2% (652) |
| Texas: | 1.9% (173,670) |
Other means:
| Southeast Hidalgo: | 2.8% (815) |
| Texas: | 0.9% (86,692) |
Private vehicle occupancy

Drove alone:
| Southeast Hidalgo: | 79.1% (21,407) |
| Texas: | 84.3% (7,115,590) |
In 2 person carpool:
| Southeast Hidalgo: | 14.1% (3,812) |
| Texas: | 11.6% (982,994) |
In 3 person carpool:
| Southeast Hidalgo: | 4.5% (1,228) |
| Texas: | 2.4% (201,602) |
In 4 person carpool:
| Southeast Hidalgo: | 1.8% (476) |
| Texas: | 1.0% (83,518) |
In 5-6 person carpool:
| Southeast Hidalgo: | 0.5% (138) |
| Texas: | 0.5% (40,662) |
In 7+ person carpool:
| Southeast Hidalgo: | 0.0% (11) |
| Texas: | 0.2% (17,236) |
Class of workers
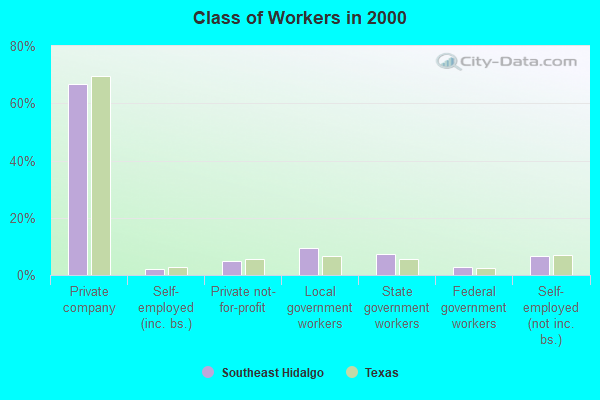
Employee of private company:
| Southeast Hidalgo: | 66.7% (19,792) |
| Texas: | 69.6% (6,425,274) |
Self-employed in own incorporated business:
| Southeast Hidalgo: | 2.1% (611) |
| Texas: | 2.7% (250,864) |
Private not-for-profit wage and salary workers:
| Southeast Hidalgo: | 5.0% (1,469) |
| Texas: | 5.7% (526,631) |
Local government workers:
| Southeast Hidalgo: | 9.4% (2,785) |
| Texas: | 6.6% (608,479) |
State government workers:
| Southeast Hidalgo: | 7.3% (2,153) |
| Texas: | 5.4% (501,082) |
Federal government workers:
| Southeast Hidalgo: | 2.7% (788) |
| Texas: | 2.6% (237,177) |
Self-employed workers in own not incorporated business:
| Southeast Hidalgo: | 6.7% (2,002) |
| Texas: | 7.1% (653,527) |
Unpaid family workers:
| Southeast Hidalgo: | 0.3% (76) |
| Texas: | 0.3% (31,338) |

Employee of private company - Males:
| Southeast Hidalgo: | 69.5% (11,430) |
| Texas: | 72.7% (3,684,731) |
Self-employed in own incorporated business - Males:
| Southeast Hidalgo: | 2.8% (456) |
| Texas: | 3.6% (183,838) |
Private not-for-profit wage and salary workers - Males:
| Southeast Hidalgo: | 3.8% (631) |
| Texas: | 3.4% (173,484) |
Local government workers - Males:
| Southeast Hidalgo: | 7.5% (1,228) |
| Texas: | 5.1% (260,804) |
State government workers - Males:
| Southeast Hidalgo: | 4.4% (727) |
| Texas: | 3.8% (190,371) |
Federal government workers - Males:
| Southeast Hidalgo: | 2.3% (382) |
| Texas: | 2.6% (133,009) |
Self-employed workers in own not incorporated business - Males:
| Southeast Hidalgo: | 9.4% (1,548) |
| Texas: | 8.4% (428,111) |
Unpaid family workers - Males:
| Southeast Hidalgo: | 0.3% (42) |
| Texas: | 0.3% (14,338) |

Employee of private company - Females:
| Southeast Hidalgo: | 63.2% (8,362) |
| Texas: | 65.8% (2,740,543) |
Self-employed in own incorporated business - Females:
| Southeast Hidalgo: | 1.2% (155) |
| Texas: | 1.6% (67,026) |
Private not-for-profit wage and salary workers - Females:
| Southeast Hidalgo: | 6.3% (838) |
| Texas: | 8.5% (353,147) |
Local government workers - Females:
| Southeast Hidalgo: | 11.8% (1,557) |
| Texas: | 8.3% (347,675) |
State government workers - Females:
| Southeast Hidalgo: | 10.8% (1,426) |
| Texas: | 7.5% (310,711) |
Federal government workers - Females:
| Southeast Hidalgo: | 3.1% (406) |
| Texas: | 2.5% (104,168) |
Self-employed workers in own not incorporated business - Females:
| Southeast Hidalgo: | 3.4% (454) |
| Texas: | 5.4% (225,416) |
Unpaid family workers - Females:
| Southeast Hidalgo: | 0.3% (34) |
| Texas: | 0.4% (17,000) |