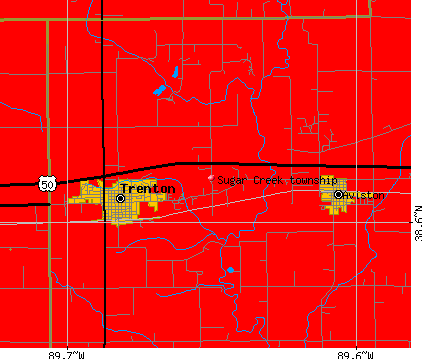
Sugar Creek township, Clinton County, Illinois (IL) detailed profile
Number of foreign born residents: 1 (67% naturalized citizens)
| Sugar Creek township: | 1.1% |
| Whole state: | 12.3% |
63% of Sugar Creek township residents lived in the same house 5 years ago.
Out of people who lived in different houses, 63% lived in this county.
Out of people who lived in different counties, 66% lived in Illinois.
Place of birth for U.S.-born residents:
- This state: 4092
- Northeast: 68
- Midwest: 502
- South: 281
- West: 122
Median price asked for vacant for-sale houses in 2000: $55,000
Percentage of households with unmarried partners: 3.3%
Likely homosexual households (counted as self-reported same-sex unmarried-partner households)
- Lesbian couples: 0.0% of all households
- Gay men: 0.1% of all households
72 people in nursing homes
16 people in other nonhousehold living situations
Housing units in structures:
- One, detached: 1,690
- One, attached: 16
- Two: 81
- 3 or 4: 62
- 5 to 9: 37
- 10 to 19: 15
- 20 to 49: 14
- Mobile homes: 92
Median worth of mobile homes: $23,400
Housing units in Sugar Creek township with a mortgage: 781 (48 second mortgage, 95 home equity loan, 1 both second mortgage and home equity loan)
Houses without a mortgage: 542
- Construction (14%)
- Educational services (8%)
- Metal and metal products (6%)
- Public administration (5%)
- Motor vehicle and parts dealers (4%)
- Professional, scientific, and technical services (4%)
- Real estate and rental and leasing (3%)
- Health care (18%)
- Educational services (13%)
- Finance and insurance (11%)
- Public administration (8%)
- Professional, scientific, and technical services (7%)
- Accommodation and food services (6%)
- Real estate and rental and leasing (4%)
- Other production occupations including supervisors (7%)
- Driver/sales workers and truck drivers (6%)
- Electrical equipment mechanics and other installation, maintenance, and repair occupations including supervisors (4%)
- Other management occupations except farmers and farm managers (4%)
- Metal workers and plastic workers (4%)
- Building and grounds cleaning and maintenance occupations (4%)
- Computer specialists (4%)
- Secretaries and administrative assistants (11%)
- Other office and administrative support workers including supervisors (7%)
- Preschool, kindergarten, elementary and middle school teachers (6%)
- Bookkeeping, accounting, and auditing clerks (6%)
- Registered nurses (6%)
- Cooks and food preparation workers (4%)
- Other production occupations including supervisors (4%)
Most common first ancestries reported in Sugar Creek township:
- German (64.4%)
- English (7.1%)
- Irish (6.9%)
- United States or American (6.9%)
- French (except Basque) (2.1%)
- Polish (1.4%)
- Italian (1.3%)
Most common places of birth for the foreign-born residents:
- Philippines (24%)
- Germany (19%)
- Russia (17%)
- United Kingdom (9%)
- Spain (9%)
- Other Western Europe (7%)
- Czechoslovakia (includes Czech Republic and Slovakia) (6%)
Means of transportation to work:
- Drove a car alone: 2,255 (83%)
- Carpooled: 291 (11%)
- Bus or trolley bus: 6 (0%)
- Subway or elevated: 9 (0%)
- Bicycle: 4 (0%)
- Walked: 51 (2%)
- Other means: 9 (0%)
- Worked at home: 93 (3%)
Most commonly used house heating fuel:
- Utility gas (65%)
- Bottled, tank, or LP gas (18%)
- Electricity (16%)
- Fuel oil, kerosene, etc. (1%)
- Wood (1%)
72 people in nursing homes
16 people in other nonhousehold living situations
96.7% of residents of Sugar Creek township speak English at home.
1.8% of residents speak Spanish at home (75% speak English very well, 7% speak English well, 18% speak English not well).
1.3% of residents speak other Indo-European language at home (74% speak English very well, 16% speak English well, 10% speak English not well).
0.2% of residents speak Asian or Pacific Island language at home (100% speak English very well).
Household type by relationship:
Households: 5,070- In family households: 4,537 (1,269 male householders, 215 female householders)
1,237 spouses, 1,650 children (1,505 natural, 68 adopted, 77 stepchildren), 25 grandchildren, 12 brothers or sisters, 44 parents, 25 other relatives, 60 non-relatives
- In nonfamily households: 533 (185 male householders (148 living alone)), 288 female householders (273 living alone)), 60 nonrelatives
- In group quarters: 88 (72 institutionalized population)
Size of family households: 626 2-persons, 342 3-persons, 341 4-persons, 137 5-persons, 36 6-persons, 2 7-or-more-persons,
Size of nonfamily households: 421 1-person, 42 2-persons, 9 3-persons, 1 4-persons,
1,062 married couples with children.
183 single-parent households (48 men, 135 women).
Private vs. public school enrollment:
Students in private schools in grades 1 to 8 (elementary and middle school): 22
| Here: | 3.8% |
| Illinois: | 13.4% |
Students in private schools in grades 9 to 12 (high school): 67
| Here: | 21.5% |
| Illinois: | 11.1% |
Students in private undergraduate colleges: 47
| Here: | 18.9% |
| Illinois: | 25.8% |