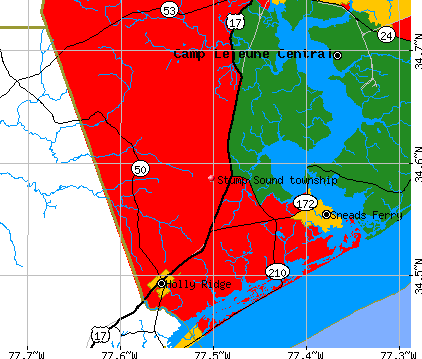
Stump Sound township, Onslow County, North Carolina (NC) detailed profile
Number of foreign born residents: 2 (84% naturalized citizens)
| Stump Sound township: | 1.8% |
| Whole state: | 5.3% |
48% of Stump Sound township residents lived in the same house 5 years ago.
Out of people who lived in different houses, 43% lived in this county.
Out of people who lived in different counties, 32% lived in North Carolina.
Place of birth for U.S.-born residents:
- This state: 6224
- Northeast: 1582
- Midwest: 1026
- South: 2179
- West: 598
Median price asked for vacant for-sale houses in 2000: $127,100
Percentage of households with unmarried partners: 5.6%
Likely homosexual households (counted as self-reported same-sex unmarried-partner households)
- Lesbian couples: 0.3% of all households
- Gay men: 0.2% of all households
33 people in other noninstitutional group quarters
8 people in other group homes
Housing units in structures:
- One, detached: 3,561
- One, attached: 386
- Two: 207
- 3 or 4: 167
- 5 to 9: 104
- 10 to 19: 12
- 20 to 49: 463
- 50 or more: 366
- Mobile homes: 2,719
- Boats, RVs, vans, etc.: 150
Median worth of mobile homes: $39,500
Housing units in Stump Sound township with a mortgage: 1,502 (110 second mortgage, 205 home equity loan, 7 both second mortgage and home equity loan)
Houses without a mortgage: 737
- Construction (27%)
- Public administration (11%)
- Agriculture, forestry, fishing and hunting (6%)
- Repair and maintenance (6%)
- Accommodation and food services (5%)
- Food (3%)
- Educational services (3%)
- Accommodation and food services (11%)
- Educational services (11%)
- Health care (9%)
- Public administration (7%)
- Food and beverage stores (4%)
- Social assistance (4%)
- Professional, scientific, and technical services (4%)
- Vehicle and mobile equipment mechanics, installers, and repairers (7%)
- Construction trades workers except carpenters, electricians, painters, plumbers, and construction laborers (6%)
- Other management occupations except farmers and farm managers (5%)
- Construction laborers (5%)
- Fishing and hunting, and forest and logging workers (5%)
- Driver/sales workers and truck drivers (5%)
- Carpenters (5%)
- Preschool, kindergarten, elementary and middle school teachers (6%)
- Secretaries and administrative assistants (6%)
- Other sales and related workers including supervisors (6%)
- Cashiers (5%)
- Information and record clerks except customer service representatives (4%)
- Building and grounds cleaning and maintenance occupations (4%)
- Retail sales workers except cashiers (4%)
Most common first ancestries reported in Stump Sound township:
- United States or American (20.1%)
- Irish (13.3%)
- English (12.7%)
- German (10.8%)
- Italian (5.2%)
- Scotch-Irish (3.5%)
- Polish (3.2%)
Most common places of birth for the foreign-born residents:
- Germany (21%)
- United Kingdom (15%)
- Korea (10%)
- Italy (8%)
- Honduras (8%)
- Mexico (7%)
- Vietnam (7%)
Means of transportation to work:
- Drove a car alone: 4,519 (82%)
- Carpooled: 766 (14%)
- Subway or elevated: 2 (0%)
- Taxi: 8 (0%)
- Motorcycle: 2 (0%)
- Bicycle: 8 (0%)
- Walked: 87 (2%)
- Other means: 46 (1%)
- Worked at home: 70 (1%)
Most commonly used house heating fuel:
- Electricity (81%)
- Bottled, tank, or LP gas (13%)
- Fuel oil, kerosene, etc. (4%)
- Wood (1%)
- Utility gas (1%)
33 people in other noninstitutional group quarters
8 people in other group homes
95.7% of residents of Stump Sound township speak English at home.
2.2% of residents speak Spanish at home (74% speak English very well, 15% speak English well, 10% speak English not well, 1% don't speak English at all).
1.5% of residents speak other Indo-European language at home (78% speak English very well, 9% speak English well, 13% speak English not well).
0.5% of residents speak Asian or Pacific Island language at home (64% speak English very well, 13% speak English well, 24% speak English not well).
Household type by relationship:
Households: 11,920- In family households: 10,184 (2,780 male householders, 700 female householders)
2,843 spouses, 3,156 children (2,709 natural, 118 adopted, 329 stepchildren), 247 grandchildren, 75 brothers or sisters, 84 parents, 79 other relatives, 220 non-relatives
- In nonfamily households: 1,736 (866 male householders (675 living alone)), 541 female householders (474 living alone)), 329 nonrelatives
- In group quarters: 40 (0 institutionalized population)
Size of family households: 1,752 2-persons, 781 3-persons, 621 4-persons, 227 5-persons, 54 6-persons, 45 7-or-more-persons,
Size of nonfamily households: 1,149 1-person, 192 2-persons, 59 3-persons, 3 4-persons, 4 5-persons,
1,962 married couples with children.
650 single-parent households (199 men, 451 women).
Private vs. public school enrollment:
Students in private schools in grades 1 to 8 (elementary and middle school): 27
| Here: | 2.1% |
| North Carolina: | 8.2% |
Students in private schools in grades 9 to 12 (high school): 9
| Here: | 1.7% |
| North Carolina: | 6.9% |
Students in private undergraduate colleges: 57
| Here: | 13.4% |
| North Carolina: | 20.2% |