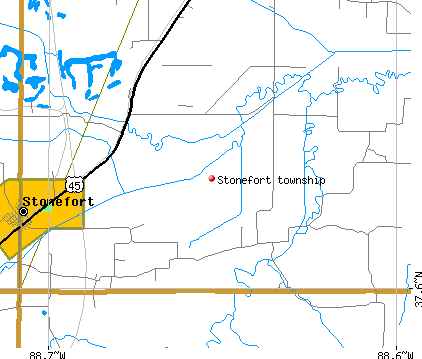
Stonefort township, Saline County, Illinois (IL) detailed profile
Land area: 17.7 sq. mi.
Water area: 0.0 sq. mi.
Population: 379 (all rural)
| Males: 192 | |
| Females: 187 |
Occupied houses/apartments: 379 (337 owner occupied, 42 renter occupied)
| % of renters here: | 11% |
| State: | 33% |
Races in Stonefort township:
- White Non-Hispanic: 98.9%
- Black: 0.8%
Median age of males: 42.2
Median age of females: 39.8
Discuss Illinois on our huge forum. We have over 16 million posts!
Average household size: 2.48
| Stonefort township: | 2.5 people |
| Illinois: | 2.6 people |
Average family size: 2.98
| Stonefort township: | $36,749 |
| Illinois: | $56,210 |
| Here: | $382 |
| State: | $772 |
Estimated median house or condo value in 2013: $65,589 (it was $46,600 in 2000)
| : | $65,589 |
| Illinois: | $169,600 |
| Population density: 21 people per square mile | (low). |
| This township: | 5.9% |
| Whole state: | 10.7% |
| This township: | 2.7% |
| Whole state: | 5.1% |
Cities in this township include: Stonefort.
Notable locations in this township outside city limits:
Churches in Stonefort township include: Little Saline Church (A), Reids Chapel (B). Display/hide their locations on the map
Cemeteries: Jenny Ridge Cemetery (1), Joyner Cemetery (2), Blackman Cemetery (3). Display/hide their locations on the map
Rivers and creeks: Little Saline River (A), Grassy Creek (B), Pond Creek (C). Display/hide their locations on the map
77% of Stonefort township residents lived in the same house 5 years ago.
Out of people who lived in different houses, 69% lived in this county.
Out of people who lived in different counties, 86% lived in Illinois.
Place of birth for U.S.-born residents:
- This state: 280
- Northeast: 0
- Midwest: 24
- South: 33
- West: 0
Median price asked for vacant for-sale houses in 2000: $9,999
Percentage of households with unmarried partners: 2.0%
No gay or lesbian households reported
Housing units in structures:
- One, detached: 101
- 3 or 4: 6
- Mobile homes: 58
Median worth of mobile homes: $26,800
Housing units in Stonefort township with a mortgage: 26 (0 second mortgage, 0 home equity loan, 0 both second mortgage and home equity loan)
Houses without a mortgage: 42
- Construction (27%)
- Public administration (21%)
- Social assistance (14%)
- Finance and insurance (8%)
- Educational services (8%)
- Health care (8%)
- Mining, quarrying, and oil and gas extraction (6%)
- Health care (25%)
- Department and other general merchandise stores (22%)
- Real estate and rental and leasing (18%)
- Personal and laundry services (16%)
- Public administration (12%)
- Accommodation and food services (4%)
- Religious, grantmaking, civic, professional, and similar organizations (4%)
- Law enforcement workers including supervisors (17%)
- Electrical equipment mechanics and other installation, maintenance, and repair occupations including supervisors (10%)
- Construction trades workers except carpenters, electricians, painters, plumbers, and construction laborers (9%)
- Building and grounds cleaning and maintenance occupations (8%)
- Financial clerks except bookkeeping, accounting, and auditing clerks (8%)
- Construction laborers (8%)
- Driver/sales workers and truck drivers (8%)
- Health technologists and technicians (22%)
- Other management occupations except farmers and farm managers (18%)
- Personal appearance workers (16%)
- Business operations specialists (12%)
- Retail sales workers except cashiers (12%)
- Secretaries and administrative assistants (8%)
- Other teachers and instructors, education, training, and library occupations (6%)
Most common first ancestries reported in Stonefort township:
- United States or American (58.2%)
- English (11.8%)
- Irish (10.0%)
- German (7.1%)
- French (except Basque) (3.5%)
- Portuguese (2.9%)
- Polish (1.8%)
Means of transportation to work:
- Drove a car alone: 113 (92%)
- Carpooled: 10 (8%)
Most commonly used house heating fuel:
- Electricity (55%)
- Bottled, tank, or LP gas (40%)
- Wood (5%)
98.4% of residents of Stonefort township speak English at home.
1.6% of residents speak other Indo-European language at home (100% speak English very well).
Household type by relationship:
Households: 337- In family households: 300 (92 male householders, 15 female householders)
101 spouses, 79 children (71 natural, 0 adopted, 8 stepchildren), 2 grandchildren, 0 brothers or sisters, 5 parents, 6 other relatives, 0 non-relatives
- In nonfamily households: 37 (19 male householders (19 living alone)), 18 female householders (18 living alone)), 0 nonrelatives
Size of family households: 56 2-persons, 24 3-persons, 27 4-persons,
Size of nonfamily households: 37 1-person,
76 married couples with children.
19 single-parent households (6 men, 13 women).
Private vs. public school enrollment:
Students in private schools in grades 1 to 8 (elementary and middle school): 16
| Here: | 69.6% |
| Illinois: | 13.4% |
Students in private schools in grades 9 to 12 (high school): 0
| Here: | 0.0% |
| Illinois: | 11.1% |
Students in private undergraduate colleges: 0
| Here: | 0.0% |
| Illinois: | 25.8% |