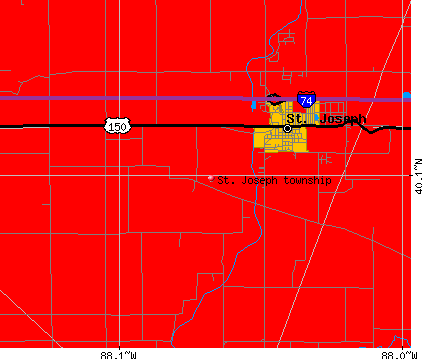
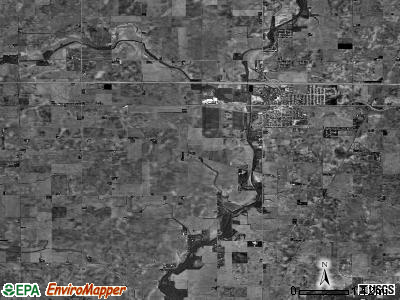
St. Joseph township, Champaign County, Illinois (IL) detailed profile
Number of foreign born residents: 1 (37% naturalized citizens)
| St. Joseph township: | 1.3% |
| Whole state: | 12.3% |
61% of St. Joseph township residents lived in the same house 5 years ago.
Out of people who lived in different houses, 71% lived in this county.
Out of people who lived in different counties, 70% lived in Illinois.
Place of birth for U.S.-born residents:
- This state: 3712
- Northeast: 49
- Midwest: 480
- South: 165
- West: 106
Median price asked for vacant for-sale houses in 2000: $85,000
Percentage of households with unmarried partners: 4.2%
Likely homosexual households (counted as self-reported same-sex unmarried-partner households)
- Lesbian couples: 0.3% of all households
- Gay men: 0.1% of all households
6 people in homes for the physically handicapped
Housing units in structures:
- One, detached: 1,562
- One, attached: 31
- Two: 74
- 3 or 4: 43
- 5 to 9: 29
- 10 to 19: 12
- 20 to 49: 9
- Mobile homes: 12
Median worth of mobile homes: $9,999
Housing units in St. Joseph township with a mortgage: 997 (103 second mortgage, 123 home equity loan, 0 both second mortgage and home equity loan)
Houses without a mortgage: 339
- Educational services (16%)
- Construction (12%)
- Agriculture, forestry, fishing and hunting (6%)
- Public administration (6%)
- Professional, scientific, and technical services (4%)
- Health care (3%)
- Metal and metal products (3%)
- Educational services (27%)
- Health care (21%)
- Public administration (6%)
- Social assistance (5%)
- Finance and insurance (5%)
- Food and beverage stores (4%)
- Professional, scientific, and technical services (4%)
- Other management occupations except farmers and farm managers (8%)
- Other sales and related workers including supervisors (6%)
- Construction trades workers except carpenters, electricians, painters, plumbers, and construction laborers (5%)
- Electrical equipment mechanics and other installation, maintenance, and repair occupations including supervisors (4%)
- Vehicle and mobile equipment mechanics, installers, and repairers (4%)
- Metal workers and plastic workers (3%)
- Law enforcement workers including supervisors (3%)
- Secretaries and administrative assistants (12%)
- Registered nurses (8%)
- Preschool, kindergarten, elementary and middle school teachers (7%)
- Other office and administrative support workers including supervisors (6%)
- Other management occupations except farmers and farm managers (4%)
- Other sales and related workers including supervisors (4%)
- Bookkeeping, accounting, and auditing clerks (3%)
Most common first ancestries reported in St. Joseph township:
- German (36.3%)
- English (14.7%)
- United States or American (13.6%)
- Irish (9.2%)
- French (except Basque) (3.0%)
- Italian (2.9%)
- Swedish (2.3%)
Most common places of birth for the foreign-born residents:
- Japan (17%)
- Indonesia (14%)
- Guatemala (14%)
- Austria (8%)
- Netherlands (8%)
- Other Western Europe (7%)
- Romania (7%)
Means of transportation to work:
- Drove a car alone: 2,179 (86%)
- Carpooled: 212 (8%)
- Bus or trolley bus: 6 (0%)
- Motorcycle: 3 (0%)
- Walked: 18 (1%)
- Other means: 28 (1%)
- Worked at home: 94 (4%)
Most commonly used house heating fuel:
- Utility gas (71%)
- Electricity (18%)
- Bottled, tank, or LP gas (10%)
- Fuel oil, kerosene, etc. (1%)
6 people in homes for the physically handicapped
97.6% of residents of St. Joseph township speak English at home.
1.1% of residents speak Spanish at home (73% speak English very well, 27% speak English well).
0.5% of residents speak other Indo-European language at home (86% speak English very well, 14% speak English not well).
0.7% of residents speak Asian or Pacific Island language at home (54% speak English very well, 46% speak English well).
0.2% of residents speak other language at home (25% speak English not well, 75% don't speak English at all).
Household type by relationship:
Households: 4,573- In family households: 4,097 (1,135 male householders, 211 female householders)
1,181 spouses, 1,424 children (1,307 natural, 39 adopted, 78 stepchildren), 19 grandchildren, 13 brothers or sisters, 3 parents, 24 other relatives, 87 non-relatives
- In nonfamily households: 476 (151 male householders (118 living alone)), 252 female householders (238 living alone)), 73 nonrelatives
- In group quarters: 6 (0 institutionalized population)
Size of family households: 570 2-persons, 332 3-persons, 302 4-persons, 138 5-persons, 4 7-or-more-persons,
Size of nonfamily households: 356 1-person, 36 2-persons, 3 3-persons, 8 4-persons,
1,068 married couples with children.
191 single-parent households (39 men, 152 women).
Private vs. public school enrollment:
Students in private schools in grades 1 to 8 (elementary and middle school): 24
| Here: | 4.1% |
| Illinois: | 13.4% |
Students in private schools in grades 9 to 12 (high school): 0
| Here: | 0.0% |
| Illinois: | 11.1% |
Students in private undergraduate colleges: 0
| Here: | 0.0% |
| Illinois: | 25.8% |