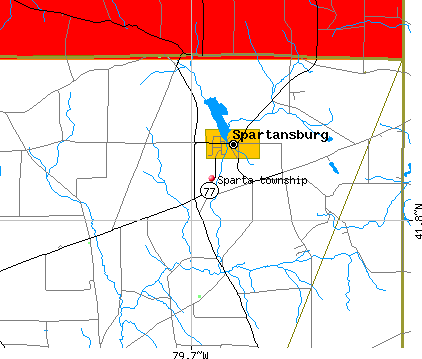
Sparta township, Crawford County, Pennsylvania (PA) detailed profile
Number of foreign born residents: 1 (21% naturalized citizens)
| Sparta township: | 1.4% |
| Whole state: | 4.1% |
75% of Sparta township residents lived in the same house 5 years ago.
Out of people who lived in different houses, 46% lived in this county.
Out of people who lived in different counties, 90% lived in Pennsylvania.
Place of birth for U.S.-born residents:
- This state: 1471
- Northeast: 34
- Midwest: 180
- South: 10
- West: 3
Percentage of households with unmarried partners: 2.9%
Likely homosexual households (counted as self-reported same-sex unmarried-partner households)
- Lesbian couples: 0.4% of all households
- Gay men: 0.0% of all households
4 people in other noninstitutional group quarters
Housing units in structures:
- One, detached: 415
- One, attached: 18
- Two: 5
- Mobile homes: 111
- Boats, RVs, vans, etc.: 3
Median worth of mobile homes: $26,000
Housing units in Sparta township with a mortgage: 91 (7 second mortgage, 10 home equity loan, 0 both second mortgage and home equity loan)
Houses without a mortgage: 79
- Wood products (23%)
- Agriculture, forestry, fishing and hunting (19%)
- Construction (9%)
- Metal and metal products (8%)
- Plastics and rubber products (6%)
- Truck transportation (3%)
- Motor vehicle and parts dealers (2%)
- Health care (16%)
- Accommodation and food services (10%)
- Agriculture, forestry, fishing and hunting (8%)
- Plastics and rubber products (8%)
- Educational services (5%)
- Food and beverage stores (5%)
- Furniture and related product manufacturing (4%)
- Laborers and material movers, hand (12%)
- Metal workers and plastic workers (10%)
- Woodworkers (9%)
- Other production occupations including supervisors (8%)
- Driver/sales workers and truck drivers (7%)
- Fishing and hunting, and forest and logging workers (7%)
- Farmers and farm managers (6%)
- Other production occupations including supervisors (15%)
- Cashiers (7%)
- Nursing, psychiatric, and home health aides (6%)
- Other office and administrative support workers including supervisors (5%)
- Farmers and farm managers (5%)
- Secretaries and administrative assistants (5%)
- Other food preparation and serving workers including supervisors (4%)
Most common first ancestries reported in Sparta township:
- German (28.1%)
- United States or American (21.6%)
- Pennsylvania German (18.1%)
- English (8.3%)
- Polish (4.0%)
- Irish (3.9%)
- Russian (2.2%)
Most common places of birth for the foreign-born residents:
- Russia (100%)
Means of transportation to work:
- Drove a car alone: 339 (55%)
- Carpooled: 153 (25%)
- Taxi: 7 (1%)
- Walked: 24 (4%)
- Other means: 23 (4%)
- Worked at home: 70 (11%)
Most commonly used house heating fuel:
- Wood (40%)
- Bottled, tank, or LP gas (27%)
- Fuel oil, kerosene, etc. (24%)
- Utility gas (5%)
- Electricity (2%)
- Other fuel (1%)
4 people in other noninstitutional group quarters
66.8% of residents of Sparta township speak English at home.
0.6% of residents speak Spanish at home (100% speak English very well).
32.4% of residents speak other Indo-European language at home (53% speak English very well, 39% speak English well, 8% speak English not well, 1% don't speak English at all).
0.1% of residents speak Asian or Pacific Island language at home (100% speak English very well).
0.1% of residents speak other language at home (100% speak English very well).
Household type by relationship:
Households: 1,720- In family households: 1,620 (364 male householders, 37 female householders)
372 spouses, 787 children (750 natural, 4 adopted, 33 stepchildren), 13 grandchildren, 0 brothers or sisters, 5 parents, 7 other relatives, 35 non-relatives
- In nonfamily households: 100 (51 male householders (47 living alone)), 38 female householders (37 living alone)), 11 nonrelatives
- In group quarters: 5 (0 institutionalized population)
Size of family households: 135 2-persons, 71 3-persons, 88 4-persons, 34 5-persons, 16 6-persons, 57 7-or-more-persons,
Size of nonfamily households: 84 1-person, 3 2-persons, 2 5-persons,
608 married couples with children.
39 single-parent households (18 men, 21 women).
Private vs. public school enrollment:
Students in private schools in grades 1 to 8 (elementary and middle school): 83
| Here: | 28.2% |
| Pennsylvania: | 16.0% |
Students in private schools in grades 9 to 12 (high school): 8
| Here: | 7.6% |
| Pennsylvania: | 13.1% |
Students in private undergraduate colleges: 0
| Here: | 0.0% |
| Pennsylvania: | 37.3% |