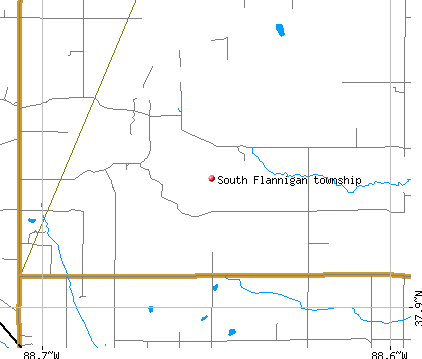
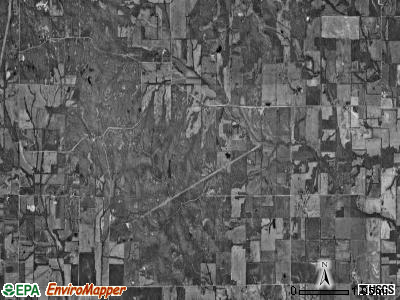
South Flannigan township, Hamilton County, Illinois (IL) detailed profile
Land area: 18.4 sq. mi.
Water area: 0.0 sq. mi.
Population: 139 (all rural)
| Males: 69 | |
| Females: 70 |
Occupied houses/apartments: 139 (123 owner occupied, 16 renter occupied)
| % of renters here: | 12% |
| State: | 33% |
Races in South Flannigan township:
- White Non-Hispanic: 97.8%
- Some other race: 1.4%
Median age of males: 41.3
Median age of females: 38.0
Discuss Illinois on our huge forum. We have over 16 million posts!
Average household size: 2.44
| South Flannigan township: | 2.4 people |
| Illinois: | 2.6 people |
Average family size: 2.79
| South Flannigan township: | $38,020 |
| Illinois: | $56,210 |
| Here: | $341 |
| State: | $772 |
Estimated median house or condo value in 2013: $67,728 (it was $48,100 in 2000)
| : | $67,728 |
| Illinois: | $169,600 |
| Population density: 8 people per square mile | (very low). |
| This township: | 12.5% |
| Whole state: | 10.7% |
| This township: | 1.5% |
| Whole state: | 5.1% |
Notable locations in this township outside city limits:
Notable location: South Flannigan Townhall (A). Display/hide its location on the map
Churches in South Flannigan township include: Rector Church (A), Liberty Church (B). Display/hide their locations on the map
Cemeteries: Winn Cemetery (1), Good Hope Cemetery (2). Display/hide their locations on the map
82% of South Flannigan township residents lived in the same house 5 years ago.
Out of people who lived in different houses, 25% lived in this county.
Out of people who lived in different counties, 89% lived in Illinois.
Place of birth for U.S.-born residents:
- This state: 115
- Northeast: 2
- Midwest: 12
- South: 7
- West: 0
Median price asked for vacant for-sale houses in 2000: $85,000
Percentage of households with unmarried partners: 3.5%
No gay or lesbian households reported
Housing units in structures:
- One, detached: 59
- Mobile homes: 24
Median worth of mobile homes: $21,700
Housing units in South Flannigan township with a mortgage: 10 (1 second mortgage, 0 home equity loan, 0 both second mortgage and home equity loan)
Houses without a mortgage: 7
- Finance and insurance (30%)
- Mining, quarrying, and oil and gas extraction (12%)
- Truck transportation (12%)
- Transportation equipment (9%)
- Agriculture, forestry, fishing and hunting (6%)
- Plastics and rubber products (6%)
- Machinery (6%)
- Educational services (29%)
- Health care (29%)
- Accommodation and food services (18%)
- Finance and insurance (15%)
- Clothing and accessories, including shoe, stores (6%)
- Financial managers (30%)
- Driver/sales workers and truck drivers (12%)
- Electrical equipment mechanics and other installation, maintenance, and repair occupations including supervisors (9%)
- Farmers and farm managers (6%)
- Counselors, social workers, and other community and social service specialists (6%)
- Other sales and related workers including supervisors (6%)
- Material recording, scheduling, dispatching, and distributing workers (6%)
- Other office and administrative support workers including supervisors (21%)
- Other management occupations except farmers and farm managers (12%)
- Other sales and related workers including supervisors (12%)
- Preschool, kindergarten, elementary and middle school teachers (9%)
- Health technologists and technicians (9%)
- Sales representatives, services, wholesale and manufacturing (9%)
- Counselors, social workers, and other community and social service specialists (6%)
Most common first ancestries reported in South Flannigan township:
- United States or American (24.5%)
- Scotch-Irish (23.5%)
- German (18.4%)
- English (14.3%)
- Irish (7.1%)
- Scottish (2.0%)
Means of transportation to work:
- Drove a car alone: 56 (84%)
- Carpooled: 7 (10%)
- Other means: 4 (6%)
Most commonly used house heating fuel:
- Bottled, tank, or LP gas (53%)
- Wood (28%)
- Electricity (16%)
- Fuel oil, kerosene, etc. (3%)
97.7% of residents of South Flannigan township speak English at home.
2.3% of residents speak Spanish at home (100% speak English very well).
Household type by relationship:
Households: 136- In family households: 103 (30 male householders, 9 female householders)
32 spouses, 20 children (20 natural, 0 adopted, 0 stepchildren), 4 grandchildren, 3 brothers or sisters, 0 parents, 2 other relatives, 3 non-relatives
- In nonfamily households: 33 (26 male householders (26 living alone)), 7 female householders (7 living alone)), 0 nonrelatives
Size of family households: 19 2-persons, 14 3-persons, 6 4-persons,
Size of nonfamily households: 33 1-person,
18 married couples with children.
12 single-parent households (0 men, 12 women).
Private vs. public school enrollment:
Students in private schools in grades 1 to 8 (elementary and middle school): 0
| Here: | 0.0% |
| Illinois: | 13.4% |
Students in private schools in grades 9 to 12 (high school): 0
| Here: | 0.0% |
| Illinois: | 11.1% |