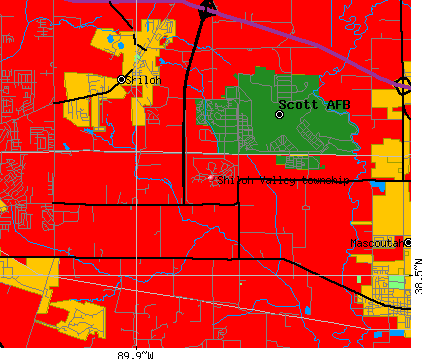
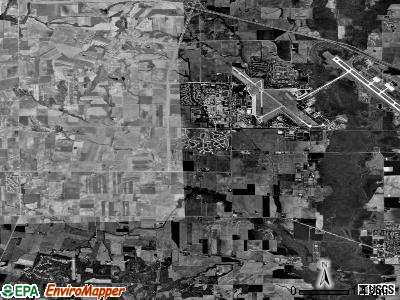
Shiloh Valley township, St. Clair County, Illinois (IL) detailed profile
Number of foreign born residents: 4 (67% naturalized citizens)
| Shiloh Valley township: | 4.0% |
| Whole state: | 12.3% |
29% of Shiloh Valley township residents lived in the same house 5 years ago.
Out of people who lived in different houses, 27% lived in this county.
Out of people who lived in different counties, 10% lived in Illinois.
Place of birth for U.S.-born residents:
- This state: 3212
- Northeast: 765
- Midwest: 2093
- South: 2192
- West: 933
Percentage of households with unmarried partners: 2.6%
Likely homosexual households (counted as self-reported same-sex unmarried-partner households)
- Lesbian couples: 0.2% of all households
- Gay men: 0.1% of all households
427 people in military barracks, etc.
Housing units in structures:
- One, detached: 1,226
- One, attached: 1,241
- Two: 198
- 3 or 4: 129
- 5 to 9: 18
- 10 to 19: 9
- Mobile homes: 460
- Boats, RVs, vans, etc.: 8
Median worth of mobile homes: $21,400
Housing units in Shiloh Valley township with a mortgage: 738 (89 second mortgage, 79 home equity loan, 0 both second mortgage and home equity loan)
Houses without a mortgage: 269
- Public administration (13%)
- Construction (10%)
- Health care (9%)
- Accommodation and food services (6%)
- Professional, scientific, and technical services (6%)
- Transportation equipment (4%)
- Educational services (4%)
- Health care (14%)
- Finance and insurance (11%)
- Professional, scientific, and technical services (9%)
- Department and other general merchandise stores (9%)
- Social assistance (8%)
- Educational services (7%)
- Public administration (6%)
- Other management occupations except farmers and farm managers (6%)
- Material recording, scheduling, dispatching, and distributing workers (5%)
- Electrical equipment mechanics and other installation, maintenance, and repair occupations including supervisors (5%)
- Carpenters (5%)
- Retail sales workers except cashiers (4%)
- Laborers and material movers, hand (4%)
- Other production occupations including supervisors (3%)
- Retail sales workers except cashiers (7%)
- Other office and administrative support workers including supervisors (6%)
- Cashiers (6%)
- Child care workers (6%)
- Secretaries and administrative assistants (5%)
- Other sales and related workers including supervisors (5%)
- Health technologists and technicians (5%)
Most common first ancestries reported in Shiloh Valley township:
- German (23.3%)
- Irish (11.2%)
- United States or American (10.0%)
- English (5.7%)
- Italian (3.5%)
- French (except Basque) (3.4%)
- European (2.2%)
Most common places of birth for the foreign-born residents:
- Philippines (26%)
- Korea (16%)
- Thailand (13%)
- Canada (10%)
- Germany (6%)
- United Kingdom (6%)
- Portugal (4%)
Means of transportation to work:
- Drove a car alone: 3,999 (81%)
- Carpooled: 566 (11%)
- Bus or trolley bus: 19 (0%)
- Subway or elevated: 7 (0%)
- Motorcycle: 12 (0%)
- Bicycle: 15 (0%)
- Walked: 203 (4%)
- Worked at home: 112 (2%)
Most commonly used house heating fuel:
- Utility gas (60%)
- Electricity (33%)
- Bottled, tank, or LP gas (7%)
427 people in military barracks, etc.
94.4% of residents of Shiloh Valley township speak English at home.
1.7% of residents speak Spanish at home (69% speak English very well, 13% speak English well, 18% speak English not well).
1.4% of residents speak other Indo-European language at home (80% speak English very well, 15% speak English well, 5% don't speak English at all).
2.4% of residents speak Asian or Pacific Island language at home (53% speak English very well, 33% speak English well, 11% speak English not well, 3% don't speak English at all).
Household type by relationship:
Households: 9,683- In family households: 9,130 (2,376 male householders, 349 female householders)
2,314 spouses, 3,880 children (3,552 natural, 100 adopted, 228 stepchildren), 43 grandchildren, 10 brothers or sisters, 6 parents, 47 other relatives, 105 non-relatives
- In nonfamily households: 553 (208 male householders (141 living alone)), 243 female householders (224 living alone)), 102 nonrelatives
- In group quarters: 430 (0 institutionalized population)
Size of family households: 779 2-persons, 687 3-persons, 765 4-persons, 342 5-persons, 131 6-persons, 21 7-or-more-persons,
Size of nonfamily households: 365 1-person, 81 2-persons, 5 4-persons,
3,077 married couples with children.
431 single-parent households (127 men, 304 women).
Private vs. public school enrollment:
Students in private schools in grades 1 to 8 (elementary and middle school): 190
| Here: | 11.4% |
| Illinois: | 13.4% |
Students in private schools in grades 9 to 12 (high school): 33
| Here: | 5.6% |
| Illinois: | 11.1% |
Students in private undergraduate colleges: 94
| Here: | 11.2% |
| Illinois: | 25.8% |