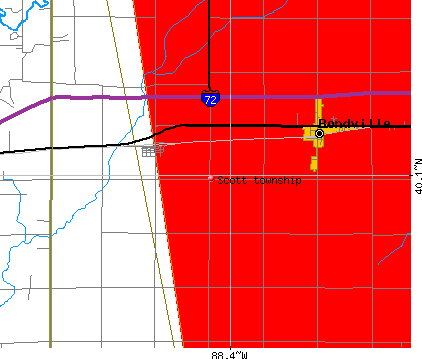
Scott township, Champaign County, Illinois (IL) detailed profile
Number of foreign born residents: 0 (50% naturalized citizens)
| Scott township: | 0.3% |
| Whole state: | 12.3% |
61% of Scott township residents lived in the same house 5 years ago.
Out of people who lived in different houses, 56% lived in this county.
Out of people who lived in different counties, 59% lived in Illinois.
Place of birth for U.S.-born residents:
- This state: 868
- Northeast: 57
- Midwest: 77
- South: 49
- West: 21
Median price asked for vacant for-sale houses in 2000: $45,000
Percentage of households with unmarried partners: 10.5%
Likely homosexual households (counted as self-reported same-sex unmarried-partner households)
- Lesbian couples: 0.2% of all households
- Gay men: 0.0% of all households
Housing units in structures:
- One, detached: 359
- One, attached: 2
- Two: 7
- 5 to 9: 3
- Mobile homes: 80
Median worth of mobile homes: $11,300
Housing units in Scott township with a mortgage: 169 (44 second mortgage, 18 home equity loan, 0 both second mortgage and home equity loan)
Houses without a mortgage: 68
- Educational services (10%)
- Agriculture, forestry, fishing and hunting (9%)
- Furniture and home furnishings, and household appliance stores (6%)
- Other transportation, and support activities, and couriers (6%)
- Construction (5%)
- Real estate and rental and leasing (5%)
- Publishing, and motion picture and sound recording industries (5%)
- Educational services (14%)
- Accommodation and food services (9%)
- Administrative and support and waste management services (8%)
- Sporting goods, camera, and hobby and toy stores (7%)
- Food (7%)
- Health care (6%)
- Professional, scientific, and technical services (5%)
- Farmers and farm managers (7%)
- Electrical equipment mechanics and other installation, maintenance, and repair occupations including supervisors (6%)
- Laborers and material movers, hand (5%)
- Bus drivers (5%)
- Other management occupations except farmers and farm managers (5%)
- Material recording, scheduling, dispatching, and distributing workers (4%)
- Religious workers (4%)
- Secretaries and administrative assistants (12%)
- Building and grounds cleaning and maintenance occupations (7%)
- Advertising, marketing, promotions, public relations, and sales managers (6%)
- Other office and administrative support workers including supervisors (4%)
- Printing workers (4%)
- Cooks and food preparation workers (4%)
- Retail sales workers except cashiers (4%)
Most common first ancestries reported in Scott township:
- Irish (26.3%)
- German (21.7%)
- English (12.4%)
- Dutch (5.9%)
- United States or American (5.5%)
- British (4.8%)
- Scottish (4.8%)
Most common places of birth for the foreign-born residents:
- Korea (50%)
- Mexico (50%)
Means of transportation to work:
- Drove a car alone: 455 (74%)
- Carpooled: 97 (16%)
- Bus or trolley bus: 16 (3%)
- Walked: 23 (4%)
- Worked at home: 25 (4%)
Most commonly used house heating fuel:
- Utility gas (70%)
- Bottled, tank, or LP gas (22%)
- Electricity (5%)
- Fuel oil, kerosene, etc. (3%)
97.5% of residents of Scott township speak English at home.
0.6% of residents speak Spanish at home (67% speak English very well, 33% speak English well).
1.6% of residents speak other Indo-European language at home (88% speak English very well, 13% speak English well).
0.3% of residents speak Asian or Pacific Island language at home (100% speak English very well).
Household type by relationship:
Households: 1,077- In family households: 919 (235 male householders, 42 female householders)
222 spouses, 365 children (330 natural, 0 adopted, 35 stepchildren), 8 grandchildren, 0 brothers or sisters, 6 parents, 0 other relatives, 41 non-relatives
- In nonfamily households: 158 (58 male householders (19 living alone)), 46 female householders (41 living alone)), 54 nonrelatives
Size of family households: 104 2-persons, 58 3-persons, 82 4-persons, 20 5-persons, 7 6-persons, 6 7-or-more-persons,
Size of nonfamily households: 60 1-person, 42 2-persons, 2 4-persons,
240 married couples with children.
59 single-parent households (27 men, 32 women).
Private vs. public school enrollment:
Students in private schools in grades 1 to 8 (elementary and middle school): 43
| Here: | 23.1% |
| Illinois: | 13.4% |
Students in private schools in grades 9 to 12 (high school): 9
| Here: | 18.4% |
| Illinois: | 11.1% |
Students in private undergraduate colleges: 0
| Here: | 0.0% |
| Illinois: | 25.8% |