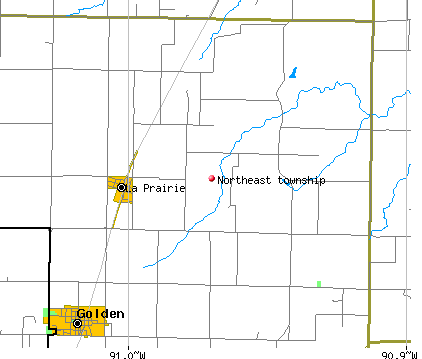
Northeast township, Adams County, Illinois (IL) detailed profile
Number of foreign born residents: 0 (100% naturalized citizens)
| Northeast township: | 0.4% |
| Whole state: | 12.3% |
65% of Northeast township residents lived in the same house 5 years ago.
Out of people who lived in different houses, 72% lived in this county.
Out of people who lived in different counties, 65% lived in Illinois.
Place of birth for U.S.-born residents:
- This state: 782
- Northeast: 6
- Midwest: 100
- South: 12
- West: 9
Median price asked for vacant for-sale houses in 2000: $35,800
Percentage of households with unmarried partners: 3.5%
Likely homosexual households (counted as self-reported same-sex unmarried-partner households)
- Lesbian couples: 0.3% of all households
- Gay men: 0.0% of all households
42 people in nursing homes
Housing units in structures:
- One, detached: 372
- One, attached: 3
- Two: 14
- 3 or 4: 10
- Mobile homes: 20
Median worth of mobile homes: $30,000
Housing units in Northeast township with a mortgage: 122 (9 second mortgage, 4 home equity loan, 0 both second mortgage and home equity loan)
Houses without a mortgage: 131
- Construction (13%)
- Agriculture, forestry, fishing and hunting (12%)
- Truck transportation (10%)
- Repair and maintenance (9%)
- Transportation equipment (6%)
- Food (6%)
- Broadcasting, internet publishing, and telecommunications services (6%)
- Health care (23%)
- Transportation equipment (15%)
- Educational services (10%)
- Accommodation and food services (7%)
- Food and beverage stores (6%)
- Broadcasting, internet publishing, and telecommunications services (6%)
- Public administration (4%)
- Driver/sales workers and truck drivers (12%)
- Vehicle and mobile equipment mechanics, installers, and repairers (11%)
- Other management occupations except farmers and farm managers (5%)
- Engineers (5%)
- Farmers and farm managers (5%)
- Food processing workers (5%)
- Agricultural workers including supervisors (4%)
- Cooks and food preparation workers (10%)
- Assemblers and fabricators (8%)
- Other food preparation and serving workers including supervisors (7%)
- Counselors, social workers, and other community and social service specialists (7%)
- Other office and administrative support workers including supervisors (6%)
- Other production occupations including supervisors (6%)
- Customer service representatives (4%)
Most common first ancestries reported in Northeast township:
- German (67.3%)
- United States or American (11.0%)
- Irish (6.1%)
- English (5.4%)
- Swedish (4.0%)
- French (except Basque) (1.6%)
- Scotch-Irish (1.6%)
Most common places of birth for the foreign-born residents:
- United Kingdom (50%)
- Germany (50%)
Means of transportation to work:
- Drove a car alone: 321 (72%)
- Carpooled: 56 (13%)
- Motorcycle: 5 (1%)
- Walked: 23 (5%)
- Other means: 5 (1%)
- Worked at home: 38 (8%)
Most commonly used house heating fuel:
- Utility gas (58%)
- Electricity (23%)
- Bottled, tank, or LP gas (11%)
- Fuel oil, kerosene, etc. (6%)
- Wood (1%)
- No fuel used (1%)
- Other fuel (1%)
42 people in nursing homes
98.0% of residents of Northeast township speak English at home.
0.2% of residents speak Spanish at home (100% speak English very well).
1.8% of residents speak other Indo-European language at home (60% speak English very well, 40% speak English well).
Household type by relationship:
Households: 871- In family households: 729 (210 male householders, 36 female householders)
202 spouses, 251 children (222 natural, 8 adopted, 21 stepchildren), 7 grandchildren, 2 brothers or sisters, 0 parents, 2 other relatives, 19 non-relatives
- In nonfamily households: 142 (59 male householders (47 living alone)), 74 female householders (74 living alone)), 9 nonrelatives
- In group quarters: 42 (all institutionalized)
Size of family households: 125 2-persons, 49 3-persons, 36 4-persons, 21 5-persons, 11 6-persons, 4 7-or-more-persons,
Size of nonfamily households: 121 1-person, 12 2-persons,
192 married couples with children.
49 single-parent households (20 men, 29 women).
Private vs. public school enrollment:
Students in private schools in grades 1 to 8 (elementary and middle school): 10
| Here: | 10.1% |
| Illinois: | 13.4% |
Students in private schools in grades 9 to 12 (high school): 0
| Here: | 0.0% |
| Illinois: | 11.1% |
Students in private undergraduate colleges: 2
| Here: | 6.5% |
| Illinois: | 25.8% |