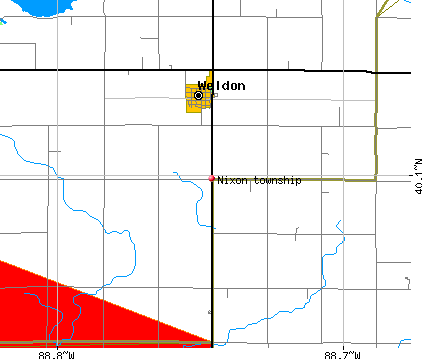
Nixon township, De Witt County, Illinois (IL) detailed profile
Number of foreign born residents: 0 (100% naturalized citizens)
| Nixon township: | 0.3% |
| Whole state: | 12.3% |
59% of Nixon township residents lived in the same house 5 years ago.
Out of people who lived in different houses, 36% lived in this county.
Out of people who lived in different counties, 89% lived in Illinois.
Place of birth for U.S.-born residents:
- This state: 481
- Northeast: 15
- Midwest: 32
- South: 35
- West: 9
Median price asked for vacant for-sale houses in 2000: $37,500
Percentage of households with unmarried partners: 5.8%
Likely homosexual households (counted as self-reported same-sex unmarried-partner households)
- Lesbian couples: 0.4% of all households
- Gay men: 0.0% of all households
Housing units in structures:
- One, detached: 226
- One, attached: 2
- Mobile homes: 26
Median worth of mobile homes: $23,200
Housing units in Nixon township with a mortgage: 73 (6 second mortgage, 7 home equity loan, 0 both second mortgage and home equity loan)
Houses without a mortgage: 73
- Construction (15%)
- Agriculture, forestry, fishing and hunting (14%)
- Utilities (8%)
- Department and other general merchandise stores (6%)
- Machinery (6%)
- Truck transportation (5%)
- Professional, scientific, and technical services (4%)
- Educational services (14%)
- Finance and insurance (9%)
- Health care (8%)
- Utilities (6%)
- Accommodation and food services (5%)
- Agriculture, forestry, fishing and hunting (4%)
- Truck transportation (4%)
- Driver/sales workers and truck drivers (11%)
- Building and grounds cleaning and maintenance occupations (10%)
- Farmers and farm managers (8%)
- Electrical equipment mechanics and other installation, maintenance, and repair occupations including supervisors (8%)
- Other production occupations including supervisors (8%)
- Metal workers and plastic workers (6%)
- Electricians (5%)
- Material recording, scheduling, dispatching, and distributing workers (7%)
- Secretaries and administrative assistants (7%)
- Other office and administrative support workers including supervisors (7%)
- Information and record clerks except customer service representatives (6%)
- Bus drivers (6%)
- Other sales and related workers including supervisors (5%)
- Financial clerks except bookkeeping, accounting, and auditing clerks (5%)
Most common first ancestries reported in Nixon township:
- English (20.9%)
- German (19.7%)
- United States or American (12.5%)
- Irish (10.4%)
- Italian (4.5%)
- Dutch (4.2%)
- Norwegian (3.3%)
Most common places of birth for the foreign-born residents:
- Canada (100%)
Means of transportation to work:
- Drove a car alone: 212 (78%)
- Carpooled: 28 (10%)
- Bus or trolley bus: 1 (0%)
- Walked: 11 (4%)
- Other means: 1 (0%)
- Worked at home: 20 (7%)
Most commonly used house heating fuel:
- Utility gas (75%)
- Bottled, tank, or LP gas (14%)
- Electricity (9%)
- Fuel oil, kerosene, etc. (2%)
- Other fuel (1%)
98.1% of residents of Nixon township speak English at home.
1.1% of residents speak Spanish at home (100% speak English very well).
0.6% of residents speak Asian or Pacific Island language at home (100% speak English very well).
0.2% of residents speak other language at home (100% speak English well).
Household type by relationship:
Households: 574- In family households: 481 (145 male householders, 22 female householders)
133 spouses, 155 children (132 natural, 0 adopted, 23 stepchildren), 6 grandchildren, 2 brothers or sisters, 2 parents, 4 other relatives, 12 non-relatives
- In nonfamily households: 93 (37 male householders (25 living alone)), 34 female householders (33 living alone)), 22 nonrelatives
Size of family households: 72 2-persons, 41 3-persons, 35 4-persons, 10 5-persons, 6 6-persons, 3 7-or-more-persons,
Size of nonfamily households: 58 1-person, 4 2-persons, 9 3-persons,
107 married couples with children.
22 single-parent households (7 men, 15 women).
Private vs. public school enrollment:
Students in private schools in grades 1 to 8 (elementary and middle school): 5
| Here: | 7.6% |
| Illinois: | 13.4% |
Students in private schools in grades 9 to 12 (high school): 4
| Here: | 16.7% |
| Illinois: | 11.1% |
Students in private undergraduate colleges: 3
| Here: | 18.8% |
| Illinois: | 25.8% |