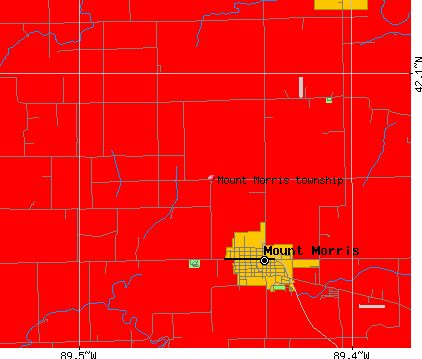
Mount Morris township, Ogle County, Illinois (IL) detailed profile
Number of foreign born residents: 1 (42% naturalized citizens)
| Mount Morris township: | 1.4% |
| Whole state: | 12.3% |
58% of Mount Morris township residents lived in the same house 5 years ago.
Out of people who lived in different houses, 61% lived in this county.
Out of people who lived in different counties, 70% lived in Illinois.
Place of birth for U.S.-born residents:
- This state: 3069
- Northeast: 77
- Midwest: 506
- South: 157
- West: 125
Median price asked for vacant for-sale houses in 2000: $95,000
Percentage of households with unmarried partners: 4.8%
Likely homosexual households (counted as self-reported same-sex unmarried-partner households)
- Lesbian couples: 0.0% of all households
- Gay men: 0.1% of all households
139 people in nursing homes

Housing units in structures:
- One, detached: 1,235
- One, attached: 12
- Two: 72
- 3 or 4: 64
- 5 to 9: 58
- 10 to 19: 49
- 20 to 49: 114
- 50 or more: 12
- Mobile homes: 180
Median worth of mobile homes: $21,400
Housing units in Mount Morris township with a mortgage: 606 (97 second mortgage, 39 home equity loan, 0 both second mortgage and home equity loan)
Houses without a mortgage: 298
- Printing and related support activities (14%)
- Construction (12%)
- Machinery (8%)
- Agriculture, forestry, fishing and hunting (8%)
- Accommodation and food services (3%)
- Finance and insurance (3%)
- Professional, scientific, and technical services (3%)
- Health care (15%)
- Educational services (10%)
- Publishing, and motion picture and sound recording industries (8%)
- Printing and related support activities (7%)
- Miscellaneous nondurable goods merchant wholesalers (6%)
- Other direct selling establishments (5%)
- Accommodation and food services (5%)
- Metal workers and plastic workers (7%)
- Farmers and farm managers (6%)
- Laborers and material movers, hand (6%)
- Building and grounds cleaning and maintenance occupations (6%)
- Other production occupations including supervisors (6%)
- Printing workers (6%)
- Material recording, scheduling, dispatching, and distributing workers (5%)
- Information and record clerks except customer service representatives (8%)
- Other office and administrative support workers including supervisors (8%)
- Secretaries and administrative assistants (6%)
- Laborers and material movers, hand (5%)
- Cooks and food preparation workers (5%)
- Cashiers (4%)
- Other production occupations including supervisors (4%)
Most common first ancestries reported in Mount Morris township:
- German (34.0%)
- United States or American (14.9%)
- Irish (10.7%)
- English (9.7%)
- Dutch (4.7%)
- Swedish (4.6%)
- Italian (3.5%)
Most common places of birth for the foreign-born residents:
- Other South America (33%)
- Mexico (31%)
- United Kingdom (15%)
- Thailand (13%)
- Poland (9%)
Means of transportation to work:
- Drove a car alone: 1,440 (74%)
- Carpooled: 275 (14%)
- Bus or trolley bus: 11 (1%)
- Bicycle: 4 (0%)
- Walked: 127 (7%)
- Other means: 18 (1%)
- Worked at home: 62 (3%)
Most commonly used house heating fuel:
- Utility gas (75%)
- Electricity (13%)
- Bottled, tank, or LP gas (8%)
- Fuel oil, kerosene, etc. (2%)
- Wood (1%)
139 people in nursing homes
97.1% of residents of Mount Morris township speak English at home.
1.4% of residents speak Spanish at home (67% speak English very well, 33% speak English not well).
1.0% of residents speak other Indo-European language at home (100% speak English very well).
0.5% of residents speak Asian or Pacific Island language at home (35% speak English very well, 25% speak English not well, 40% don't speak English at all).
Household type by relationship:
Households: 3,853- In family households: 3,204 (818 male householders, 289 female householders)
864 spouses, 1,152 children (1,069 natural, 24 adopted, 59 stepchildren), 5 grandchildren, 13 brothers or sisters, 23 parents, 0 other relatives, 40 non-relatives
- In nonfamily households: 649 (271 male householders (221 living alone)), 282 female householders (266 living alone)), 96 nonrelatives
- In group quarters: 141 (all institutionalized)
Size of family households: 561 2-persons, 226 3-persons, 209 4-persons, 84 5-persons, 27 6-persons,
Size of nonfamily households: 487 1-person, 52 2-persons, 4 4-persons, 10 6-persons,
695 married couples with children.
238 single-parent households (63 men, 175 women).
Private vs. public school enrollment:
Students in private schools in grades 1 to 8 (elementary and middle school): 2
| Here: | 0.5% |
| Illinois: | 13.4% |
Students in private schools in grades 9 to 12 (high school): 0
| Here: | 0.0% |
| Illinois: | 11.1% |
Students in private undergraduate colleges: 9
| Here: | 9.9% |
| Illinois: | 25.8% |