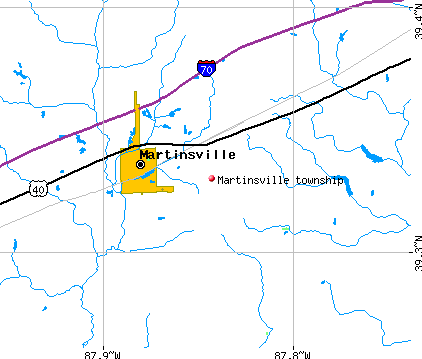
Martinsville township, Clark County, Illinois (IL) detailed profile
Number of foreign born residents: 0 (71% naturalized citizens)
| Martinsville township: | 0.4% |
| Whole state: | 12.3% |
67% of Martinsville township residents lived in the same house 5 years ago.
Out of people who lived in different houses, 62% lived in this county.
Out of people who lived in different counties, 52% lived in Illinois.
Place of birth for U.S.-born residents:
- This state: 895
- Northeast: 10
- Midwest: 683
- South: 84
- West: 33
Median price asked for vacant for-sale houses in 2000: $17,500
Percentage of households with unmarried partners: 3.8%
Likely homosexual households (counted as self-reported same-sex unmarried-partner households)
- Lesbian couples: 0.1% of all households
- Gay men: 0.3% of all households

Housing units in structures:
- One, detached: 639
- Two: 10
- 3 or 4: 52
- 5 to 9: 6
- 10 to 19: 3
- Mobile homes: 131
Median worth of mobile homes: $18,500
Housing units in Martinsville township with a mortgage: 236 (14 second mortgage, 5 home equity loan, 5 both second mortgage and home equity loan)
Houses without a mortgage: 186
- Construction (18%)
- Agriculture, forestry, fishing and hunting (8%)
- Computer and electronic products (6%)
- Truck transportation (5%)
- Metal and metal products (5%)
- Machinery (4%)
- Repair and maintenance (4%)
- Health care (14%)
- Computer and electronic products (10%)
- Educational services (9%)
- Paper (8%)
- Finance and insurance (5%)
- Accommodation and food services (5%)
- Professional, scientific, and technical services (5%)
- Other production occupations including supervisors (9%)
- Metal workers and plastic workers (9%)
- Driver/sales workers and truck drivers (6%)
- Farmers and farm managers (6%)
- Vehicle and mobile equipment mechanics, installers, and repairers (5%)
- Laborers and material movers, hand (5%)
- Construction trades workers except carpenters, electricians, painters, plumbers, and construction laborers (4%)
- Other production occupations including supervisors (11%)
- Secretaries and administrative assistants (7%)
- Other office and administrative support workers including supervisors (6%)
- Financial clerks except bookkeeping, accounting, and auditing clerks (5%)
- Assemblers and fabricators (5%)
- Other sales and related workers including supervisors (4%)
- Information and record clerks except customer service representatives (4%)
Most common first ancestries reported in Martinsville township:
- United States or American (31.2%)
- German (21.0%)
- English (17.8%)
- Irish (11.5%)
- French (except Basque) (3.1%)
- Dutch (2.8%)
- Scotch-Irish (1.6%)
Most common places of birth for the foreign-born residents:
- Germany (71%)
- Italy (29%)
Means of transportation to work:
- Drove a car alone: 634 (78%)
- Carpooled: 116 (14%)
- Walked: 25 (3%)
- Other means: 2 (0%)
- Worked at home: 34 (4%)
Most commonly used house heating fuel:
- Utility gas (67%)
- Bottled, tank, or LP gas (18%)
- Electricity (11%)
- Wood (4%)
98.0% of residents of Martinsville township speak English at home.
0.6% of residents speak Spanish at home (80% speak English very well, 20% speak English well).
1.2% of residents speak other Indo-European language at home (79% speak English very well, 11% speak English well, 11% speak English not well).
0.2% of residents speak other language at home (100% speak English very well).
Household type by relationship:
Households: 1,714- In family households: 1,492 (453 male householders, 68 female householders)
431 spouses, 493 children (417 natural, 8 adopted, 68 stepchildren), 8 grandchildren, 5 brothers or sisters, 8 parents, 4 other relatives, 22 non-relatives
- In nonfamily households: 222 (79 male householders (68 living alone)), 121 female householders (117 living alone)), 22 nonrelatives
Size of family households: 247 2-persons, 125 3-persons, 97 4-persons, 37 5-persons, 15 6-persons,
Size of nonfamily households: 185 1-person, 11 2-persons, 3 4-persons, 1 5-persons,
304 married couples with children.
83 single-parent households (23 men, 60 women).
Private vs. public school enrollment:
Students in private schools in grades 1 to 8 (elementary and middle school): 0
| Here: | 0.0% |
| Illinois: | 13.4% |
Students in private schools in grades 9 to 12 (high school): 2
| Here: | 2.0% |
| Illinois: | 11.1% |
Students in private undergraduate colleges: 1
| Here: | 1.7% |
| Illinois: | 25.8% |