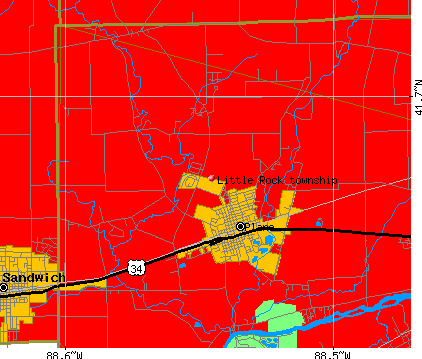
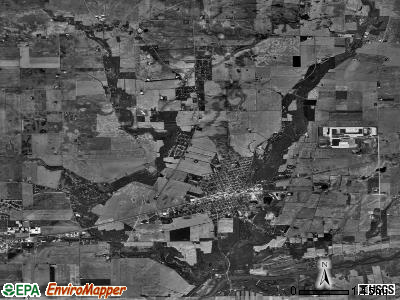
Little Rock township, Kendall County, Illinois (IL) detailed profile
Number of foreign born residents: 13 (51% naturalized citizens)
| Little Rock township: | 13.1% |
| Whole state: | 12.3% |
66% of Little Rock township residents lived in the same house 5 years ago.
Out of people who lived in different houses, 49% lived in this county.
Out of people who lived in different counties, 78% lived in Illinois.
Place of birth for U.S.-born residents:
- This state: 5579
- Northeast: 147
- Midwest: 380
- South: 331
- West: 172
Median price asked for vacant for-sale houses in 2000: $143,800
Percentage of households with unmarried partners: 4.3%
Likely homosexual households (counted as self-reported same-sex unmarried-partner households)
- Lesbian couples: 0.3% of all households
- Gay men: 0.1% of all households
Housing units in structures:
- One, detached: 2,141
- One, attached: 76
- Two: 128
- 3 or 4: 154
- 5 to 9: 70
- 10 to 19: 75
- 20 to 49: 29
- Mobile homes: 10
Median worth of mobile homes: $37,500
Housing units in Little Rock township with a mortgage: 1,272 (112 second mortgage, 145 home equity loan, 0 both second mortgage and home equity loan)
Houses without a mortgage: 509
- Construction (13%)
- Metal and metal products (8%)
- Plastics and rubber products (7%)
- Machinery (7%)
- Accommodation and food services (5%)
- Administrative and support and waste management services (5%)
- Building material and garden equipment and supplies dealers (5%)
- Health care (11%)
- Educational services (11%)
- Finance and insurance (10%)
- Plastics and rubber products (8%)
- Accommodation and food services (5%)
- Professional, scientific, and technical services (4%)
- Metal and metal products (4%)
- Other production occupations including supervisors (11%)
- Driver/sales workers and truck drivers (10%)
- Metal workers and plastic workers (8%)
- Other management occupations except farmers and farm managers (7%)
- Electrical equipment mechanics and other installation, maintenance, and repair occupations including supervisors (7%)
- Laborers and material movers, hand (4%)
- Building and grounds cleaning and maintenance occupations (3%)
- Secretaries and administrative assistants (9%)
- Other office and administrative support workers including supervisors (9%)
- Other production occupations including supervisors (7%)
- Metal workers and plastic workers (7%)
- Laborers and material movers, hand (5%)
- Preschool, kindergarten, elementary and middle school teachers (4%)
- Financial clerks except bookkeeping, accounting, and auditing clerks (4%)
Most common first ancestries reported in Little Rock township:
- German (23.5%)
- Irish (8.2%)
- English (8.2%)
- Norwegian (5.8%)
- United States or American (5.5%)
- Swedish (3.7%)
- Polish (3.4%)
Most common places of birth for the foreign-born residents:
- Mexico (83%)
- Hungary (4%)
- India (4%)
- Germany (3%)
- Other Northern Europe (2%)
- Philippines (1%)
- Vietnam (1%)
Means of transportation to work:
- Drove a car alone: 2,975 (76%)
- Carpooled: 617 (16%)
- Bus or trolley bus: 20 (1%)
- Walked: 111 (3%)
- Other means: 9 (0%)
- Worked at home: 180 (5%)
Most commonly used house heating fuel:
- Utility gas (80%)
- Electricity (12%)
- Bottled, tank, or LP gas (5%)
- Other fuel (1%)
- Wood (1%)
- Fuel oil, kerosene, etc. (1%)
77.9% of residents of Little Rock township speak English at home.
19.5% of residents speak Spanish at home (50% speak English very well, 20% speak English well, 26% speak English not well, 4% don't speak English at all).
1.9% of residents speak other Indo-European language at home (40% speak English very well, 44% speak English well, 7% speak English not well, 9% don't speak English at all).
0.4% of residents speak Asian or Pacific Island language at home (50% speak English very well, 29% speak English well, 21% speak English not well).
0.3% of residents speak other language at home (100% speak English very well).
Household type by relationship:
Households: 7,662- In family households: 6,945 (1,607 male householders, 397 female householders)
1,622 spouses, 2,571 children (2,375 natural, 58 adopted, 138 stepchildren), 135 grandchildren, 63 brothers or sisters, 56 parents, 295 other relatives, 199 non-relatives
- In nonfamily households: 717 (266 male householders (218 living alone)), 312 female householders (266 living alone)), 139 nonrelatives
Size of family households: 669 2-persons, 410 3-persons, 468 4-persons, 241 5-persons, 112 6-persons, 104 7-or-more-persons,
Size of nonfamily households: 484 1-person, 75 2-persons, 8 3-persons, 11 4-persons,
1,745 married couples with children.
344 single-parent households (90 men, 254 women).
Private vs. public school enrollment:
Students in private schools in grades 1 to 8 (elementary and middle school): 102
| Here: | 9.5% |
| Illinois: | 13.4% |
Students in private schools in grades 9 to 12 (high school): 10
| Here: | 2.2% |
| Illinois: | 11.1% |
Students in private undergraduate colleges: 57
| Here: | 19.5% |
| Illinois: | 25.8% |