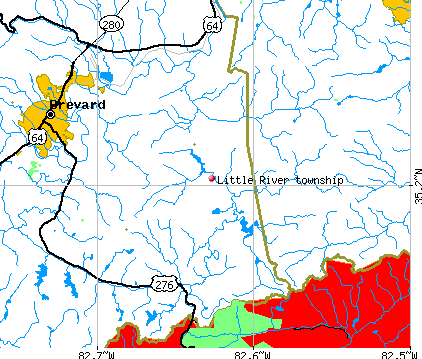
Little River township, Transylvania County, North Carolina (NC) detailed profile
Number of foreign born residents: 1 (66% naturalized citizens)
| Little River township: | 1.3% |
| Whole state: | 5.3% |
58% of Little River township residents lived in the same house 5 years ago.
Out of people who lived in different houses, 33% lived in this county.
Out of people who lived in different counties, 32% lived in North Carolina.
Place of birth for U.S.-born residents:
- This state: 1243
- Northeast: 124
- Midwest: 255
- South: 487
- West: 19
Median price asked for vacant for-sale houses in 2000: $95,000
Percentage of households with unmarried partners: 2.8%
Likely homosexual households (counted as self-reported same-sex unmarried-partner households)
- Lesbian couples: 0.1% of all households
- Gay men: 0.0% of all households
Housing units in structures:
- One, detached: 981
- Mobile homes: 187
Median worth of mobile homes: $43,800
Housing units in Little River township with a mortgage: 328 (8 second mortgage, 106 home equity loan, 0 both second mortgage and home equity loan)
Houses without a mortgage: 203
- Construction (11%)
- Chemicals (10%)
- Paper (9%)
- Public administration (8%)
- Agriculture, forestry, fishing and hunting (7%)
- Religious, grantmaking, civic, professional, and similar organizations (5%)
- Plastics and rubber products (5%)
- Health care (24%)
- Educational services (22%)
- Food and beverage stores (7%)
- Finance and insurance (4%)
- Agriculture, forestry, fishing and hunting (4%)
- Accommodation and food services (3%)
- Personal and laundry services (3%)
- Electrical equipment mechanics and other installation, maintenance, and repair occupations including supervisors (16%)
- Other production occupations including supervisors (11%)
- Vehicle and mobile equipment mechanics, installers, and repairers (6%)
- Other sales and related workers including supervisors (4%)
- Computer specialists (4%)
- Metal workers and plastic workers (4%)
- Material moving workers except supervisors and laborers and material movers, hand (4%)
- Secretaries and administrative assistants (12%)
- Building and grounds cleaning and maintenance occupations (6%)
- Other teachers and instructors, education, training, and library occupations (6%)
- Health technologists and technicians (5%)
- Other office and administrative support workers including supervisors (5%)
- Waiters and waitresses (5%)
- Material recording, scheduling, dispatching, and distributing workers (5%)
Most common first ancestries reported in Little River township:
- United States or American (21.5%)
- German (17.7%)
- Irish (17.4%)
- English (12.6%)
- Scottish (5.1%)
- Scotch-Irish (3.2%)
- Dutch (2.2%)
Most common places of birth for the foreign-born residents:
- Ecuador (100%)
Means of transportation to work:
- Drove a car alone: 789 (87%)
- Carpooled: 81 (9%)
- Walked: 6 (1%)
- Other means: 8 (1%)
- Worked at home: 18 (2%)
Most commonly used house heating fuel:
- Electricity (48%)
- Bottled, tank, or LP gas (28%)
- Fuel oil, kerosene, etc. (15%)
- Wood (5%)
- Utility gas (5%)
96.1% of residents of Little River township speak English at home.
3.6% of residents speak Spanish at home (86% speak English very well, 14% don't speak English at all).
0.2% of residents speak other Indo-European language at home (100% speak English very well).
Household type by relationship:
Households: 2,164- In family households: 1,978 (632 male householders, 78 female householders)
633 spouses, 598 children (560 natural, 18 adopted, 20 stepchildren), 8 grandchildren, 0 brothers or sisters, 0 parents, 24 other relatives, 5 non-relatives
- In nonfamily households: 186 (36 male householders (36 living alone)), 130 female householders (115 living alone)), 20 nonrelatives
Size of family households: 380 2-persons, 135 3-persons, 134 4-persons, 61 5-persons,
Size of nonfamily households: 151 1-person, 15 2-persons,
383 married couples with children.
66 single-parent households (27 men, 39 women).
Private vs. public school enrollment:
Students in private schools in grades 1 to 8 (elementary and middle school): 15
| Here: | 6.8% |
| North Carolina: | 8.2% |
Students in private schools in grades 9 to 12 (high school): 7
| Here: | 10.6% |
| North Carolina: | 6.9% |
Students in private undergraduate colleges: 20
| Here: | 21.7% |
| North Carolina: | 20.2% |