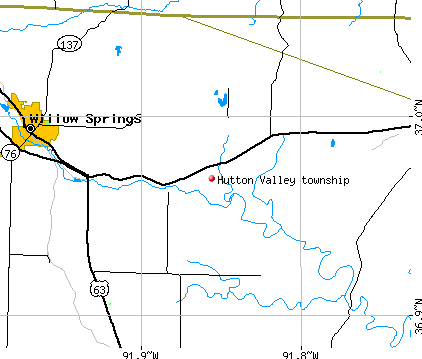
Hutton Valley township, Howell County, Missouri (MO) detailed profile
Number of foreign born residents: 1 (100% naturalized citizens)
| Hutton Valley township: | 0.7% |
| Whole state: | 2.7% |
65% of Hutton Valley township residents lived in the same house 5 years ago.
Out of people who lived in different houses, 59% lived in this county.
Out of people who lived in different counties, 64% lived in Missouri.
Place of birth for U.S.-born residents:
- This state: 613
- Northeast: 26
- Midwest: 214
- South: 84
- West: 52
Median price asked for vacant for-sale houses in 2000: $15,800
Percentage of households with unmarried partners: 4.1%
Likely homosexual households (counted as self-reported same-sex unmarried-partner households)
- Lesbian couples: 0.8% of all households
- Gay men: 0.3% of all households
4 people in other nonhousehold living situations

Housing units in structures:
- One, detached: 265
- One, attached: 6
- Mobile homes: 162
- Boats, RVs, vans, etc.: 8
Median worth of mobile homes: $42,300
Housing units in Hutton Valley township with a mortgage: 39 (7 second mortgage, 0 home equity loan, 0 both second mortgage and home equity loan)
Houses without a mortgage: 7
- Wood products (13%)
- Agriculture, forestry, fishing and hunting (13%)
- Health care (10%)
- Motor vehicle and parts dealers (9%)
- Truck transportation (7%)
- Repair and maintenance (7%)
- Other direct selling establishments (6%)
- Accommodation and food services (21%)
- Health care (18%)
- Department and other general merchandise stores (11%)
- Apparel (9%)
- Social assistance (8%)
- Educational services (5%)
- Arts, entertainment, and recreation (4%)
- Vehicle and mobile equipment mechanics, installers, and repairers (11%)
- Driver/sales workers and truck drivers (9%)
- Laborers and material movers, hand (9%)
- Farmers and farm managers (8%)
- Other sales and related workers including supervisors (7%)
- Agricultural workers including supervisors (5%)
- Construction trades workers except carpenters, electricians, painters, plumbers, and construction laborers (5%)
- Health technologists and technicians (11%)
- Building and grounds cleaning and maintenance occupations (11%)
- Textile, apparel, and furnishings workers (11%)
- Cooks and food preparation workers (9%)
- Supervisors and other personal care and service workers except personal appearance, transportation, and child care workers (8%)
- Nursing, psychiatric, and home health aides (7%)
- Retail sales workers except cashiers (6%)
Most common first ancestries reported in Hutton Valley township:
- United States or American (36.8%)
- German (20.7%)
- Irish (12.7%)
- English (7.5%)
- Dutch (3.8%)
- Norwegian (2.1%)
- Scotch-Irish (2.0%)
Most common places of birth for the foreign-born residents:
- Taiwan (100%)
Means of transportation to work:
- Drove a car alone: 280 (80%)
- Carpooled: 30 (9%)
- Other means: 10 (3%)
- Worked at home: 30 (9%)
Most commonly used house heating fuel:
- Bottled, tank, or LP gas (45%)
- Wood (32%)
- Electricity (19%)
- Utility gas (3%)
4 people in other nonhousehold living situations
98.6% of residents of Hutton Valley township speak English at home.
1.4% of residents speak Spanish at home (54% speak English very well, 46% speak English well).
Household type by relationship:
Households: 992- In family households: 855 (235 male householders, 33 female householders)
241 spouses, 284 children (266 natural, 0 adopted, 18 stepchildren), 11 grandchildren, 8 brothers or sisters, 4 parents, 4 other relatives, 35 non-relatives
- In nonfamily households: 137 (56 male householders (43 living alone)), 58 female householders (46 living alone)), 23 nonrelatives
- In group quarters: 4 (0 institutionalized population)
Size of family households: 122 2-persons, 64 3-persons, 39 4-persons, 24 5-persons, 15 6-persons, 4 7-or-more-persons,
Size of nonfamily households: 89 1-person, 25 2-persons,
193 married couples with children.
44 single-parent households (13 men, 31 women).
Private vs. public school enrollment:
Students in private schools in grades 1 to 8 (elementary and middle school): 6
| Here: | 4.3% |
| Missouri: | 13.7% |
Students in private schools in grades 9 to 12 (high school): 2
| Here: | 2.6% |
| Missouri: | 11.6% |
Students in private undergraduate colleges: 0
| Here: | 0.0% |
| Missouri: | 24.9% |