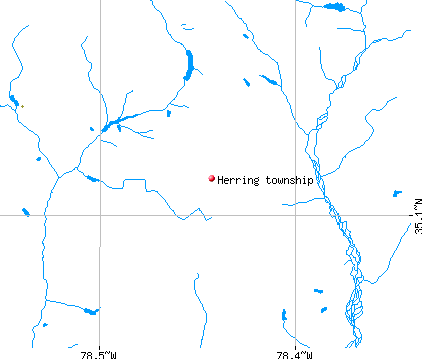
Herring township, Sampson County, North Carolina (NC) detailed profile
Number of foreign born residents: 5 (26% naturalized citizens)
| Herring township: | 5.1% |
| Whole state: | 5.3% |
65% of Herring township residents lived in the same house 5 years ago.
Out of people who lived in different houses, 50% lived in this county.
Out of people who lived in different counties, 70% lived in North Carolina.
Place of birth for U.S.-born residents:
- This state: 1498
- Northeast: 90
- Midwest: 25
- South: 26
- West: 17
Percentage of households with unmarried partners: 4.0%
Likely homosexual households (counted as self-reported same-sex unmarried-partner households)
- Lesbian couples: 0.1% of all households
- Gay men: 0.6% of all households
2 people in other group homes

Housing units in structures:
- One, detached: 458
- Two: 8
- Mobile homes: 233
Median worth of mobile homes: $34,000
Housing units in Herring township with a mortgage: 193 (16 second mortgage, 30 home equity loan, 0 both second mortgage and home equity loan)
Houses without a mortgage: 151
- Agriculture, forestry, fishing and hunting (23%)
- Public administration (7%)
- Construction (7%)
- Food (6%)
- Administrative and support and waste management services (5%)
- Textile mills and textile products (4%)
- Building material and garden equipment and supplies dealers (4%)
- Educational services (20%)
- Health care (14%)
- Public administration (12%)
- Social assistance (10%)
- Accommodation and food services (7%)
- Department and other general merchandise stores (5%)
- Food (4%)
- Agricultural workers including supervisors (13%)
- Driver/sales workers and truck drivers (12%)
- Building and grounds cleaning and maintenance occupations (7%)
- Farmers and farm managers (5%)
- Other production occupations including supervisors (5%)
- Vehicle and mobile equipment mechanics, installers, and repairers (5%)
- Other sales and related workers including supervisors (4%)
- Other office and administrative support workers including supervisors (9%)
- Preschool, kindergarten, elementary and middle school teachers (7%)
- Retail sales workers except cashiers (7%)
- Business operations specialists (6%)
- Health technologists and technicians (6%)
- Counselors, social workers, and other community and social service specialists (5%)
- Cashiers (5%)
Most common first ancestries reported in Herring township:
- United States or American (27.8%)
- English (9.5%)
- Irish (2.2%)
- Scotch-Irish (1.7%)
- German (1.1%)
- French (except Basque) (1.0%)
- Finnish (0.8%)
Most common places of birth for the foreign-born residents:
- Mexico (74%)
- Philippines (14%)
- India (12%)
Means of transportation to work:
- Drove a car alone: 745 (84%)
- Carpooled: 124 (14%)
- Walked: 7 (1%)
- Other means: 7 (1%)
- Worked at home: 7 (1%)
Most commonly used house heating fuel:
- Electricity (48%)
- Bottled, tank, or LP gas (41%)
- Fuel oil, kerosene, etc. (7%)
- Utility gas (3%)
- No fuel used (1%)
2 people in other group homes
84.4% of residents of Herring township speak English at home.
13.2% of residents speak Spanish at home (67% speak English very well, 3% speak English well, 21% speak English not well, 9% don't speak English at all).
0.7% of residents speak other Indo-European language at home (100% speak English very well).
1.8% of residents speak Asian or Pacific Island language at home (87% speak English very well, 13% speak English well).
Household type by relationship:
Households: 1,785- In family households: 1,640 (421 male householders, 86 female householders)
433 spouses, 572 children (539 natural, 0 adopted, 33 stepchildren), 9 grandchildren, 0 brothers or sisters, 5 parents, 29 other relatives, 85 non-relatives
- In nonfamily households: 145 (43 male householders (38 living alone)), 97 female householders (97 living alone)), 5 nonrelatives
Size of family households: 202 2-persons, 148 3-persons, 82 4-persons, 45 5-persons, 14 6-persons, 16 7-or-more-persons,
Size of nonfamily households: 135 1-person, 5 2-persons,
328 married couples with children.
82 single-parent households (17 men, 65 women).
Private vs. public school enrollment:
Students in private schools in grades 1 to 8 (elementary and middle school): 0
| Here: | 0.0% |
| North Carolina: | 8.2% |
Students in private schools in grades 9 to 12 (high school): 0
| Here: | 0.0% |
| North Carolina: | 6.9% |
Students in private undergraduate colleges: 15
| Here: | 30.6% |
| North Carolina: | 20.2% |