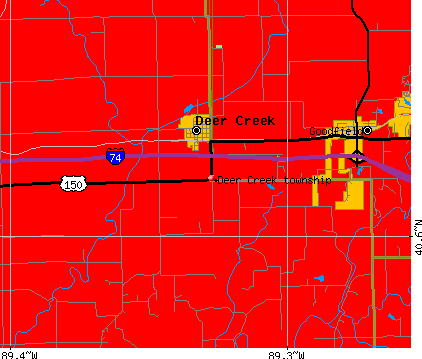
Deer Creek township, Tazewell County, Illinois (IL) detailed profile
Number of foreign born residents: 2 (35% naturalized citizens)
| Deer Creek township: | 2.0% |
| Whole state: | 12.3% |
71% of Deer Creek township residents lived in the same house 5 years ago.
Out of people who lived in different houses, 57% lived in this county.
Out of people who lived in different counties, 97% lived in Illinois.
Place of birth for U.S.-born residents:
- This state: 1087
- Northeast: 3
- Midwest: 93
- South: 28
- West: 28
Median price asked for vacant for-sale houses in 2000: $53,300
Percentage of households with unmarried partners: 2.8%
Likely homosexual households (counted as self-reported same-sex unmarried-partner households)
- Lesbian couples: 0.5% of all households
- Gay men: 0.2% of all households
Housing units in structures:
- One, detached: 443
- One, attached: 2
- Two: 13
- 3 or 4: 5
- 5 to 9: 14
Housing units in Deer Creek township with a mortgage: 199 (25 second mortgage, 19 home equity loan, 0 both second mortgage and home equity loan)
Houses without a mortgage: 107
- Construction (17%)
- Machinery (14%)
- Motor vehicle and parts dealers (8%)
- Transportation equipment (7%)
- Building material and garden equipment and supplies dealers (6%)
- Truck transportation (6%)
- Health care (5%)
- Health care (15%)
- Finance and insurance (12%)
- Building material and garden equipment and supplies dealers (8%)
- Educational services (8%)
- Accommodation and food services (5%)
- Personal and laundry services (5%)
- Professional, scientific, and technical services (4%)
- Laborers and material movers, hand (12%)
- Electrical equipment mechanics and other installation, maintenance, and repair occupations including supervisors (11%)
- Driver/sales workers and truck drivers (9%)
- Construction trades workers except carpenters, electricians, painters, plumbers, and construction laborers (6%)
- Material recording, scheduling, dispatching, and distributing workers (6%)
- Metal workers and plastic workers (5%)
- Assemblers and fabricators (4%)
- Other office and administrative support workers including supervisors (7%)
- Bookkeeping, accounting, and auditing clerks (7%)
- Electrical equipment mechanics and other installation, maintenance, and repair occupations including supervisors (7%)
- Secretaries and administrative assistants (6%)
- Personal appearance workers (5%)
- Waiters and waitresses (5%)
- Customer service representatives (5%)
Most common first ancestries reported in Deer Creek township:
- German (43.4%)
- United States or American (13.2%)
- Irish (9.7%)
- English (9.0%)
- Welsh (4.7%)
- Italian (3.5%)
- Scottish (2.7%)
Most common places of birth for the foreign-born residents:
- Philippines (74%)
- Nicaragua (26%)
Means of transportation to work:
- Drove a car alone: 502 (78%)
- Carpooled: 92 (14%)
- Walked: 10 (2%)
- Other means: 8 (1%)
- Worked at home: 29 (5%)
Most commonly used house heating fuel:
- Utility gas (53%)
- Bottled, tank, or LP gas (38%)
- Electricity (6%)
- No fuel used (2%)
- Wood (1%)
96.5% of residents of Deer Creek township speak English at home.
1.1% of residents speak Spanish at home (100% speak English very well).
1.1% of residents speak other Indo-European language at home (85% speak English very well, 15% speak English well).
1.3% of residents speak Asian or Pacific Island language at home (60% speak English very well, 40% speak English well).
Household type by relationship:
Households: 1,262- In family households: 1,175 (309 male householders, 49 female householders)
327 spouses, 430 children (408 natural, 12 adopted, 10 stepchildren), 43 grandchildren, 7 brothers or sisters, 3 parents, 0 other relatives, 7 non-relatives
- In nonfamily households: 87 (50 male householders (47 living alone)), 27 female householders (18 living alone)), 10 nonrelatives
Size of family households: 130 2-persons, 97 3-persons, 75 4-persons, 47 5-persons, 7 6-persons, 2 7-or-more-persons,
Size of nonfamily households: 65 1-person, 12 2-persons,
236 married couples with children.
31 single-parent households (12 men, 19 women).
Private vs. public school enrollment:
Students in private schools in grades 1 to 8 (elementary and middle school): 15
| Here: | 8.8% |
| Illinois: | 13.4% |
Students in private schools in grades 9 to 12 (high school): 3
| Here: | 3.9% |
| Illinois: | 11.1% |
Students in private undergraduate colleges: 7
| Here: | 26.9% |
| Illinois: | 25.8% |