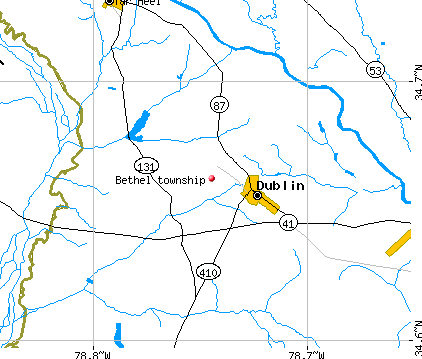
Bethel township, Bladen County, North Carolina (NC) detailed profile
Number of foreign born residents: 5 (5% naturalized citizens)
| Bethel township: | 4.9% |
| Whole state: | 5.3% |
65% of Bethel township residents lived in the same house 5 years ago.
Out of people who lived in different houses, 61% lived in this county.
Out of people who lived in different counties, 64% lived in North Carolina.
Place of birth for U.S.-born residents:
- This state: 2681
- Northeast: 100
- Midwest: 38
- South: 292
- West: 68
Median price asked for vacant for-sale houses in 2000: $9,999
Percentage of households with unmarried partners: 5.3%
Likely homosexual households (counted as self-reported same-sex unmarried-partner households)
- Lesbian couples: 0.5% of all households
- Gay men: 0.1% of all households
Housing units in structures:
- One, detached: 1,043
- One, attached: 21
- 3 or 4: 15
- 20 to 49: 45
- Mobile homes: 505
Median worth of mobile homes: $26,500
Housing units in Bethel township with a mortgage: 312 (17 second mortgage, 15 home equity loan, 0 both second mortgage and home equity loan)
Houses without a mortgage: 297
- Food (18%)
- Construction (13%)
- Agriculture, forestry, fishing and hunting (8%)
- Truck transportation (5%)
- Public administration (5%)
- Educational services (4%)
- Textile mills and textile products (4%)
- Health care (17%)
- Food (15%)
- Educational services (13%)
- Public administration (7%)
- Accommodation and food services (6%)
- Textile mills and textile products (4%)
- Food and beverage stores (4%)
- Electrical equipment mechanics and other installation, maintenance, and repair occupations including supervisors (14%)
- Other management occupations except farmers and farm managers (7%)
- Driver/sales workers and truck drivers (6%)
- Material moving workers except supervisors and laborers and material movers, hand (5%)
- Vehicle and mobile equipment mechanics, installers, and repairers (5%)
- Food processing workers (4%)
- Other production occupations including supervisors (4%)
- Registered nurses (7%)
- Food processing workers (7%)
- Information and record clerks except customer service representatives (6%)
- Cashiers (6%)
- Other management occupations except farmers and farm managers (5%)
- Textile, apparel, and furnishings workers (5%)
- Other production occupations including supervisors (5%)
Most common first ancestries reported in Bethel township:
- United States or American (19.8%)
- Irish (10.8%)
- Scotch-Irish (7.3%)
- English (4.9%)
- German (3.1%)
- French (except Basque) (1.5%)
- Scottish (1.2%)
Most common places of birth for the foreign-born residents:
- Mexico (60%)
- Honduras (35%)
- Canada (5%)
Means of transportation to work:
- Drove a car alone: 1,161 (80%)
- Carpooled: 202 (14%)
- Motorcycle: 12 (1%)
- Walked: 8 (1%)
- Other means: 34 (2%)
- Worked at home: 31 (2%)
Most commonly used house heating fuel:
- Electricity (48%)
- Bottled, tank, or LP gas (36%)
- Fuel oil, kerosene, etc. (7%)
- Wood (5%)
- Utility gas (4%)
- No fuel used (1%)
94.1% of residents of Bethel township speak English at home.
5.5% of residents speak Spanish at home (17% speak English very well, 22% speak English well, 53% speak English not well, 7% don't speak English at all).
0.4% of residents speak other Indo-European language at home (91% speak English very well, 9% speak English well).
Household type by relationship:
Households: 3,362- In family households: 2,863 (768 male householders, 162 female householders)
728 spouses, 997 children (926 natural, 3 adopted, 68 stepchildren), 55 grandchildren, 18 brothers or sisters, 24 parents, 42 other relatives, 69 non-relatives
- In nonfamily households: 499 (191 male householders (150 living alone)), 230 female householders (217 living alone)), 78 nonrelatives
Size of family households: 436 2-persons, 213 3-persons, 170 4-persons, 82 5-persons, 29 6-persons,
Size of nonfamily households: 367 1-person, 37 2-persons, 4 3-persons, 13 4-persons,
481 married couples with children.
233 single-parent households (52 men, 181 women).
Private vs. public school enrollment:
Students in private schools in grades 1 to 8 (elementary and middle school): 0
| Here: | 0.0% |
| North Carolina: | 8.2% |
Students in private schools in grades 9 to 12 (high school): 0
| Here: | 0.0% |
| North Carolina: | 6.9% |
Students in private undergraduate colleges: 10
| Here: | 7.0% |
| North Carolina: | 20.2% |