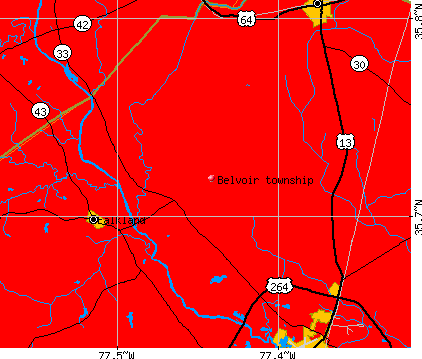
Belvoir township, Pitt County, North Carolina (NC) detailed profile
Number of foreign born residents: 7 (11% naturalized citizens)
| Belvoir township: | 7.4% |
| Whole state: | 5.3% |
50% of Belvoir township residents lived in the same house 5 years ago.
Out of people who lived in different houses, 78% lived in this county.
Out of people who lived in different counties, 69% lived in North Carolina.
Place of birth for U.S.-born residents:
- This state: 7116
- Northeast: 266
- Midwest: 60
- South: 419
- West: 50
Median price asked for vacant for-sale houses in 2000: $37,500
Percentage of households with unmarried partners: 7.5%
Likely homosexual households (counted as self-reported same-sex unmarried-partner households)
- Lesbian couples: 0.3% of all households
- Gay men: 0.1% of all households
10 people in other noninstitutional group quarters
Housing units in structures:
- One, detached: 909
- Two: 68
- 3 or 4: 7
- Mobile homes: 2,491
Median worth of mobile homes: $41,500
Housing units in Belvoir township with a mortgage: 463 (45 second mortgage, 45 home equity loan, 0 both second mortgage and home equity loan)
Houses without a mortgage: 193
- Construction (23%)
- Machinery (6%)
- Administrative and support and waste management services (6%)
- Transportation equipment (6%)
- Repair and maintenance (5%)
- Agriculture, forestry, fishing and hunting (4%)
- Textile mills and textile products (3%)
- Health care (18%)
- Educational services (8%)
- Personal and laundry services (7%)
- Accommodation and food services (6%)
- Textile mills and textile products (4%)
- Chemicals (4%)
- Social assistance (4%)
- Driver/sales workers and truck drivers (9%)
- Electrical equipment mechanics and other installation, maintenance, and repair occupations including supervisors (8%)
- Other production occupations including supervisors (7%)
- Construction trades workers except carpenters, electricians, painters, plumbers, and construction laborers (7%)
- Building and grounds cleaning and maintenance occupations (7%)
- Metal workers and plastic workers (5%)
- Vehicle and mobile equipment mechanics, installers, and repairers (5%)
- Other production occupations including supervisors (8%)
- Textile, apparel, and furnishings workers (8%)
- Secretaries and administrative assistants (7%)
- Cashiers (6%)
- Building and grounds cleaning and maintenance occupations (5%)
- Other office and administrative support workers including supervisors (4%)
- Health technologists and technicians (4%)
Most common first ancestries reported in Belvoir township:
- United States or American (13.5%)
- African (5.8%)
- English (2.8%)
- Irish (2.1%)
- German (1.2%)
- French (except Basque) (0.6%)
- Italian (0.6%)
Most common places of birth for the foreign-born residents:
- Mexico (95%)
- Portugal (2%)
- Jamaica (1%)
- Canada (1%)
- Brazil (1%)
Means of transportation to work:
- Drove a car alone: 2,533 (74%)
- Carpooled: 754 (22%)
- Taxi: 8 (0%)
- Walked: 28 (1%)
- Other means: 54 (2%)
- Worked at home: 64 (2%)
Most commonly used house heating fuel:
- Electricity (71%)
- Bottled, tank, or LP gas (15%)
- Utility gas (7%)
- Fuel oil, kerosene, etc. (4%)
- Wood (1%)
- Other fuel (1%)
10 people in other noninstitutional group quarters
89.7% of residents of Belvoir township speak English at home.
10.0% of residents speak Spanish at home (26% speak English very well, 12% speak English well, 32% speak English not well, 30% don't speak English at all).
0.3% of residents speak other Indo-European language at home (75% speak English very well, 25% speak English not well).
Household type by relationship:
Households: 8,553- In family households: 7,915 (1,355 male householders, 933 female householders)
1,496 spouses, 3,041 children (2,771 natural, 98 adopted, 172 stepchildren), 289 grandchildren, 113 brothers or sisters, 42 parents, 299 other relatives, 347 non-relatives
- In nonfamily households: 638 (192 male householders (163 living alone)), 286 female householders (226 living alone)), 160 nonrelatives
Size of family households: 736 2-persons, 576 3-persons, 467 4-persons, 298 5-persons, 139 6-persons, 72 7-or-more-persons,
Size of nonfamily households: 389 1-person, 73 2-persons, 16 4-persons,
1,294 married couples with children.
942 single-parent households (128 men, 814 women).
Private vs. public school enrollment:
Students in private schools in grades 1 to 8 (elementary and middle school): 57
| Here: | 4.1% |
| North Carolina: | 8.2% |
Students in private schools in grades 9 to 12 (high school): 47
| Here: | 9.6% |
| North Carolina: | 6.9% |
Students in private undergraduate colleges: 22
| Here: | 6.4% |
| North Carolina: | 20.2% |