Races in Woodstock, Georgia (GA) Detailed Stats
Data:
Races - White alone (%)
Races - White alone (% change since 2000)
Races - Black alone (%)
Races - Black alone (% change since 2000)
Races - American Indian alone (%)
Races - American Indian alone (% change since 2000)
Races - Asian alone (%)
Races - Asian alone (% change since 2000)
Races - Hispanic (%)
Races - Hispanic (% change since 2000)
Races - Native Hawaiian and Other Pacific Islander alone (%)
Races - Native Hawaiian and Other Pacific Islander alone (% change since 2000)
Races - Two or more races(%)
Races - Two or more races(% change since 2000)
Races - Other race alone (%)
Races - Other race alone (% change since 2000)
Racial diversity
Place of birth - Born in state of residence (%)
Place of birth - Born in state of residence (%) - White
Place of birth - Born in state of residence (%) - Black or African American
Place of birth - Born in state of residence (%) - Asian
Place of birth - Born in state of residence (%) - Hispanic or Latino
Place of birth - Born in state of residence (%) - American Indian and Alaska Native
Place of birth - Born in state of residence (%) - Multirace
Place of birth - Born in state of residence (%) - Other Race
Place of birth - Born in other state (%)
Place of birth - Born in other state (%) - White
Place of birth - Born in other state (%) - Black or African American
Place of birth - Born in other state (%) - Asian
Place of birth - Born in other state (%) - Hispanic or Latino
Place of birth - Born in other state (%) - American Indian and Alaska Native
Place of birth - Born in other state (%) - Multirace
Place of birth - Born in other state (%) - Other Race
Place of birth - Native, outside of US (%)
Place of birth - Native, outside of US (%) - White
Place of birth - Native, outside of US (%) - Black or African American
Place of birth - Native, outside of US (%) - Asian
Place of birth - Native, outside of US (%) - Hispanic or Latino
Place of birth - Native, outside of US (%) - American Indian and Alaska Native
Place of birth - Native, outside of US (%) - Multirace
Place of birth - Native, outside of US (%) - Other Race
Place of birth - Foreign born (%)
Place of birth - Foreign born (%) - White
Place of birth - Foreign born (%) - Black or African American
Place of birth - Foreign born (%) - Asian
Place of birth - Foreign born (%) - Hispanic or Latino
Place of birth - Foreign born (%) - American Indian and Alaska Native
Place of birth - Foreign born (%) - Multirace
Place of birth - Foreign born (%) - Other Race
Residents speaking English at home (%)
Residents speaking English at home - Born in the United States (%)
Residents speaking English at home - Native, born elsewhere (%)
Residents speaking English at home - Foreign born (%)
Residents speaking Spanish at home (%)
Residents speaking Spanish at home - Born in the United States (%)
Residents speaking Spanish at home - Native, born elsewhere (%)
Residents speaking Spanish at home - Foreign born (%)
Residents speaking other language at home (%)
Residents speaking other language at home - Born in the United States (%)
Residents speaking other language at home - Native, born elsewhere (%)
Residents speaking other language at home - Foreign born (%)
Marital status - Never married (%)
Marital status - Now married (%)
Marital status - Separated (%)
Marital status - Widowed (%)
Marital status - Divorced (%)
Ancestries Reported - Arab (%)
Ancestries Reported - Czech (%)
Ancestries Reported - Danish (%)
Ancestries Reported - Dutch (%)
Ancestries Reported - English (%)
Ancestries Reported - French (%)
Ancestries Reported - French Canadian (%)
Ancestries Reported - German (%)
Ancestries Reported - Greek (%)
Ancestries Reported - Hungarian (%)
Ancestries Reported - Irish (%)
Ancestries Reported - Italian (%)
Ancestries Reported - Lithuanian (%)
Ancestries Reported - Norwegian (%)
Ancestries Reported - Polish (%)
Ancestries Reported - Portuguese (%)
Ancestries Reported - Russian (%)
Ancestries Reported - Scotch-Irish (%)
Ancestries Reported - Scottish (%)
Ancestries Reported - Slovak (%)
Ancestries Reported - Subsaharan African (%)
Ancestries Reported - Swedish (%)
Ancestries Reported - Swiss (%)
Ancestries Reported - Ukrainian (%)
Ancestries Reported - United States (%)
Ancestries Reported - Welsh (%)
Ancestries Reported - West Indian (%)
Ancestries Reported - Other (%)
Geographical mobility - Same house 1 year ago (%)
Geographical mobility - Same house 1 year ago (%) - White
Geographical mobility - Same house 1 year ago (%) - Black or African American
Geographical mobility - Same house 1 year ago (%) - Asian
Geographical mobility - Same house 1 year ago (%) - Hispanic or Latino
Geographical mobility - Same house 1 year ago (%) - American Indian and Alaska Native
Geographical mobility - Same house 1 year ago (%) - Multirace
Geographical mobility - Same house 1 year ago (%) - Other Race
Geographical mobility - Moved within same county (%)
Geographical mobility - Moved within same county (%) - White
Geographical mobility - Moved within same county (%) - Black or African American
Geographical mobility - Moved within same county (%) - Asian
Geographical mobility - Moved within same county (%) - Hispanic or Latino
Geographical mobility - Moved within same county (%) - American Indian and Alaska Native
Geographical mobility - Moved within same county (%) - Multirace
Geographical mobility - Moved within same county (%) - Other Race
Geographical mobility - Moved from different county within same state (%)
Geographical mobility - Moved from different county within same state (%) - White
Geographical mobility - Moved from different county within same state (%) - Black or African American
Geographical mobility - Moved from different county within same state (%) - Asian
Geographical mobility - Moved from different county within same state (%) - Hispanic or Latino
Geographical mobility - Moved from different county within same state (%) - American Indian and Alaska Native
Geographical mobility - Moved from different county within same state (%) - Multirace
Geographical mobility - Moved from different county within same state (%) - Other Race
Geographical mobility - Moved from different state (%)
Geographical mobility - Moved from different state (%) - White
Geographical mobility - Moved from different state (%) - Black or African American
Geographical mobility - Moved from different state (%) - Asian
Geographical mobility - Moved from different state (%) - Hispanic or Latino
Geographical mobility - Moved from different state (%) - American Indian and Alaska Native
Geographical mobility - Moved from different state (%) - Multirace
Geographical mobility - Moved from different state (%) - Other Race
Geographical mobility - Moved from abroad (%)
Geographical mobility - Moved from abroad (%) - White
Geographical mobility - Moved from abroad (%) - Black or African American
Geographical mobility - Moved from abroad (%) - Asian
Geographical mobility - Moved from abroad (%) - Hispanic or Latino
Geographical mobility - Moved from abroad (%) - American Indian and Alaska Native
Geographical mobility - Moved from abroad (%) - Multirace
Geographical mobility - Moved from abroad (%) - Other Race
Place of birth for the foreign-born population - Ireland (%)
Place of birth for the foreign-born population - Denmark (%)
Place of birth for the foreign-born population - Norway (%)
Place of birth for the foreign-born population - Sweden (%)
Place of birth for the foreign-born population - United Kingdom (%)
Place of birth for the foreign-born population - England (%)
Place of birth for the foreign-born population - Scotland (%)
Place of birth for the foreign-born population - Other Northern Europe (%)
Place of birth for the foreign-born population - Austria (%)
Place of birth for the foreign-born population - Belgium (%)
Place of birth for the foreign-born population - France (%)
Place of birth for the foreign-born population - Germany (%)
Place of birth for the foreign-born population - Netherlands (%)
Place of birth for the foreign-born population - Switzerland (%)
Place of birth for the foreign-born population - Other Western Europe (%)
Place of birth for the foreign-born population - Greece (%)
Place of birth for the foreign-born population - Italy (%)
Place of birth for the foreign-born population - Portugal (%)
Place of birth for the foreign-born population - Spain (%)
Place of birth for the foreign-born population - Other Southern Europe (%)
Place of birth for the foreign-born population - Albania (%)
Place of birth for the foreign-born population - Belarus (%)
Place of birth for the foreign-born population - Bosnia and Herzegovina (%)
Place of birth for the foreign-born population - Bulgaria (%)
Place of birth for the foreign-born population - Croatia (%)
Place of birth for the foreign-born population - Czechoslovakia (%)
Place of birth for the foreign-born population - Hungary (%)
Place of birth for the foreign-born population - Latvia (%)
Place of birth for the foreign-born population - Lithuania (%)
Place of birth for the foreign-born population - North Macedonia (Macedonia) (%)
Place of birth for the foreign-born population - Moldova (%)
Place of birth for the foreign-born population - Poland (%)
Place of birth for the foreign-born population - Romania (%)
Place of birth for the foreign-born population - Russia (%)
Place of birth for the foreign-born population - Serbia (%)
Place of birth for the foreign-born population - Ukraine (%)
Place of birth for the foreign-born population - Other Eastern Europe (%)
Place of birth for the foreign-born population - China (%)
Place of birth for the foreign-born population - Hong Kong (%)
Place of birth for the foreign-born population - Taiwan (%)
Place of birth for the foreign-born population - Japan (%)
Place of birth for the foreign-born population - Korea (%)
Place of birth for the foreign-born population - Other Eastern Asia (%)
Place of birth for the foreign-born population - Afghanistan (%)
Place of birth for the foreign-born population - Bangladesh (%)
Place of birth for the foreign-born population - India (%)
Place of birth for the foreign-born population - Iran (%)
Place of birth for the foreign-born population - Kazakhstan (%)
Place of birth for the foreign-born population - Nepal (%)
Place of birth for the foreign-born population - Pakistan (%)
Place of birth for the foreign-born population - Sri Lanka (%)
Place of birth for the foreign-born population - Uzbekistan (%)
Place of birth for the foreign-born population - Other South Central Asia (%)
Place of birth for the foreign-born population - Burma (%)
Place of birth for the foreign-born population - Cambodia (%)
Place of birth for the foreign-born population - Indonesia (%)
Place of birth for the foreign-born population - Laos (%)
Place of birth for the foreign-born population - Malaysia (%)
Place of birth for the foreign-born population - Philippines (%)
Place of birth for the foreign-born population - Singapore (%)
Place of birth for the foreign-born population - Thailand (%)
Place of birth for the foreign-born population - Vietnam (%)
Place of birth for the foreign-born population - Other South Eastern Asia (%)
Place of birth for the foreign-born population - Armenia (%)
Place of birth for the foreign-born population - Iraq (%)
Place of birth for the foreign-born population - Israel (%)
Place of birth for the foreign-born population - Jordan (%)
Place of birth for the foreign-born population - Kuwait (%)
Place of birth for the foreign-born population - Lebanon (%)
Place of birth for the foreign-born population - Saudi Arabia (%)
Place of birth for the foreign-born population - Syria (%)
Place of birth for the foreign-born population - Turkey (%)
Place of birth for the foreign-born population - Yemen (%)
Place of birth for the foreign-born population - Other Western Asia (%)
Place of birth for the foreign-born population - Eritrea (%)
Place of birth for the foreign-born population - Ethiopia (%)
Place of birth for the foreign-born population - Kenya (%)
Place of birth for the foreign-born population - Somalia (%)
Place of birth for the foreign-born population - Uganda (%)
Place of birth for the foreign-born population - Zimbabwe (%)
Place of birth for the foreign-born population - Other Eastern Africa (%)
Place of birth for the foreign-born population - Cameroon (%)
Place of birth for the foreign-born population - Congo (%)
Place of birth for the foreign-born population - Democratic Republic of Congo (Zaire) (%)
Place of birth for the foreign-born population - Other Middle Africa (%)
Place of birth for the foreign-born population - Egypt (%)
Place of birth for the foreign-born population - Morocco (%)
Place of birth for the foreign-born population - Sudan (%)
Place of birth for the foreign-born population - Other Northern Africa (%)
Place of birth for the foreign-born population - South Africa (%)
Place of birth for the foreign-born population - Other Southern Africa (%)
Place of birth for the foreign-born population - Cabo Verde (%)
Place of birth for the foreign-born population - Ghana (%)
Place of birth for the foreign-born population - Liberia (%)
Place of birth for the foreign-born population - Nigeria (%)
Place of birth for the foreign-born population - Senegal (%)
Place of birth for the foreign-born population - Sierra Leone (%)
Place of birth for the foreign-born population - Other Western Africa (%)
Place of birth for the foreign-born population - Australia (%)
Place of birth for the foreign-born population - New Zealand (%)
Place of birth for the foreign-born population - Fiji (%)
Place of birth for the foreign-born population - Micronesia (%)
Place of birth for the foreign-born population - Bahamas (%)
Place of birth for the foreign-born population - Barbados (%)
Place of birth for the foreign-born population - Cuba (%)
Place of birth for the foreign-born population - Dominica (%)
Place of birth for the foreign-born population - Dominican Republic (%)
Place of birth for the foreign-born population - Grenada (%)
Place of birth for the foreign-born population - Haiti (%)
Place of birth for the foreign-born population - Jamaica (%)
Place of birth for the foreign-born population - St. Vincent and the Grenadines (%)
Place of birth for the foreign-born population - Trinidad and Tobago (%)
Place of birth for the foreign-born population - West Indies (%)
Place of birth for the foreign-born population - Other Caribbean (%)
Place of birth for the foreign-born population - Belize (%)
Place of birth for the foreign-born population - Costa Rica (%)
Place of birth for the foreign-born population - El Salvador (%)
Place of birth for the foreign-born population - Guatemala (%)
Place of birth for the foreign-born population - Honduras (%)
Place of birth for the foreign-born population - Mexico (%)
Place of birth for the foreign-born population - Nicaragua (%)
Place of birth for the foreign-born population - Panama (%)
Place of birth for the foreign-born population - Other Central America (%)
Place of birth for the foreign-born population - Argentina (%)
Place of birth for the foreign-born population - Bolivia (%)
Place of birth for the foreign-born population - Brazil (%)
Place of birth for the foreign-born population - Chile (%)
Place of birth for the foreign-born population - Colombia (%)
Place of birth for the foreign-born population - Ecuador (%)
Place of birth for the foreign-born population - Guyana (%)
Place of birth for the foreign-born population - Peru (%)
Place of birth for the foreign-born population - Uruguay (%)
Place of birth for the foreign-born population - Venezuela (%)
Place of birth for the foreign-born population - Other South America (%)
Place of birth for the foreign-born population - Canada (%)
Place of birth for the foreign-born population - Other Northern America (%)
Place of birth for the foreign-born population - Other (%)
Latest news about races in Woodstock, GA collected exclusively by city-data.com from local newspapers, TV, and radio stations
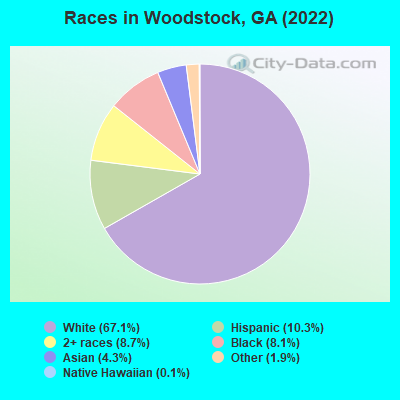
According to 2022 data, the most numerous races in Woodstock, GA are White alone (24,707 residents), Black alone (2,986 residents), and Hispanic (3,779 residents). 86.0% of Woodstock residents speak English at home. 10.7% of Woodstock, GA residents are foreign-born (5.0% born in Latin America, 2.5% born in Asia, 1.8% born in Europe), which is 6.3% greater than the foreign-born rate of 10.0% across the entire state of Georgia.
Race distribution in Woodstock
2000 2022
5,128,661 62.6% White alone 2,331,465 28.5% Black alone 435,227 5.3% Hispanic 171,513 2.1% Asian alone 87,364 1.1% Two or more races 17,670 0.2% American Indian alone 11,275 0.1% Other race alone 3,278 0.04% Native Hawaiian and Other
5,415,657 49.6% White alone 3,349,240 30.7% Black alone 1,132,604 10.4% Hispanic 479,156 4.4% Asian alone 462,923 4.2% Two or more races 54,416 0.5% Other race alone 11,923 0.1% American Indian alone 6,957 0.06% Native Hawaiian and Other
Income and house value in Woodstock Median household income in 2022 $100,370 White non-Hispanic householders$91,306 Black householders$87,999 Asian householdersover $200,000 Some other race householders$119,859 Two or more races householders$70,735 Hispanic or Latino race householdersMedian 2022 house value $433,013 White Non-Hispanic householders$473,047 Black or African American householders$475,930 American Indian or Alaska Native householders $310,667 Asian householders$378,566 Some other race householders$315,471 Two or more races householders$400,345 Hispanic or Latino householders
Median age by race in Woodstock
38.3 Median age for White residents36.9 39.5 42.1 Median age for Black or African American residents43.8 38.0 55.9 Median age for American Indian / Alaska Native residents37.2 -696,476,964.1 38.4 Median age for Asian residents38.9 34.8 -657,243,815.6 Median age for Native Hawaiian / Pacific Islander residents-693,227,090.9 -776,776,776.0 32.7 Median age for Other race residents55.1 26.2 20.1 Median age for Two or more races residents30.4 19.6 38.4 Median age for White alone residents37.6 40.8 29.4 Median age for Hispanic or Latino residents35.0 29.1
Owner/renter occupied households by race in Woodstock
House owners and renters - White residents 7,449 65.5% Owner occupied3,918 34.5% Renter occupiedHouse owners and renters - Black or African American residents 496 55.6% Owner occupied396 44.4% Renter occupiedHouse owners and renters - American Indian / Alaska Native residents 57 94.0% Owner occupied4 6.0% Renter occupiedHouse owners and renters - Asian residents 349 72.4% Owner occupied133 27.6% Renter occupiedHouse owners and renters - Native Hawaiian / Pacific Islander residents 11 100.0% Renter occupiedHouse owners and renters - Other race residents 228 58.4% Owner occupied163 41.6% Renter occupiedHouse owners and renters - Two or more races residents 996 68.9% Owner occupied449 31.1% Renter occupiedHouse owners and renters - White alone residents 7,333 65.1% Owner occupied3,925 34.9% Renter occupiedHouse owners and renters - Hispanic or Latino residents 650 59.5% Owner occupied442 40.5% Renter occupied
Language usage in Woodstock
English speakers - Total 86.0% of residents of Woodstock speak English at home.
7.3% of residents speak Spanish at home 1,416 56.9% Speak English very well1,071 43.1% Speak English less than very well6.4% of residents speak other language at home 1,548 70.7% Speak English very well642 29.3% Speak English less than very well
English speakers - Born in the United States 95.4% of residents of Woodstock speak English at home.
2.9% of residents speak Spanish at home 315 63.3% Speak English very well183 36.7% Speak English less than very well1.2% of residents speak other language at home 188 94.5% Speak English very well11 5.5% Speak English less than very well
English speakers - Native, born elsewhere 66.2% of residents of Woodstock speak English at home.
22.3% of residents speak Spanish at home 79 100.0% Speak English very well
English speakers - Foreign-born 20.5% of residents of Woodstock speak English at home.
36.5% of residents speak Spanish at home 603 45.6% Speak English very well720 54.4% Speak English less than very well40.7% of residents speak other language at home 829 56.2% Speak English very well646 43.8% Speak English less than very well
White (Caucasian) - Speak only English Native:
97.8% (22,167)Foreign-born:
36.6% (329)
White (Caucasian) - Speak another language Native:
2.0% (451)Foreign-born:
62.7% (562)
Black or African American - Speak only English Native:
89.0% (2,316)Foreign-born:
44.8% (109)
Black or African American - Speak another language Native:
11.4% (296)Foreign-born:
49.6% (120)
Asian - Speak only English Native:
57.3% (380)Foreign-born:
9.9% (91)
Asian - Speak another language Native:
32.7% (216)Foreign-born:
94.3% (862)
Other race - Speak another language Native:
42.2% (368)Foreign-born:
92.1% (659)
Two or more races - Speak only English Native:
89.4% (3,611)Foreign-born:
26.2% (161)
Two or more races - Speak another language Native:
10.8% (436)Foreign-born:
63.7% (391)
White alone - Speak only English Native:
98.0% (21,876)Foreign-born:
41.9% (322)
White alone - Speak another language Native:
1.9% (418)Foreign-born:
59.6% (457)
Hispanic or Latino - Speak only English Native:
68.9% (1,493)Foreign-born:
2.9% (37)
Hispanic or Latino - Speak another language Native:
33.0% (715)Foreign-born:
98.8% (1,236)
Foreign-born residents in Woodstock 3,931 residents are foreign born (5.0% Latin America , 2.5% Asia , 1.8% Europe ).
This city:
10.7%Georgia:
10.4%
Marital status for residents in Woodstock Marital status - White (Caucasian) population 15 years and over
Males 28.6% Never married59.6% Now married1.6% Separated3.3% Widowed6.9% DivorcedFemales 28.3% Never married50.4% Now married0.4% Separated5.5% Widowed15.4% DivorcedWomen who gave birth in the past 12 months Now married:
100.0% (241)Unmarried:
0.0% (0)
Women who did not give birth in the past 12 months Now married:
50.3% (3,221)Unmarried:
49.7% (3,179)
Marital status - Black or African American population 15 years and over
Males 40.6% Never married48.2% Now married0.0% Separated0.3% Widowed10.9% DivorcedFemales 36.4% Never married36.1% Now married0.0% Separated11.1% Widowed16.5% DivorcedWomen who gave birth in the past 12 months Now married:
79.2% (75)Unmarried:
20.8% (20)
Women who did not give birth in the past 12 months Now married:
34.8% (350)Unmarried:
65.2% (655)
Marital status - Asian population 15 years and over
Males 33.6% Never married56.7% Now married0.0% Separated0.0% Widowed9.7% DivorcedFemales 25.8% Never married46.5% Now married0.0% Separated13.1% Widowed14.7% DivorcedWomen who did not give birth in the past 12 months Now married:
43.6% (165)Unmarried:
56.4% (213)
Marital status - Native Hawaiian / Pacific Islander population 15 years and over
Males 0.0% Never married100.0% Now married0.0% Separated0.0% Widowed0.0% DivorcedFemales 0.0% Never married0.0% Now married0.0% Separated0.0% Widowed100.0% DivorcedWomen who did not give birth in the past 12 months Now married:
0.0% (0)Unmarried:
100.0% (12)
Marital status - Other race population 15 years and over
Males 15.4% Never married83.5% Now married0.0% Separated0.0% Widowed1.1% DivorcedFemales 38.8% Never married56.0% Now married0.0% Separated5.1% Widowed0.0% DivorcedWomen who gave birth in the past 12 months Now married:
100.0% (97)Unmarried:
0.0% (0)
Women who did not give birth in the past 12 months Now married:
48.5% (296)Unmarried:
51.5% (314)
Marital status - Two or more races population 15 years and over
Males 36.0% Never married60.3% Now married1.4% Separated0.0% Widowed2.4% DivorcedFemales 47.1% Never married38.8% Now married1.3% Separated0.8% Widowed12.0% DivorcedWomen who gave birth in the past 12 months Now married:
96.7% (251)Unmarried:
3.3% (9)
Women who did not give birth in the past 12 months Now married:
22.7% (319)Unmarried:
77.3% (1,085)
Marital status - White alone, not Hispanic / Latino population 15 years and over
Males 29.2% Never married58.8% Now married1.6% Separated3.4% Widowed7.0% DivorcedFemales 27.0% Never married52.1% Now married0.4% Separated5.7% Widowed14.7% DivorcedWomen who gave birth in the past 12 months Now married:
100.0% (251)Unmarried:
0.0% (0)
Women who did not give birth in the past 12 months Now married:
52.6% (3,200)Unmarried:
47.4% (2,888)
Marital status - Hispanic or Latino population 15 years and over
Males 17.7% Never married77.5% Now married1.1% Separated0.0% Widowed3.8% DivorcedFemales 37.7% Never married42.6% Now married0.0% Separated2.3% Widowed17.4% DivorcedWomen who gave birth in the past 12 months Now married:
60.0% (7)Unmarried:
40.0% (4)
Women who did not give birth in the past 12 months Now married:
43.4% (564)Unmarried:
56.6% (736)
Ancestries in Woodstock
1,715 10.5% English1,640 10.0% American1,481 9.0% German1,460 8.9% Irish638 3.9% European459 2.8% Polish409 2.5% Italian374 2.3% Yugoslavian312 1.9% Scottish234 1.4% Brazilian232 1.4% Nigerian229 1.4% British196 1.2% Haitian155 0.9% Scotch-Irish110 0.7% French101 0.6% Iranian100 0.6% Palestinian77 0.5% Romanian67 0.4% Russian65 0.4% Norwegian63 0.4% Jamaican61 0.4% Dutch53 0.3% Greek46 0.3% African44 0.3% French Canadian43 0.3% Canadian42 0.3% Austrian42 0.3% Eastern European42 0.3% Finnish41 0.3% Welsh37 0.2% Turkish35 0.2% West Indian33 0.2% Danish26 0.2% Swedish23 0.1% Lebanese20 0.1% Cypriot18 0.1% Lithuanian15 0.09% Portuguese12 0.07% Ukrainian9 0.05% Israeli5 0.03% Czech3 0.02% Croatian
Geographical mobility in Woodstock Same house 1 year ago 21,262 85.3% White (Caucasian)2,816 91.8% Black or African American52 99.5% American Indian / Alaska Native1,222 95.3% Asian39 100.0% Native Hawaiian / Pacific Islander1,539 99.7% Other race3,828 79.0% Two or more races21,383 87.9% White alone, not Hispanic / Latino2,437 67.4% Hispanic or LatinoMoved within same county 888 3.6% White / Caucasian150 4.9% Black or African American34 0.7% Two or more races899 3.7% White alone, not Hispanic / Latino15 0.4% Hispanic or LatinoMoved within same state 1,766 7.1% White / Caucasian156 5.1% Black or African American39 3.1% Asian620 12.8% Two or more races1,334 5.5% White alone, not Hispanic / Latino804 22.2% Hispanic or LatinoMoved from different state 698 2.8% White / Caucasian145 4.7% Black or African American24 1.9% Asian295 6.1% Two or more races450 1.9% White alone, not Hispanic / Latino595 16.5% Hispanic or LatinoMoved from abroad 45 0.2% White87 2.8% Black or African American55 0.2% White alone, not Hispanic / Latino
Children Nativity (place of birth) in Woodstock
Children under 6 years - Living with two parents Both parents native 1,589 100.0% NativeBoth parents foreign-born 396 100.0% NativeOne native, one foreign-born parent 212 100.0% NativeChildren under 6 years - Living with one parent Native parent 493 100.0% NativeForeign-born parent 29 100.0% NativeChildren 6 to 17 years - Living with two parents Both parents native 3,329 99.7% Native11 0.3% Foreign-bornBoth parents foreign-born 636 85.9% Native104 14.1% Foreign-bornOne native, one foreign-born parent 253 100.0% NativeChildren 6 to 17 years - Living with one parent Native parent 1,334 100.0% NativeForeign-born parent 64 54.9% Native52 45.1% Foreign-born
Grandparents responsible for own grandchildren in Woodstock
Grandparents (30 to 59 years) Black or African American 32 100.0% Not responsible for grandchildren
Grandparents (60 years and over) Black or African American 55 100.0% Responsible for grandchildren