Races in Woodridge, Illinois (IL) Detailed Stats
Data:
Races - White alone (%)
Races - White alone (% change since 2000)
Races - Black alone (%)
Races - Black alone (% change since 2000)
Races - American Indian alone (%)
Races - American Indian alone (% change since 2000)
Races - Asian alone (%)
Races - Asian alone (% change since 2000)
Races - Hispanic (%)
Races - Hispanic (% change since 2000)
Races - Native Hawaiian and Other Pacific Islander alone (%)
Races - Native Hawaiian and Other Pacific Islander alone (% change since 2000)
Races - Two or more races(%)
Races - Two or more races(% change since 2000)
Races - Other race alone (%)
Races - Other race alone (% change since 2000)
Racial diversity
Place of birth - Born in state of residence (%)
Place of birth - Born in state of residence (%) - White
Place of birth - Born in state of residence (%) - Black or African American
Place of birth - Born in state of residence (%) - Asian
Place of birth - Born in state of residence (%) - Hispanic or Latino
Place of birth - Born in state of residence (%) - American Indian and Alaska Native
Place of birth - Born in state of residence (%) - Multirace
Place of birth - Born in state of residence (%) - Other Race
Place of birth - Born in other state (%)
Place of birth - Born in other state (%) - White
Place of birth - Born in other state (%) - Black or African American
Place of birth - Born in other state (%) - Asian
Place of birth - Born in other state (%) - Hispanic or Latino
Place of birth - Born in other state (%) - American Indian and Alaska Native
Place of birth - Born in other state (%) - Multirace
Place of birth - Born in other state (%) - Other Race
Place of birth - Native, outside of US (%)
Place of birth - Native, outside of US (%) - White
Place of birth - Native, outside of US (%) - Black or African American
Place of birth - Native, outside of US (%) - Asian
Place of birth - Native, outside of US (%) - Hispanic or Latino
Place of birth - Native, outside of US (%) - American Indian and Alaska Native
Place of birth - Native, outside of US (%) - Multirace
Place of birth - Native, outside of US (%) - Other Race
Place of birth - Foreign born (%)
Place of birth - Foreign born (%) - White
Place of birth - Foreign born (%) - Black or African American
Place of birth - Foreign born (%) - Asian
Place of birth - Foreign born (%) - Hispanic or Latino
Place of birth - Foreign born (%) - American Indian and Alaska Native
Place of birth - Foreign born (%) - Multirace
Place of birth - Foreign born (%) - Other Race
Residents speaking English at home (%)
Residents speaking English at home - Born in the United States (%)
Residents speaking English at home - Native, born elsewhere (%)
Residents speaking English at home - Foreign born (%)
Residents speaking Spanish at home (%)
Residents speaking Spanish at home - Born in the United States (%)
Residents speaking Spanish at home - Native, born elsewhere (%)
Residents speaking Spanish at home - Foreign born (%)
Residents speaking other language at home (%)
Residents speaking other language at home - Born in the United States (%)
Residents speaking other language at home - Native, born elsewhere (%)
Residents speaking other language at home - Foreign born (%)
Marital status - Never married (%)
Marital status - Now married (%)
Marital status - Separated (%)
Marital status - Widowed (%)
Marital status - Divorced (%)
Ancestries Reported - Arab (%)
Ancestries Reported - Czech (%)
Ancestries Reported - Danish (%)
Ancestries Reported - Dutch (%)
Ancestries Reported - English (%)
Ancestries Reported - French (%)
Ancestries Reported - French Canadian (%)
Ancestries Reported - German (%)
Ancestries Reported - Greek (%)
Ancestries Reported - Hungarian (%)
Ancestries Reported - Irish (%)
Ancestries Reported - Italian (%)
Ancestries Reported - Lithuanian (%)
Ancestries Reported - Norwegian (%)
Ancestries Reported - Polish (%)
Ancestries Reported - Portuguese (%)
Ancestries Reported - Russian (%)
Ancestries Reported - Scotch-Irish (%)
Ancestries Reported - Scottish (%)
Ancestries Reported - Slovak (%)
Ancestries Reported - Subsaharan African (%)
Ancestries Reported - Swedish (%)
Ancestries Reported - Swiss (%)
Ancestries Reported - Ukrainian (%)
Ancestries Reported - United States (%)
Ancestries Reported - Welsh (%)
Ancestries Reported - West Indian (%)
Ancestries Reported - Other (%)
Geographical mobility - Same house 1 year ago (%)
Geographical mobility - Same house 1 year ago (%) - White
Geographical mobility - Same house 1 year ago (%) - Black or African American
Geographical mobility - Same house 1 year ago (%) - Asian
Geographical mobility - Same house 1 year ago (%) - Hispanic or Latino
Geographical mobility - Same house 1 year ago (%) - American Indian and Alaska Native
Geographical mobility - Same house 1 year ago (%) - Multirace
Geographical mobility - Same house 1 year ago (%) - Other Race
Geographical mobility - Moved within same county (%)
Geographical mobility - Moved within same county (%) - White
Geographical mobility - Moved within same county (%) - Black or African American
Geographical mobility - Moved within same county (%) - Asian
Geographical mobility - Moved within same county (%) - Hispanic or Latino
Geographical mobility - Moved within same county (%) - American Indian and Alaska Native
Geographical mobility - Moved within same county (%) - Multirace
Geographical mobility - Moved within same county (%) - Other Race
Geographical mobility - Moved from different county within same state (%)
Geographical mobility - Moved from different county within same state (%) - White
Geographical mobility - Moved from different county within same state (%) - Black or African American
Geographical mobility - Moved from different county within same state (%) - Asian
Geographical mobility - Moved from different county within same state (%) - Hispanic or Latino
Geographical mobility - Moved from different county within same state (%) - American Indian and Alaska Native
Geographical mobility - Moved from different county within same state (%) - Multirace
Geographical mobility - Moved from different county within same state (%) - Other Race
Geographical mobility - Moved from different state (%)
Geographical mobility - Moved from different state (%) - White
Geographical mobility - Moved from different state (%) - Black or African American
Geographical mobility - Moved from different state (%) - Asian
Geographical mobility - Moved from different state (%) - Hispanic or Latino
Geographical mobility - Moved from different state (%) - American Indian and Alaska Native
Geographical mobility - Moved from different state (%) - Multirace
Geographical mobility - Moved from different state (%) - Other Race
Geographical mobility - Moved from abroad (%)
Geographical mobility - Moved from abroad (%) - White
Geographical mobility - Moved from abroad (%) - Black or African American
Geographical mobility - Moved from abroad (%) - Asian
Geographical mobility - Moved from abroad (%) - Hispanic or Latino
Geographical mobility - Moved from abroad (%) - American Indian and Alaska Native
Geographical mobility - Moved from abroad (%) - Multirace
Geographical mobility - Moved from abroad (%) - Other Race
Place of birth for the foreign-born population - Ireland (%)
Place of birth for the foreign-born population - Denmark (%)
Place of birth for the foreign-born population - Norway (%)
Place of birth for the foreign-born population - Sweden (%)
Place of birth for the foreign-born population - United Kingdom (%)
Place of birth for the foreign-born population - England (%)
Place of birth for the foreign-born population - Scotland (%)
Place of birth for the foreign-born population - Other Northern Europe (%)
Place of birth for the foreign-born population - Austria (%)
Place of birth for the foreign-born population - Belgium (%)
Place of birth for the foreign-born population - France (%)
Place of birth for the foreign-born population - Germany (%)
Place of birth for the foreign-born population - Netherlands (%)
Place of birth for the foreign-born population - Switzerland (%)
Place of birth for the foreign-born population - Other Western Europe (%)
Place of birth for the foreign-born population - Greece (%)
Place of birth for the foreign-born population - Italy (%)
Place of birth for the foreign-born population - Portugal (%)
Place of birth for the foreign-born population - Spain (%)
Place of birth for the foreign-born population - Other Southern Europe (%)
Place of birth for the foreign-born population - Albania (%)
Place of birth for the foreign-born population - Belarus (%)
Place of birth for the foreign-born population - Bosnia and Herzegovina (%)
Place of birth for the foreign-born population - Bulgaria (%)
Place of birth for the foreign-born population - Croatia (%)
Place of birth for the foreign-born population - Czechoslovakia (%)
Place of birth for the foreign-born population - Hungary (%)
Place of birth for the foreign-born population - Latvia (%)
Place of birth for the foreign-born population - Lithuania (%)
Place of birth for the foreign-born population - North Macedonia (Macedonia) (%)
Place of birth for the foreign-born population - Moldova (%)
Place of birth for the foreign-born population - Poland (%)
Place of birth for the foreign-born population - Romania (%)
Place of birth for the foreign-born population - Russia (%)
Place of birth for the foreign-born population - Serbia (%)
Place of birth for the foreign-born population - Ukraine (%)
Place of birth for the foreign-born population - Other Eastern Europe (%)
Place of birth for the foreign-born population - China (%)
Place of birth for the foreign-born population - Hong Kong (%)
Place of birth for the foreign-born population - Taiwan (%)
Place of birth for the foreign-born population - Japan (%)
Place of birth for the foreign-born population - Korea (%)
Place of birth for the foreign-born population - Other Eastern Asia (%)
Place of birth for the foreign-born population - Afghanistan (%)
Place of birth for the foreign-born population - Bangladesh (%)
Place of birth for the foreign-born population - India (%)
Place of birth for the foreign-born population - Iran (%)
Place of birth for the foreign-born population - Kazakhstan (%)
Place of birth for the foreign-born population - Nepal (%)
Place of birth for the foreign-born population - Pakistan (%)
Place of birth for the foreign-born population - Sri Lanka (%)
Place of birth for the foreign-born population - Uzbekistan (%)
Place of birth for the foreign-born population - Other South Central Asia (%)
Place of birth for the foreign-born population - Burma (%)
Place of birth for the foreign-born population - Cambodia (%)
Place of birth for the foreign-born population - Indonesia (%)
Place of birth for the foreign-born population - Laos (%)
Place of birth for the foreign-born population - Malaysia (%)
Place of birth for the foreign-born population - Philippines (%)
Place of birth for the foreign-born population - Singapore (%)
Place of birth for the foreign-born population - Thailand (%)
Place of birth for the foreign-born population - Vietnam (%)
Place of birth for the foreign-born population - Other South Eastern Asia (%)
Place of birth for the foreign-born population - Armenia (%)
Place of birth for the foreign-born population - Iraq (%)
Place of birth for the foreign-born population - Israel (%)
Place of birth for the foreign-born population - Jordan (%)
Place of birth for the foreign-born population - Kuwait (%)
Place of birth for the foreign-born population - Lebanon (%)
Place of birth for the foreign-born population - Saudi Arabia (%)
Place of birth for the foreign-born population - Syria (%)
Place of birth for the foreign-born population - Turkey (%)
Place of birth for the foreign-born population - Yemen (%)
Place of birth for the foreign-born population - Other Western Asia (%)
Place of birth for the foreign-born population - Eritrea (%)
Place of birth for the foreign-born population - Ethiopia (%)
Place of birth for the foreign-born population - Kenya (%)
Place of birth for the foreign-born population - Somalia (%)
Place of birth for the foreign-born population - Uganda (%)
Place of birth for the foreign-born population - Zimbabwe (%)
Place of birth for the foreign-born population - Other Eastern Africa (%)
Place of birth for the foreign-born population - Cameroon (%)
Place of birth for the foreign-born population - Congo (%)
Place of birth for the foreign-born population - Democratic Republic of Congo (Zaire) (%)
Place of birth for the foreign-born population - Other Middle Africa (%)
Place of birth for the foreign-born population - Egypt (%)
Place of birth for the foreign-born population - Morocco (%)
Place of birth for the foreign-born population - Sudan (%)
Place of birth for the foreign-born population - Other Northern Africa (%)
Place of birth for the foreign-born population - South Africa (%)
Place of birth for the foreign-born population - Other Southern Africa (%)
Place of birth for the foreign-born population - Cabo Verde (%)
Place of birth for the foreign-born population - Ghana (%)
Place of birth for the foreign-born population - Liberia (%)
Place of birth for the foreign-born population - Nigeria (%)
Place of birth for the foreign-born population - Senegal (%)
Place of birth for the foreign-born population - Sierra Leone (%)
Place of birth for the foreign-born population - Other Western Africa (%)
Place of birth for the foreign-born population - Australia (%)
Place of birth for the foreign-born population - New Zealand (%)
Place of birth for the foreign-born population - Fiji (%)
Place of birth for the foreign-born population - Micronesia (%)
Place of birth for the foreign-born population - Bahamas (%)
Place of birth for the foreign-born population - Barbados (%)
Place of birth for the foreign-born population - Cuba (%)
Place of birth for the foreign-born population - Dominica (%)
Place of birth for the foreign-born population - Dominican Republic (%)
Place of birth for the foreign-born population - Grenada (%)
Place of birth for the foreign-born population - Haiti (%)
Place of birth for the foreign-born population - Jamaica (%)
Place of birth for the foreign-born population - St. Vincent and the Grenadines (%)
Place of birth for the foreign-born population - Trinidad and Tobago (%)
Place of birth for the foreign-born population - West Indies (%)
Place of birth for the foreign-born population - Other Caribbean (%)
Place of birth for the foreign-born population - Belize (%)
Place of birth for the foreign-born population - Costa Rica (%)
Place of birth for the foreign-born population - El Salvador (%)
Place of birth for the foreign-born population - Guatemala (%)
Place of birth for the foreign-born population - Honduras (%)
Place of birth for the foreign-born population - Mexico (%)
Place of birth for the foreign-born population - Nicaragua (%)
Place of birth for the foreign-born population - Panama (%)
Place of birth for the foreign-born population - Other Central America (%)
Place of birth for the foreign-born population - Argentina (%)
Place of birth for the foreign-born population - Bolivia (%)
Place of birth for the foreign-born population - Brazil (%)
Place of birth for the foreign-born population - Chile (%)
Place of birth for the foreign-born population - Colombia (%)
Place of birth for the foreign-born population - Ecuador (%)
Place of birth for the foreign-born population - Guyana (%)
Place of birth for the foreign-born population - Peru (%)
Place of birth for the foreign-born population - Uruguay (%)
Place of birth for the foreign-born population - Venezuela (%)
Place of birth for the foreign-born population - Other South America (%)
Place of birth for the foreign-born population - Canada (%)
Place of birth for the foreign-born population - Other Northern America (%)
Place of birth for the foreign-born population - Other (%)
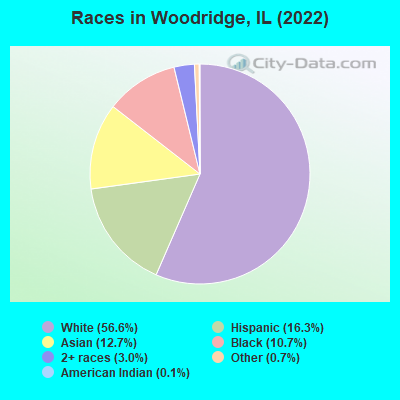
According to 2022 data, the most numerous races in Woodridge, IL are White alone (19,052 residents), Hispanic (5,478 residents), and Black alone (3,613 residents). 68.6% of Woodridge residents speak English at home. 21.3% of Woodridge, IL residents are foreign-born (8.7% born in Asia, 5.0% born in Latin America, 4.4% born in Europe, 2.8% born in Africa), which is 34.3% greater than the foreign-born rate of 14.0% across the entire state of Illinois.
Race distribution in Woodridge
2000 2022
8,424,140 67.8% White alone 1,856,152 14.9% Black alone 1,530,262 12.3% Hispanic 419,916 3.4% Asian alone 153,996 1.2% Two or more races 13,479 0.1% Other race alone 18,232 0.1% American Indian alone 3,116 0.03% Native Hawaiian and Other
7,356,301 58.5% White alone 2,299,726 18.3% Hispanic 1,660,423 13.2% Black alone 747,296 5.9% Asian alone 458,599 3.6% Two or more races 45,386 0.4% Other race alone 10,405 0.08% American Indian alone 3,896 0.03% Native Hawaiian and Other
Income and house value in Woodridge Median household income in 2022 $103,490 White non-Hispanic householders$54,064 Black householders$121,680 Asian householders$53,484 Some other race householders$69,725 Two or more races householders$67,331 Hispanic or Latino race householdersMedian 2022 house value $349,050 White Non-Hispanic householders$375,192 Black or African American householders$470,559 American Indian or Alaska Native householders $393,596 Asian householders$278,780 Some other race householders$393,596 Two or more races householders$320,816 Hispanic or Latino householders
Median age by race in Woodridge
41.4 Median age for White residents39.3 43.3 35.2 Median age for Black or African American residents35.6 37.1 41.1 Median age for American Indian / Alaska Native residents-721,943,047.9 26.3 37.7 Median age for Asian residents36.4 42.3 -593,236,714.4 Median age for Native Hawaiian / Pacific Islander residents-658,536,584.7 -576,015,108.0 30.8 Median age for Other race residents26.6 41.9 25.9 Median age for Two or more races residents25.6 24.2 42.6 Median age for White alone residents41.4 44.0 26.8 Median age for Hispanic or Latino residents23.2 30.6
Owner/renter occupied households by race in Woodridge
House owners and renters - White residents 6,604 76.3% Owner occupied2,052 23.7% Renter occupiedHouse owners and renters - Black or African American residents 198 13.8% Owner occupied1,238 86.2% Renter occupiedHouse owners and renters - American Indian / Alaska Native residents 23 100.0% Owner occupiedHouse owners and renters - Asian residents 1,249 81.3% Owner occupied288 18.7% Renter occupiedHouse owners and renters - Other race residents 285 45.7% Owner occupied338 54.3% Renter occupiedHouse owners and renters - Two or more races residents 518 58.9% Owner occupied361 41.1% Renter occupiedHouse owners and renters - White alone residents 6,431 78.0% Owner occupied1,817 22.0% Renter occupiedHouse owners and renters - Hispanic or Latino residents 758 50.8% Owner occupied733 49.2% Renter occupied
Language usage in Woodridge
English speakers - Total 68.6% of residents of Woodridge speak English at home.
12.3% of residents speak Spanish at home 2,533 64.9% Speak English very well1,369 35.1% Speak English less than very well19.0% of residents speak other language at home 4,006 66.5% Speak English very well2,021 33.5% Speak English less than very well
English speakers - Born in the United States 90.6% of residents of Woodridge speak English at home.
2.8% of residents speak Spanish at home 118 100.0% Speak English very well6.9% of residents speak other language at home 255 87.6% Speak English very well36 12.4% Speak English less than very well
English speakers - Native, born elsewhere 55.7% of residents of Woodridge speak English at home.
27.2% of residents speak Spanish at home 87 61.7% Speak English very well54 38.3% Speak English less than very well19.5% of residents speak other language at home 101 100.0% Speak English very well
English speakers - Foreign-born 11.2% of residents of Woodridge speak English at home.
22.9% of residents speak Spanish at home 657 40.1% Speak English very well982 59.9% Speak English less than very well65.5% of residents speak other language at home 2,747 58.6% Speak English very well1,937 41.4% Speak English less than very well
White (Caucasian) - Speak only English Native:
93.1% (15,899)Foreign-born:
15.6% (345)
White (Caucasian) - Speak another language Native:
6.6% (1,125)Foreign-born:
84.1% (1,866)
Black or African American - Speak only English Native:
90.8% (2,842)Foreign-born:
9.7% (21)
Black or African American - Speak another language Native:
7.6% (237)Foreign-born:
100.0% (213)
Asian - Speak only English Native:
58.2% (596)Foreign-born:
13.5% (396)
Asian - Speak another language Native:
41.5% (426)Foreign-born:
85.8% (2,528)
Other race - Speak another language Native:
63.6% (818)Foreign-born:
100.0% (514)
Two or more races - Speak only English Native:
54.4% (1,137)Foreign-born:
1.5% (14)
Two or more races - Speak another language Native:
47.6% (995)Foreign-born:
100.0% (928)
White alone - Speak only English Native:
95.2% (15,329)Foreign-born:
14.4% (290)
White alone - Speak another language Native:
4.8% (771)Foreign-born:
85.4% (1,714)
Hispanic or Latino - Speak only English Native:
38.4% (1,273)Foreign-born:
4.8% (82)
Hispanic or Latino - Speak another language Native:
61.7% (2,048)Foreign-born:
95.6% (1,655)
Foreign-born residents in Woodridge 7,174 residents are foreign born (8.7% Asia , 5.0% Latin America , 4.4% Europe , 2.8% Africa ).
This city:
21.3%Illinois:
14.1%
Marital status for residents in Woodridge Marital status - White (Caucasian) population 15 years and over
Males 34.0% Never married56.6% Now married0.9% Separated2.7% Widowed5.7% DivorcedFemales 25.7% Never married55.2% Now married0.6% Separated8.1% Widowed10.5% DivorcedWomen who gave birth in the past 12 months Now married:
89.7% (170)Unmarried:
10.3% (19)
Women who did not give birth in the past 12 months Now married:
52.2% (1,981)Unmarried:
47.8% (1,812)
Marital status - Black or African American population 15 years and over
Males 56.9% Never married34.9% Now married0.0% Separated0.0% Widowed8.3% DivorcedFemales 41.0% Never married28.0% Now married2.4% Separated11.0% Widowed17.7% DivorcedWomen who gave birth in the past 12 months Now married:
0.0% (0)Unmarried:
100.0% (125)
Women who did not give birth in the past 12 months Now married:
42.7% (339)Unmarried:
57.3% (454)
Marital status - American Indian / Alaska Native population 15 years and over
Males 100.0% Never married0.0% Now married0.0% Separated0.0% Widowed0.0% DivorcedFemales 18.5% Never married81.5% Now married0.0% Separated0.0% Widowed0.0% DivorcedWomen who did not give birth in the past 12 months Now married:
64.3% (15)Unmarried:
35.7% (8)
Marital status - Asian population 15 years and over
Males 37.0% Never married60.5% Now married0.0% Separated0.0% Widowed2.4% DivorcedFemales 16.2% Never married67.0% Now married0.5% Separated11.9% Widowed4.3% DivorcedWomen who gave birth in the past 12 months Now married:
87.3% (62)Unmarried:
12.7% (9)
Women who did not give birth in the past 12 months Now married:
63.2% (564)Unmarried:
36.8% (329)
Marital status - Other race population 15 years and over
Males 58.7% Never married37.1% Now married0.0% Separated0.0% Widowed4.2% DivorcedFemales 35.3% Never married31.3% Now married0.0% Separated8.6% Widowed24.8% DivorcedWomen who gave birth in the past 12 months Now married:
100.0% (8)Unmarried:
0.0% (0)
Women who did not give birth in the past 12 months Now married:
28.9% (158)Unmarried:
71.1% (388)
Marital status - Two or more races population 15 years and over
Males 50.1% Never married42.7% Now married0.0% Separated3.7% Widowed3.5% DivorcedFemales 41.2% Never married39.4% Now married6.8% Separated1.6% Widowed10.9% DivorcedWomen who gave birth in the past 12 months Now married:
100.0% (31)Unmarried:
0.0% (0)
Women who did not give birth in the past 12 months Now married:
46.7% (538)Unmarried:
53.3% (615)
Marital status - White alone, not Hispanic / Latino population 15 years and over
Males 31.5% Never married58.6% Now married1.0% Separated3.0% Widowed5.9% DivorcedFemales 24.8% Never married55.6% Now married0.6% Separated8.6% Widowed10.4% DivorcedWomen who gave birth in the past 12 months Now married:
89.4% (175)Unmarried:
10.6% (21)
Women who did not give birth in the past 12 months Now married:
52.8% (1,931)Unmarried:
47.2% (1,728)
Marital status - Hispanic or Latino population 15 years and over
Males 53.3% Never married41.2% Now married0.0% Separated1.5% Widowed4.0% DivorcedFemales 39.1% Never married42.9% Now married0.7% Separated4.5% Widowed12.8% DivorcedWomen who gave birth in the past 12 months Now married:
100.0% (36)Unmarried:
0.0% (0)
Women who did not give birth in the past 12 months Now married:
41.0% (562)Unmarried:
59.0% (808)
Ancestries in Woodridge
1,136 6.8% Italian1,109 6.6% Irish1,055 6.3% Polish1,019 6.1% German609 3.6% Romanian607 3.6% American439 2.6% Ghanaian359 2.1% Ukrainian307 1.8% Czech268 1.6% English261 1.6% Lebanese243 1.5% Greek224 1.3% Arab199 1.2% Lithuanian169 1.0% European161 1.0% Egyptian144 0.9% African87 0.5% Scottish65 0.4% Norwegian62 0.4% Czechoslovakian57 0.3% Nigerian53 0.3% Austrian48 0.3% Brazilian43 0.3% Eastern European37 0.2% Russian36 0.2% Swedish33 0.2% Scotch-Irish33 0.2% Serbian31 0.2% Dutch26 0.2% Croatian26 0.2% Turkish23 0.1% Latvian16 0.10% Slovak16 0.10% French15 0.09% Macedonian15 0.09% British15 0.09% Afghan14 0.08% Northern European14 0.08% Jordanian14 0.08% Hungarian13 0.08% Jamaican11 0.07% Palestinian9 0.05% Finnish5 0.03% Estonian3 0.02% Canadian
Geographical mobility in Woodridge Same house 1 year ago 18,277 90.3% White (Caucasian)3,408 95.1% Black or African American104 99.7% American Indian / Alaska Native3,598 84.6% Asian1,695 91.2% Other race2,924 88.6% Two or more races16,942 89.7% White alone, not Hispanic / Latino4,978 91.7% Hispanic or LatinoMoved within same county 857 4.2% White / Caucasian128 3.6% Black or African American185 4.3% Asian95 5.1% Other race217 6.6% Two or more races848 4.5% White alone, not Hispanic / Latino228 4.2% Hispanic or LatinoMoved within same state 852 4.2% White / Caucasian120 3.4% Black or African American337 7.9% Asian32 1.7% Other race97 2.9% Two or more races839 4.4% White alone, not Hispanic / Latino100 1.8% Hispanic or LatinoMoved from different state 169 0.8% White / Caucasian4 0.1% Black or African American94 2.2% Asian175 0.9% White alone, not Hispanic / LatinoMoved from abroad 67 0.3% White69 1.6% Asian20 0.6% Two or more races71 0.4% White alone, not Hispanic / Latino28 0.5% Hispanic or Latino
Children Nativity (place of birth) in Woodridge
Children under 6 years - Living with two parents Both parents native 955 99.9% Native1 0.1% Foreign-bornBoth parents foreign-born 735 97.9% Native16 2.1% Foreign-bornOne native, one foreign-born parent 225 100.0% NativeChildren under 6 years - Living with one parent Native parent 289 100.0% NativeForeign-born parent 169 100.0% NativeChildren 6 to 17 years - Living with two parents Both parents native 2,104 100.0% NativeBoth parents foreign-born 891 70.5% Native373 29.5% Foreign-bornOne native, one foreign-born parent 192 92.5% Native15 7.5% Foreign-bornChildren 6 to 17 years - Living with one parent Native parent 786 100.0% NativeForeign-born parent 590 55.3% Native476 44.7% Foreign-born
Place of birth for residents in Woodridge 2,963 Asia1,760 Americas1,711 Latin America1,488 Europe1,383 Central America1,300 South Central Asia1,130 Eastern Europe1,012 South Eastern Asia954 Africa512 Eastern Asia473 Western Africa393 Northern Africa362 China259 South America153 Western Europe138 Western Asia120 Southern Europe84 Northern Europe68 Caribbean57 Eastern Africa49 Northern America31 Middle Africa7 Oceania7 Australia and New Zealand Subregion1,371 Mexico1,190 India932 Philippines517 Moldova419 Ghana239 China219 Egypt180 Ukraine150 Korea140 Poland120 Italy118 Germany112 Venezuela92 Pakistan87 Taiwan75 Russia73 Lithuania62 United Kingdom57 Vietnam54 Nigeria53 Cuba49 Czechoslovakia49 Canada46 Uruguay40 Brazil38 Romania38 Saudi Arabia36 Ecuador35 Hong Kong34 Uganda28 Turkey27 Jordan23 Kenya23 Austria22 Cambodia21 Democratic Republic of Congo (Zaire)19 Georgia16 North Macedonia (Macedonia)15 Serbia15 Jamaica14 Latvia12 Afghanistan12 Netherlands12 Nicaragua12 Colombia11 Azerbaijan10 Congo10 Ireland8 Lebanon7 Argentina7 Australia6 Bangladesh6 Croatia6 Peru
Grandparents responsible for own grandchildren in Woodridge
Grandparents (30 to 59 years) White / Caucasian 44 100.0% Not responsible for grandchildrenBlack or African American 68 64.6% Responsible for grandchildren37 35.4% Not responsible for grandchildrenOther race 51 100.0% Not responsible for grandchildrenWhite alone, not Hispanic / Latino 11 100.0% Not responsible for grandchildrenHispanic or Latino 149 100.0% Not responsible for grandchildrenGrandparents (60 years and over) White / Caucasian 144 100.0% Not responsible for grandchildrenBlack or African American 147 100.0% Responsible for grandchildrenOther race 8 53.7% Responsible for grandchildren7 46.3% Not responsible for grandchildrenWhite alone, not Hispanic / Latino 128 100.0% Not responsible for grandchildrenHispanic or Latino 13 11.3% Responsible for grandchildren102 88.7% Not responsible for grandchildren