Races in Woodlawn, Maryland (MD) Detailed Stats
Data:
Races - White alone (%)
Races - White alone (% change since 2000)
Races - Black alone (%)
Races - Black alone (% change since 2000)
Races - American Indian alone (%)
Races - American Indian alone (% change since 2000)
Races - Asian alone (%)
Races - Asian alone (% change since 2000)
Races - Hispanic (%)
Races - Hispanic (% change since 2000)
Races - Native Hawaiian and Other Pacific Islander alone (%)
Races - Native Hawaiian and Other Pacific Islander alone (% change since 2000)
Races - Two or more races(%)
Races - Two or more races(% change since 2000)
Races - Other race alone (%)
Races - Other race alone (% change since 2000)
Racial diversity
Place of birth - Born in state of residence (%)
Place of birth - Born in state of residence (%) - White
Place of birth - Born in state of residence (%) - Black or African American
Place of birth - Born in state of residence (%) - Asian
Place of birth - Born in state of residence (%) - Hispanic or Latino
Place of birth - Born in state of residence (%) - American Indian and Alaska Native
Place of birth - Born in state of residence (%) - Multirace
Place of birth - Born in state of residence (%) - Other Race
Place of birth - Born in other state (%)
Place of birth - Born in other state (%) - White
Place of birth - Born in other state (%) - Black or African American
Place of birth - Born in other state (%) - Asian
Place of birth - Born in other state (%) - Hispanic or Latino
Place of birth - Born in other state (%) - American Indian and Alaska Native
Place of birth - Born in other state (%) - Multirace
Place of birth - Born in other state (%) - Other Race
Place of birth - Native, outside of US (%)
Place of birth - Native, outside of US (%) - White
Place of birth - Native, outside of US (%) - Black or African American
Place of birth - Native, outside of US (%) - Asian
Place of birth - Native, outside of US (%) - Hispanic or Latino
Place of birth - Native, outside of US (%) - American Indian and Alaska Native
Place of birth - Native, outside of US (%) - Multirace
Place of birth - Native, outside of US (%) - Other Race
Place of birth - Foreign born (%)
Place of birth - Foreign born (%) - White
Place of birth - Foreign born (%) - Black or African American
Place of birth - Foreign born (%) - Asian
Place of birth - Foreign born (%) - Hispanic or Latino
Place of birth - Foreign born (%) - American Indian and Alaska Native
Place of birth - Foreign born (%) - Multirace
Place of birth - Foreign born (%) - Other Race
Residents speaking English at home (%)
Residents speaking English at home - Born in the United States (%)
Residents speaking English at home - Native, born elsewhere (%)
Residents speaking English at home - Foreign born (%)
Residents speaking Spanish at home (%)
Residents speaking Spanish at home - Born in the United States (%)
Residents speaking Spanish at home - Native, born elsewhere (%)
Residents speaking Spanish at home - Foreign born (%)
Residents speaking other language at home (%)
Residents speaking other language at home - Born in the United States (%)
Residents speaking other language at home - Native, born elsewhere (%)
Residents speaking other language at home - Foreign born (%)
Marital status - Never married (%)
Marital status - Now married (%)
Marital status - Separated (%)
Marital status - Widowed (%)
Marital status - Divorced (%)
Ancestries Reported - Arab (%)
Ancestries Reported - Czech (%)
Ancestries Reported - Danish (%)
Ancestries Reported - Dutch (%)
Ancestries Reported - English (%)
Ancestries Reported - French (%)
Ancestries Reported - French Canadian (%)
Ancestries Reported - German (%)
Ancestries Reported - Greek (%)
Ancestries Reported - Hungarian (%)
Ancestries Reported - Irish (%)
Ancestries Reported - Italian (%)
Ancestries Reported - Lithuanian (%)
Ancestries Reported - Norwegian (%)
Ancestries Reported - Polish (%)
Ancestries Reported - Portuguese (%)
Ancestries Reported - Russian (%)
Ancestries Reported - Scotch-Irish (%)
Ancestries Reported - Scottish (%)
Ancestries Reported - Slovak (%)
Ancestries Reported - Subsaharan African (%)
Ancestries Reported - Swedish (%)
Ancestries Reported - Swiss (%)
Ancestries Reported - Ukrainian (%)
Ancestries Reported - United States (%)
Ancestries Reported - Welsh (%)
Ancestries Reported - West Indian (%)
Ancestries Reported - Other (%)
Geographical mobility - Same house 1 year ago (%)
Geographical mobility - Same house 1 year ago (%) - White
Geographical mobility - Same house 1 year ago (%) - Black or African American
Geographical mobility - Same house 1 year ago (%) - Asian
Geographical mobility - Same house 1 year ago (%) - Hispanic or Latino
Geographical mobility - Same house 1 year ago (%) - American Indian and Alaska Native
Geographical mobility - Same house 1 year ago (%) - Multirace
Geographical mobility - Same house 1 year ago (%) - Other Race
Geographical mobility - Moved within same county (%)
Geographical mobility - Moved within same county (%) - White
Geographical mobility - Moved within same county (%) - Black or African American
Geographical mobility - Moved within same county (%) - Asian
Geographical mobility - Moved within same county (%) - Hispanic or Latino
Geographical mobility - Moved within same county (%) - American Indian and Alaska Native
Geographical mobility - Moved within same county (%) - Multirace
Geographical mobility - Moved within same county (%) - Other Race
Geographical mobility - Moved from different county within same state (%)
Geographical mobility - Moved from different county within same state (%) - White
Geographical mobility - Moved from different county within same state (%) - Black or African American
Geographical mobility - Moved from different county within same state (%) - Asian
Geographical mobility - Moved from different county within same state (%) - Hispanic or Latino
Geographical mobility - Moved from different county within same state (%) - American Indian and Alaska Native
Geographical mobility - Moved from different county within same state (%) - Multirace
Geographical mobility - Moved from different county within same state (%) - Other Race
Geographical mobility - Moved from different state (%)
Geographical mobility - Moved from different state (%) - White
Geographical mobility - Moved from different state (%) - Black or African American
Geographical mobility - Moved from different state (%) - Asian
Geographical mobility - Moved from different state (%) - Hispanic or Latino
Geographical mobility - Moved from different state (%) - American Indian and Alaska Native
Geographical mobility - Moved from different state (%) - Multirace
Geographical mobility - Moved from different state (%) - Other Race
Geographical mobility - Moved from abroad (%)
Geographical mobility - Moved from abroad (%) - White
Geographical mobility - Moved from abroad (%) - Black or African American
Geographical mobility - Moved from abroad (%) - Asian
Geographical mobility - Moved from abroad (%) - Hispanic or Latino
Geographical mobility - Moved from abroad (%) - American Indian and Alaska Native
Geographical mobility - Moved from abroad (%) - Multirace
Geographical mobility - Moved from abroad (%) - Other Race
Place of birth for the foreign-born population - Ireland (%)
Place of birth for the foreign-born population - Denmark (%)
Place of birth for the foreign-born population - Norway (%)
Place of birth for the foreign-born population - Sweden (%)
Place of birth for the foreign-born population - United Kingdom (%)
Place of birth for the foreign-born population - England (%)
Place of birth for the foreign-born population - Scotland (%)
Place of birth for the foreign-born population - Other Northern Europe (%)
Place of birth for the foreign-born population - Austria (%)
Place of birth for the foreign-born population - Belgium (%)
Place of birth for the foreign-born population - France (%)
Place of birth for the foreign-born population - Germany (%)
Place of birth for the foreign-born population - Netherlands (%)
Place of birth for the foreign-born population - Switzerland (%)
Place of birth for the foreign-born population - Other Western Europe (%)
Place of birth for the foreign-born population - Greece (%)
Place of birth for the foreign-born population - Italy (%)
Place of birth for the foreign-born population - Portugal (%)
Place of birth for the foreign-born population - Spain (%)
Place of birth for the foreign-born population - Other Southern Europe (%)
Place of birth for the foreign-born population - Albania (%)
Place of birth for the foreign-born population - Belarus (%)
Place of birth for the foreign-born population - Bosnia and Herzegovina (%)
Place of birth for the foreign-born population - Bulgaria (%)
Place of birth for the foreign-born population - Croatia (%)
Place of birth for the foreign-born population - Czechoslovakia (%)
Place of birth for the foreign-born population - Hungary (%)
Place of birth for the foreign-born population - Latvia (%)
Place of birth for the foreign-born population - Lithuania (%)
Place of birth for the foreign-born population - North Macedonia (Macedonia) (%)
Place of birth for the foreign-born population - Moldova (%)
Place of birth for the foreign-born population - Poland (%)
Place of birth for the foreign-born population - Romania (%)
Place of birth for the foreign-born population - Russia (%)
Place of birth for the foreign-born population - Serbia (%)
Place of birth for the foreign-born population - Ukraine (%)
Place of birth for the foreign-born population - Other Eastern Europe (%)
Place of birth for the foreign-born population - China (%)
Place of birth for the foreign-born population - Hong Kong (%)
Place of birth for the foreign-born population - Taiwan (%)
Place of birth for the foreign-born population - Japan (%)
Place of birth for the foreign-born population - Korea (%)
Place of birth for the foreign-born population - Other Eastern Asia (%)
Place of birth for the foreign-born population - Afghanistan (%)
Place of birth for the foreign-born population - Bangladesh (%)
Place of birth for the foreign-born population - India (%)
Place of birth for the foreign-born population - Iran (%)
Place of birth for the foreign-born population - Kazakhstan (%)
Place of birth for the foreign-born population - Nepal (%)
Place of birth for the foreign-born population - Pakistan (%)
Place of birth for the foreign-born population - Sri Lanka (%)
Place of birth for the foreign-born population - Uzbekistan (%)
Place of birth for the foreign-born population - Other South Central Asia (%)
Place of birth for the foreign-born population - Burma (%)
Place of birth for the foreign-born population - Cambodia (%)
Place of birth for the foreign-born population - Indonesia (%)
Place of birth for the foreign-born population - Laos (%)
Place of birth for the foreign-born population - Malaysia (%)
Place of birth for the foreign-born population - Philippines (%)
Place of birth for the foreign-born population - Singapore (%)
Place of birth for the foreign-born population - Thailand (%)
Place of birth for the foreign-born population - Vietnam (%)
Place of birth for the foreign-born population - Other South Eastern Asia (%)
Place of birth for the foreign-born population - Armenia (%)
Place of birth for the foreign-born population - Iraq (%)
Place of birth for the foreign-born population - Israel (%)
Place of birth for the foreign-born population - Jordan (%)
Place of birth for the foreign-born population - Kuwait (%)
Place of birth for the foreign-born population - Lebanon (%)
Place of birth for the foreign-born population - Saudi Arabia (%)
Place of birth for the foreign-born population - Syria (%)
Place of birth for the foreign-born population - Turkey (%)
Place of birth for the foreign-born population - Yemen (%)
Place of birth for the foreign-born population - Other Western Asia (%)
Place of birth for the foreign-born population - Eritrea (%)
Place of birth for the foreign-born population - Ethiopia (%)
Place of birth for the foreign-born population - Kenya (%)
Place of birth for the foreign-born population - Somalia (%)
Place of birth for the foreign-born population - Uganda (%)
Place of birth for the foreign-born population - Zimbabwe (%)
Place of birth for the foreign-born population - Other Eastern Africa (%)
Place of birth for the foreign-born population - Cameroon (%)
Place of birth for the foreign-born population - Congo (%)
Place of birth for the foreign-born population - Democratic Republic of Congo (Zaire) (%)
Place of birth for the foreign-born population - Other Middle Africa (%)
Place of birth for the foreign-born population - Egypt (%)
Place of birth for the foreign-born population - Morocco (%)
Place of birth for the foreign-born population - Sudan (%)
Place of birth for the foreign-born population - Other Northern Africa (%)
Place of birth for the foreign-born population - South Africa (%)
Place of birth for the foreign-born population - Other Southern Africa (%)
Place of birth for the foreign-born population - Cabo Verde (%)
Place of birth for the foreign-born population - Ghana (%)
Place of birth for the foreign-born population - Liberia (%)
Place of birth for the foreign-born population - Nigeria (%)
Place of birth for the foreign-born population - Senegal (%)
Place of birth for the foreign-born population - Sierra Leone (%)
Place of birth for the foreign-born population - Other Western Africa (%)
Place of birth for the foreign-born population - Australia (%)
Place of birth for the foreign-born population - New Zealand (%)
Place of birth for the foreign-born population - Fiji (%)
Place of birth for the foreign-born population - Micronesia (%)
Place of birth for the foreign-born population - Bahamas (%)
Place of birth for the foreign-born population - Barbados (%)
Place of birth for the foreign-born population - Cuba (%)
Place of birth for the foreign-born population - Dominica (%)
Place of birth for the foreign-born population - Dominican Republic (%)
Place of birth for the foreign-born population - Grenada (%)
Place of birth for the foreign-born population - Haiti (%)
Place of birth for the foreign-born population - Jamaica (%)
Place of birth for the foreign-born population - St. Vincent and the Grenadines (%)
Place of birth for the foreign-born population - Trinidad and Tobago (%)
Place of birth for the foreign-born population - West Indies (%)
Place of birth for the foreign-born population - Other Caribbean (%)
Place of birth for the foreign-born population - Belize (%)
Place of birth for the foreign-born population - Costa Rica (%)
Place of birth for the foreign-born population - El Salvador (%)
Place of birth for the foreign-born population - Guatemala (%)
Place of birth for the foreign-born population - Honduras (%)
Place of birth for the foreign-born population - Mexico (%)
Place of birth for the foreign-born population - Nicaragua (%)
Place of birth for the foreign-born population - Panama (%)
Place of birth for the foreign-born population - Other Central America (%)
Place of birth for the foreign-born population - Argentina (%)
Place of birth for the foreign-born population - Bolivia (%)
Place of birth for the foreign-born population - Brazil (%)
Place of birth for the foreign-born population - Chile (%)
Place of birth for the foreign-born population - Colombia (%)
Place of birth for the foreign-born population - Ecuador (%)
Place of birth for the foreign-born population - Guyana (%)
Place of birth for the foreign-born population - Peru (%)
Place of birth for the foreign-born population - Uruguay (%)
Place of birth for the foreign-born population - Venezuela (%)
Place of birth for the foreign-born population - Other South America (%)
Place of birth for the foreign-born population - Canada (%)
Place of birth for the foreign-born population - Other Northern America (%)
Place of birth for the foreign-born population - Other (%)
Latest news about races in Woodlawn, MD collected exclusively by city-data.com from local newspapers, TV, and radio stations
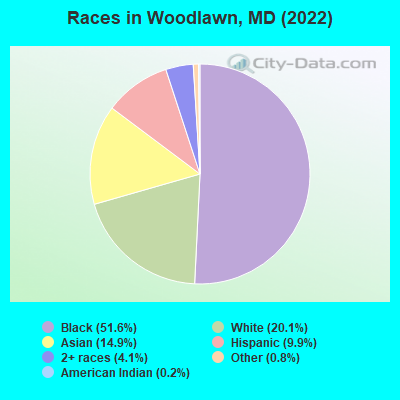
According to 2022 data, the most numerous races in Woodlawn, MD are White alone (8,452 residents), Black alone (21,657 residents), and Hispanic (4,172 residents). 78.1% of Woodlawn residents speak English at home. 18.9% of Woodlawn, MD residents are foreign-born (10.2% born in Asia, 4.5% born in Latin America, 2.3% born in Africa), which is 15.4% greater than the foreign-born rate of 16.0% across the entire state of Maryland.
Race distribution in Woodlawn
2000 2022
3,286,547 62.1% White alone 1,464,735 27.7% Black alone 227,916 4.3% Hispanic 209,738 4.0% Asian alone 82,946 1.6% Two or more races 13,312 0.3% American Indian alone 9,379 0.2% Other race alone 1,913 0.04% Native Hawaiian and Other
2,906,492 47.1% White alone 1,800,914 29.2% Black alone 705,842 11.4% Hispanic 401,818 6.5% Asian alone 291,317 4.7% Two or more races 46,930 0.8% Other race alone 8,930 0.1% American Indian alone 2,417 0.04% Native Hawaiian and Other
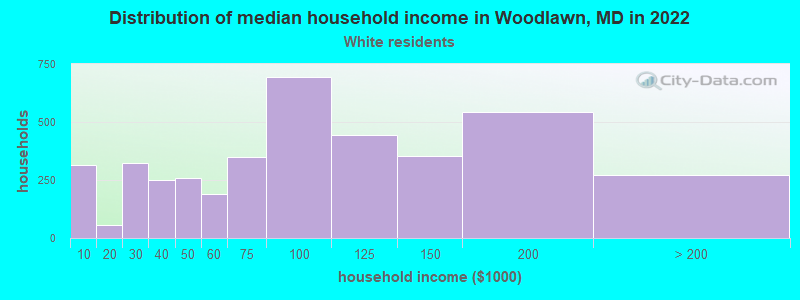
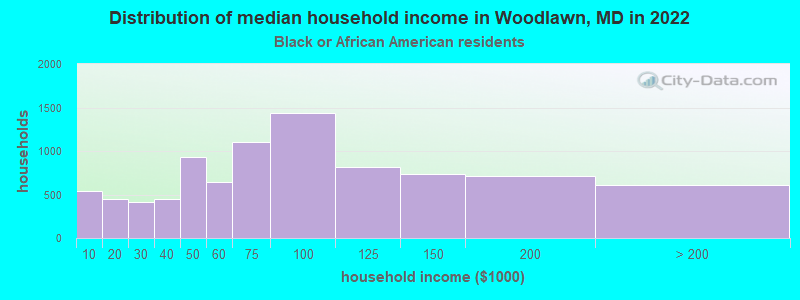
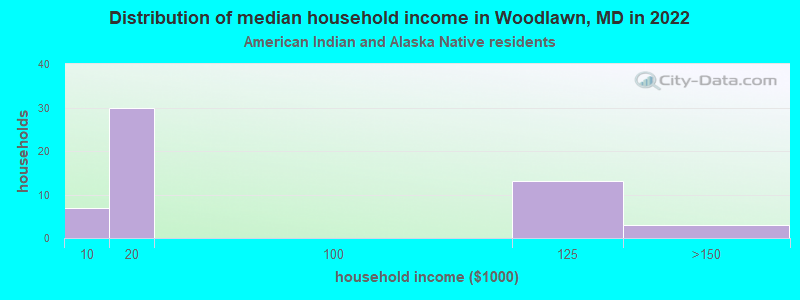
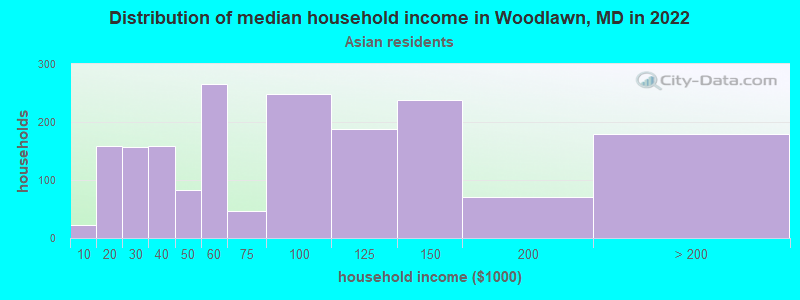
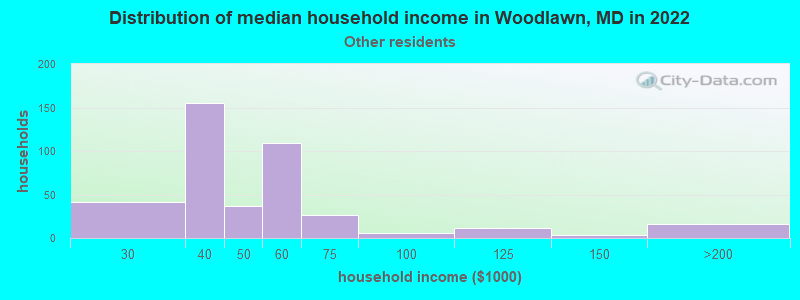
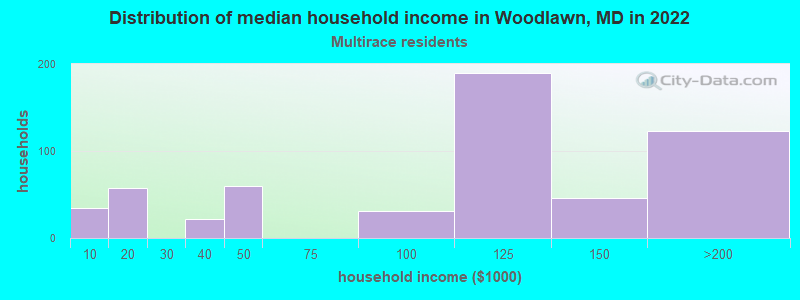
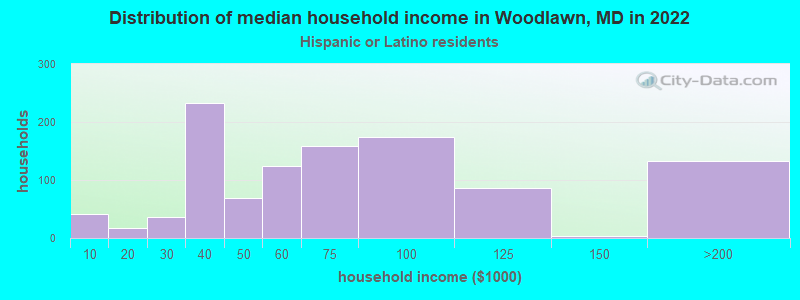
Income and house value in Woodlawn Median household income in 2022 $79,201 White non-Hispanic householders$71,871 Black householders$71,064 Asian householders$47,341 Some other race householders$125,319 Two or more races householders$56,777 Hispanic or Latino race householdersMedian 2022 house value $267,276 White Non-Hispanic householders$266,785 Black or African American householders$296,210 American Indian or Alaska Native householders $292,777 Asian householders$281,743 Some other race householders$301,605 Two or more races householders$282,479 Hispanic or Latino householders
Median age by race in Woodlawn
41.9 Median age for White residents40.1 42.3 39.3 Median age for Black or African American residents36.4 40.1 60.9 Median age for American Indian / Alaska Native residents94.6 36.1 34.0 Median age for Asian residents35.7 34.6 26.1 Median age for Native Hawaiian / Pacific Islander residents45.1 12.9 16.6 Median age for Other race residents15.0 19.1 22.7 Median age for Two or more races residents20.9 29.7 44.9 Median age for White alone residents44.7 47.2 16.8 Median age for Hispanic or Latino residents20.4 16.4
Owner/renter occupied households by race in Woodlawn
House owners and renters - White residents 2,970 74.3% Owner occupied1,028 25.7% Renter occupiedHouse owners and renters - Black or African American residents 6,330 67.9% Owner occupied2,992 32.1% Renter occupiedHouse owners and renters - American Indian / Alaska Native residents 38 48.3% Owner occupied40 51.7% Renter occupiedHouse owners and renters - Asian residents 852 45.4% Owner occupied1,025 54.6% Renter occupiedHouse owners and renters - Native Hawaiian / Pacific Islander residents 65 100.0% Owner occupiedHouse owners and renters - Other race residents 164 40.5% Owner occupied240 59.5% Renter occupiedHouse owners and renters - Two or more races residents 407 69.3% Owner occupied181 30.7% Renter occupiedHouse owners and renters - White alone residents 2,786 75.8% Owner occupied887 24.2% Renter occupiedHouse owners and renters - Hispanic or Latino residents 590 55.5% Owner occupied473 44.5% Renter occupied
Language usage in Woodlawn
English speakers - Total 78.1% of residents of Woodlawn speak English at home.
6.3% of residents speak Spanish at home 1,329 54.2% Speak English very well1,122 45.8% Speak English less than very well15.5% of residents speak other language at home 3,220 53.4% Speak English very well2,808 46.6% Speak English less than very well
English speakers - Born in the United States 91.9% of residents of Woodlawn speak English at home.
2.9% of residents speak Spanish at home 123 58.3% Speak English very well88 41.7% Speak English less than very well4.8% of residents speak other language at home 319 90.9% Speak English very well32 9.1% Speak English less than very well
English speakers - Native, born elsewhere 71.5% of residents of Woodlawn speak English at home.
24.3% of residents speak Spanish at home 191 100.0% Speak English very well5.1% of residents speak other language at home 40 100.0% Speak English very well
English speakers - Foreign-born 22.1% of residents of Woodlawn speak English at home.
16.6% of residents speak Spanish at home 274 21.2% Speak English very well1,017 78.8% Speak English less than very well62.1% of residents speak other language at home 2,278 47.2% Speak English very well2,550 52.8% Speak English less than very well
White (Caucasian) - Speak only English Native:
93.9% (7,689)Foreign-born:
25.3% (253)
White (Caucasian) - Speak another language Native:
5.2% (423)Foreign-born:
74.6% (745)
Black or African American - Speak only English Native:
98.3% (19,155)Foreign-born:
75.4% (1,065)
Black or African American - Speak another language Native:
1.9% (374)Foreign-born:
34.1% (481)
Asian - Speak only English Native:
48.0% (629)Foreign-born:
5.8% (235)
Asian - Speak another language Native:
52.0% (681)Foreign-born:
93.2% (3,769)
Native Hawaiian / Pacific Islander - Speak another language Native:
93.7% (254)Foreign-born:
100.0% (106)
Other race - Speak only English Native:
27.8% (232)Foreign-born:
6.7% (61)
Other race - Speak another language Native:
71.7% (599)Foreign-born:
94.4% (860)
Two or more races - Speak only English Native:
89.7% (1,294)Foreign-born:
39.6% (121)
Two or more races - Speak another language Native:
9.4% (136)Foreign-born:
59.5% (182)
White alone - Speak only English Native:
98.9% (7,411)Foreign-born:
43.4% (239)
White alone - Speak another language Native:
1.3% (94)Foreign-born:
55.7% (307)
Hispanic or Latino - Speak only English Native:
42.8% (880)Foreign-born:
5.1% (69)
Hispanic or Latino - Speak another language Native:
53.1% (1,092)Foreign-born:
94.9% (1,293)
Foreign-born residents in Woodlawn 7,948 residents are foreign born (10.2% Asia , 4.5% Latin America , 2.3% Africa ).
This city:
18.9%Maryland:
15.7%
Marital status for residents in Woodlawn Marital status - White (Caucasian) population 15 years and over
Males 42.0% Never married48.0% Now married0.6% Separated2.1% Widowed7.3% DivorcedFemales 23.3% Never married51.7% Now married1.5% Separated7.1% Widowed16.4% DivorcedWomen who gave birth in the past 12 months Now married:
100.0% (72)Unmarried:
0.0% (0)
Women who did not give birth in the past 12 months Now married:
58.6% (1,196)Unmarried:
41.4% (844)
Marital status - Black or African American population 15 years and over
Males 46.6% Never married43.2% Now married1.3% Separated3.7% Widowed5.2% DivorcedFemales 46.9% Never married29.0% Now married1.3% Separated7.3% Widowed15.4% DivorcedWomen who gave birth in the past 12 months Now married:
24.7% (66)Unmarried:
75.3% (201)
Women who did not give birth in the past 12 months Now married:
25.3% (1,241)Unmarried:
74.7% (3,657)
Marital status - American Indian / Alaska Native population 15 years and over
Males 45.7% Never married0.0% Now married0.0% Separated34.3% Widowed20.0% DivorcedFemales 16.7% Never married38.9% Now married0.0% Separated0.0% Widowed44.4% DivorcedWomen who gave birth in the past 12 months Now married:
0.0% (0)Unmarried:
100.0% (19)
Women who did not give birth in the past 12 months Now married:
0.0% (0)Unmarried:
100.0% (9)
Marital status - Asian population 15 years and over
Males 17.7% Never married70.2% Now married0.3% Separated4.3% Widowed7.6% DivorcedFemales 21.3% Never married65.7% Now married0.3% Separated4.7% Widowed8.0% DivorcedWomen who gave birth in the past 12 months Now married:
100.0% (113)Unmarried:
0.0% (0)
Women who did not give birth in the past 12 months Now married:
67.3% (926)Unmarried:
32.7% (450)
Marital status - Native Hawaiian / Pacific Islander population 15 years and over
Males 0.0% Never married100.0% Now married0.0% Separated0.0% Widowed0.0% DivorcedFemales 51.8% Never married48.2% Now married0.0% Separated0.0% Widowed0.0% DivorcedWomen who did not give birth in the past 12 months Now married:
48.2% (58)Unmarried:
51.8% (62)
Marital status - Other race population 15 years and over
Males 79.6% Never married15.0% Now married0.0% Separated0.0% Widowed5.4% DivorcedFemales 80.5% Never married13.5% Now married6.0% Separated0.0% Widowed0.0% DivorcedWomen who gave birth in the past 12 months Now married:
0.0% (0)Unmarried:
100.0% (1)
Women who did not give birth in the past 12 months Now married:
19.5% (125)Unmarried:
80.5% (513)
Marital status - Two or more races population 15 years and over
Males 63.6% Never married35.5% Now married0.0% Separated0.0% Widowed0.9% DivorcedFemales 44.3% Never married23.9% Now married8.5% Separated4.2% Widowed19.1% DivorcedWomen who gave birth in the past 12 months Now married:
0.0% (0)Unmarried:
100.0% (27)
Women who did not give birth in the past 12 months Now married:
15.3% (79)Unmarried:
84.7% (437)
Marital status - White alone, not Hispanic / Latino population 15 years and over
Males 41.8% Never married46.9% Now married0.7% Separated2.4% Widowed8.2% DivorcedFemales 21.2% Never married51.9% Now married1.6% Separated7.9% Widowed17.4% DivorcedWomen who gave birth in the past 12 months Now married:
100.0% (42)Unmarried:
0.0% (0)
Women who did not give birth in the past 12 months Now married:
60.2% (1,023)Unmarried:
39.8% (676)
Marital status - Hispanic or Latino population 15 years and over
Males 51.8% Never married46.4% Now married0.0% Separated0.0% Widowed1.8% DivorcedFemales 58.1% Never married32.3% Now married2.2% Separated0.0% Widowed7.4% DivorcedWomen who gave birth in the past 12 months Now married:
97.0% (34)Unmarried:
3.0% (1)
Women who did not give birth in the past 12 months Now married:
35.1% (392)Unmarried:
64.9% (726)
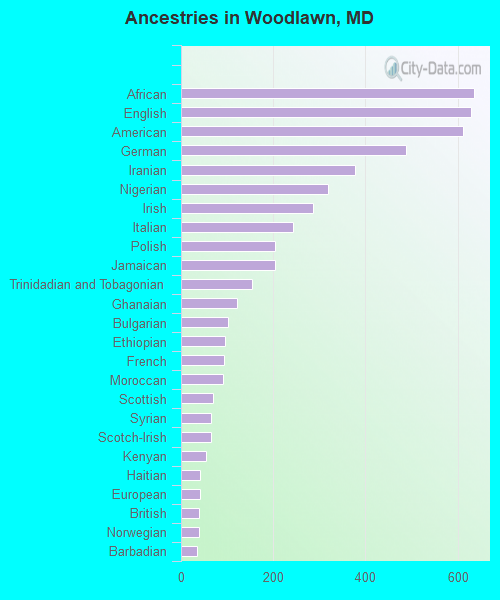
Ancestries in Woodlawn
636 2.4% African629 2.4% English612 2.3% American488 1.8% German377 1.4% Iranian318 1.2% Nigerian286 1.1% Irish243 0.9% Italian204 0.8% Polish204 0.8% Jamaican155 0.6% Trinidadian and Tobagonian122 0.5% Ghanaian101 0.4% Bulgarian95 0.4% Ethiopian94 0.4% French90 0.3% Moroccan70 0.3% Scottish64 0.2% Syrian64 0.2% Scotch-Irish55 0.2% Kenyan42 0.2% Haitian41 0.2% European40 0.1% British39 0.1% Norwegian35 0.1% Barbadian30 0.1% Liberian28 0.1% Slovak22 0.08% Russian21 0.08% Afghan19 0.07% West Indian16 0.06% Swiss16 0.06% French Canadian14 0.05% Eastern European10 0.04% Welsh10 0.04% Dutch5 0.02% Guyanese2 0.01% Hungarian
Geographical mobility in Woodlawn Same house 1 year ago 8,280 84.4% White (Caucasian)19,591 89.0% Black or African American83 70.8% American Indian / Alaska Native5,571 91.7% Asian481 100.0% Native Hawaiian / Pacific Islander1,235 70.7% Other race1,396 72.3% Two or more races7,789 92.8% White alone, not Hispanic / Latino2,793 69.3% Hispanic or LatinoMoved within same county 937 9.5% White / Caucasian1,065 4.8% Black or African American199 3.3% Asian18 0.9% Two or more races168 2.0% White alone, not Hispanic / Latino729 18.1% Hispanic or LatinoMoved within same state 290 3.0% White / Caucasian1,260 5.7% Black or African American26 21.9% American Indian / Alaska Native119 2.0% Asian558 31.9% Other race565 29.3% Two or more races290 3.4% White alone, not Hispanic / Latino297 7.4% Hispanic or LatinoMoved from different state 175 1.8% White / Caucasian42 0.2% Black or African American46 0.8% Asian10 0.6% Other race176 2.1% White alone, not Hispanic / Latino20 0.5% Hispanic or LatinoMoved from abroad 27 0.3% White81 0.4% Black or African American17 14.9% American Indian / Alaska Native172 2.8% Asian33 0.8% Hispanic or Latino
Children Nativity (place of birth) in Woodlawn
Children under 6 years - Living with two parents Both parents native 877 98.6% Native12 1.4% Foreign-bornBoth parents foreign-born 1,265 95.6% Native58 4.4% Foreign-bornOne native, one foreign-born parent 115 100.0% NativeChildren under 6 years - Living with one parent Native parent 1,154 100.0% NativeForeign-born parent 56 41.3% Native80 58.7% Foreign-bornChildren 6 to 17 years - Living with two parents Both parents native 1,061 98.9% Native12 1.1% Foreign-bornBoth parents foreign-born 1,087 76.5% Native334 23.5% Foreign-bornOne native, one foreign-born parent 666 93.4% Native47 6.6% Foreign-bornChildren 6 to 17 years - Living with one parent Native parent 2,305 100.0% NativeForeign-born parent 693 52.9% Native616 47.1% Foreign-born
Grandparents responsible for own grandchildren in Woodlawn
Grandparents (30 to 59 years) White / Caucasian 5 100.0% Not responsible for grandchildrenBlack or African American 32 23.7% Responsible for grandchildren103 76.3% Not responsible for grandchildrenAsian 20 19.7% Responsible for grandchildren81 80.3% Not responsible for grandchildrenNative Hawaiian / Pacific Islander 8 100.0% Responsible for grandchildrenWhite alone, not Hispanic / Latino 4 100.0% Not responsible for grandchildrenGrandparents (60 years and over) White / Caucasian 48 33.4% Responsible for grandchildren95 66.6% Not responsible for grandchildrenBlack or African American 8 2.4% Responsible for grandchildren344 97.6% Not responsible for grandchildrenAsian 357 100.0% Not responsible for grandchildrenWhite alone, not Hispanic / Latino 36 26.5% Responsible for grandchildren100 73.5% Not responsible for grandchildren