Races in Woodfin, North Carolina (NC) Detailed Stats
Ancestries, Foreign-born residents, place of birth
Settings
X


Recent posts about races in Woodfin, North Carolina on our local forum with over 2,400,000 registered users:
 | I am out of this housing market!!! (190 replies) |
| Vibrant neighborhoods in or around Asheville (38 replies) |
| Area perspectives, building questions and the dream becoming reality. (334 replies) |
| Finally Making the Move to Buncombe County (10 replies) |
| North Carolina Mountains Lifestyle (31 replies) |
| Our plans are finally in motion (17 replies) |
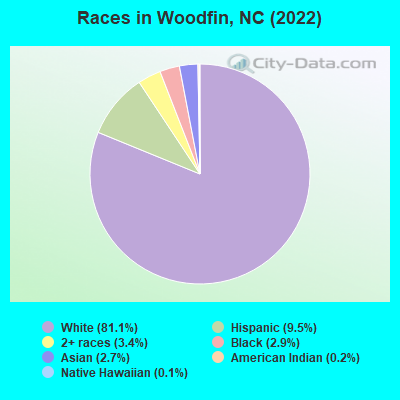
According to 2022 data, the most numerous races in Woodfin, NC are White alone (6,505 residents), Black alone (235 residents), and Hispanic (759 residents). 90.4% of Woodfin residents speak English at home. 9.2% of Woodfin, NC residents are foreign-born (4.4% born in Latin America, 2.1% born in Europe, 1.7% born in Asia), which is 13.2% greater than the foreign-born rate of 8.0% across the entire state of North Carolina.
Race distribution in Woodfin
2000
2022

- 2,82489.3%White alone
- 2126.7%Hispanic
- 622.0%Black alone
- 401.3%Two or more races
- 130.4%Asian alone
- 70.2%American Indian alone
- 40.1%Other race alone

-
- 6,50581.1%White alone
- 7599.5%Hispanic
- 2723.4%Two or more races
- 2352.9%Black alone
- 2182.7%Asian alone
- 140.2%American Indian alone
- 90.1%Native Hawaiian and Other
Pacific Islander alone
2000
2022
-
- 5,647,15570.2%White alone
- 1,723,30121.4%Black alone
- 378,9634.7%Hispanic
- 112,4161.4%Asian alone
- 95,3331.2%American Indian alone
- 79,9651.0%Two or more races
- 9,0150.1%Other race alone
- 3,1650.04%Native Hawaiian and Other
Pacific Islander alone

-
- 6,497,51960.7%White alone
- 2,155,65020.1%Black alone
- 1,114,79910.4%Hispanic
- 438,0614.1%Two or more races
- 341,0523.2%Asian alone
- 91,7580.9%American Indian alone
- 50,1800.5%Other race alone
- 9,9540.09%Native Hawaiian and Other
Pacific Islander alone

Income and house value in Woodfin
- Median household income in 2022
- $58,003White non-Hispanic householders
- $69,245Two or more races householders
- $146,544Hispanic or Latino race householders
- Median 2022 house value
- $423,001White Non-Hispanic householders
- $367,090Some other race householders
- $367,090Hispanic or Latino householders
Household income for White non-Hispanic householders

Household income for Black householders

Household income for Some other race householders

Household income for Two or more races householders

Household income for Hispanic or Latino race householders

Median age by race in Woodfin
- 44.3Median age for White residents
- 43.8Males
- 45.3Females
- 37.1Median age for Black or African American residents
- 50.0Males
- -486,254,295.0Females
- 49.3Median age for American Indian / Alaska Native residents
- -668,604,650.5Males
- -682,971,013.8Females
- 21.0Median age for Asian residents
- 26.0Males
- 20.0Females
- -609,884,331.7Median age for Native Hawaiian / Pacific Islander residents
- -611,708,482.1Males
- -612,403,100.2Females
- 32.1Median age for Other race residents
- -719,358,533.1Males
- -494,331,065.3Females
- 31.5Median age for Two or more races residents
- 40.9Males
- 23.9Females
- 44.3Median age for White alone residents
- 43.7Males
- 47.1Females
- 26.2Median age for Hispanic or Latino residents
- 36.2Males
- 18.3Females
Owner/renter occupied households by race in Woodfin
- House owners and renters - White residents
- 1,44254.6%Owner occupied
- 1,19745.4%Renter occupied
- House owners and renters - Black or African American residents
- 1522.5%Owner occupied
- 5177.5%Renter occupied
- House owners and renters - Asian residents
- 45100.0%Renter occupied
- House owners and renters - Other race residents
- 5074.2%Owner occupied
- 1725.8%Renter occupied
- House owners and renters - Two or more races residents
- 16382.5%Owner occupied
- 3417.5%Renter occupied
- House owners and renters - White alone residents
- 1,42054.8%Owner occupied
- 1,17345.2%Renter occupied
- House owners and renters - Hispanic or Latino residents
- 7257.7%Owner occupied
- 5342.3%Renter occupied
Language usage in Woodfin
- English speakers - Total
- 90.4% of residents of Woodfin speak English at home.
- 5.7% of residents speak Spanish at home
- 21849.1%Speak English very well
- 22650.9%Speak English less than very well
- 3.6% of residents speak other language at home
- 16157.7%Speak English very well
- 11842.3%Speak English less than very well
- English speakers - Born in the United States
- 95.8% of residents of Woodfin speak English at home.
- 1.0% of residents speak Spanish at home
- 35100.0%Speak English very well
- 0.7% of residents speak other language at home
- 26100.0%Speak English very well
All residents speak only English at home
- English speakers - Foreign-born
- 33.2% of residents of Woodfin speak English at home.
- 31.9% of residents speak Spanish at home
- 10142.4%Speak English very well
- 13757.6%Speak English less than very well
- 29.6% of residents speak other language at home
- 10246.2%Speak English very well
- 11953.8%Speak English less than very well
White (Caucasian) - Speak only English
| Native: | 97.8% (6,222) |
| Foreign-born: | 48.7% (154) |
White (Caucasian) - Speak another language
| Native: | 2.1% (132) |
| Foreign-born: | 41.3% (131) |
Asian - Speak only English
| Native: | 100.0% (31) |
| Foreign-born: | 22.6% (23) |
Two or more races - Speak only English
| Native: | 81.5% (188) |
| Foreign-born: | 5.7% (12) |
White alone - Speak only English
| Native: | 98.0% (6,021) |
| Foreign-born: | 61.8% (164) |
White alone - Speak another language
| Native: | 1.6% (101) |
| Foreign-born: | 37.2% (99) |
Hispanic or Latino - Speak only English
| Native: | 58.9% (251) |
| Foreign-born: | 8.6% (24) |
Hispanic or Latino - Speak another language
| Native: | 21.2% (90) |
| Foreign-born: | 87.6% (241) |
Foreign-born residents in Woodfin
739 residents are foreign born (4.4% Latin America, 2.1% Europe, 1.7% Asia).
| This city: | 9.2% |
| North Carolina: | 8.3% |


Marital status for residents in Woodfin
Marital status - White (Caucasian) population 15 years and over
- Males
- 41.6%Never married
- 35.9%Now married
- 1.6%Separated
- 7.0%Widowed
- 14.0%Divorced
- Females
- 31.1%Never married
- 40.6%Now married
- 3.1%Separated
- 12.5%Widowed
- 12.7%Divorced
Women who gave birth in the past 12 months
| Now married: | 100.0% (35) |
| Unmarried: | 0.0% (0) |
Women who did not give birth in the past 12 months
| Now married: | 38.4% (569) |
| Unmarried: | 61.6% (914) |
Marital status - Black or African American population 15 years and over
- Males
- 66.5%Never married
- 0.0%Now married
- 1.0%Separated
- 22.3%Widowed
- 10.2%Divorced
- Females
- 0.0%Never married
- 38.2%Now married
- 0.0%Separated
- 61.8%Widowed
- 0.0%Divorced
Women who did not give birth in the past 12 months
| Now married: | 38.2% (21) |
| Unmarried: | 61.8% (34) |
Marital status - American Indian / Alaska Native population 15 years and over
- Males
- 0.0%Never married
- 100.0%Now married
- 0.0%Separated
- 0.0%Widowed
- 0.0%Divorced
- Females
- 0.0%Never married
- 100.0%Now married
- 0.0%Separated
- 0.0%Widowed
- 0.0%Divorced
Women who did not give birth in the past 12 months
| Now married: | 100.0% (6) |
| Unmarried: | 0.0% (0) |
Marital status - Asian population 15 years and over
- Males
- 0.0%Never married
- 100.0%Now married
- 0.0%Separated
- 0.0%Widowed
- 0.0%Divorced
- Females
- 0.0%Never married
- 84.4%Now married
- 0.0%Separated
- 0.0%Widowed
- 15.6%Divorced
Women who did not give birth in the past 12 months
| Now married: | 100.0% (57) |
| Unmarried: | 0.0% (0) |
Marital status - Other race population 15 years and over
- Males
- 41.5%Never married
- 58.5%Now married
- 0.0%Separated
- 0.0%Widowed
- 0.0%Divorced
- Females
- 0.0%Never married
- 71.4%Now married
- 0.0%Separated
- 0.0%Widowed
- 28.6%Divorced
Women who did not give birth in the past 12 months
| Now married: | 71.4% (27) |
| Unmarried: | 28.6% (11) |
Marital status - Two or more races population 15 years and over
- Males
- 29.2%Never married
- 46.5%Now married
- 0.9%Separated
- 0.0%Widowed
- 23.5%Divorced
- Females
- 15.7%Never married
- 84.3%Now married
- 0.0%Separated
- 0.0%Widowed
- 0.0%Divorced
Women who gave birth in the past 12 months
| Now married: | 100.0% (22) |
| Unmarried: | 0.0% (0) |
Women who did not give birth in the past 12 months
| Now married: | 57.6% (26) |
| Unmarried: | 42.4% (19) |
Marital status - White alone, not Hispanic / Latino population 15 years and over
- Males
- 40.2%Never married
- 37.1%Now married
- 1.7%Separated
- 6.6%Widowed
- 14.4%Divorced
- Females
- 32.0%Never married
- 39.8%Now married
- 2.3%Separated
- 12.8%Widowed
- 13.1%Divorced
Women who gave birth in the past 12 months
| Now married: | 100.0% (36) |
| Unmarried: | 0.0% (0) |
Women who did not give birth in the past 12 months
| Now married: | 36.2% (531) |
| Unmarried: | 63.8% (938) |
Marital status - Hispanic or Latino population 15 years and over
- Males
- 45.9%Never married
- 25.9%Now married
- 0.0%Separated
- 8.5%Widowed
- 19.7%Divorced
- Females
- 0.0%Never married
- 80.2%Now married
- 15.1%Separated
- 0.0%Widowed
- 4.7%Divorced
Women who gave birth in the past 12 months
| Now married: | 100.0% (16) |
| Unmarried: | 0.0% (0) |
Women who did not give birth in the past 12 months
| Now married: | 90.8% (79) |
| Unmarried: | 9.2% (8) |
Ancestries in Woodfin

- 1,44134.1%English
- 44910.6%American
- 3277.7%German
- 2826.7%Irish
- 1633.9%Italian
- 1283.0%French
- 1072.5%Scotch-Irish
- 1022.4%European
- 631.5%Iranian
- 521.2%Scottish
- 431.0%Russian
- 431.0%Welsh
- 380.9%Polish
- 310.7%British
- 140.3%Norwegian
- 120.3%Czech
- 100.2%Eastern European
- 80.2%Northern European
- 60.1%Canadian
- 60.1%French Canadian
- 20.05%Arab

Geographical mobility in Woodfin

- Same house 1 year ago
- 5,43480.7%White (Caucasian)
- 17676.2%Black or African American
- 22390.9%Asian
- 6371.3%Other race
- 546100.0%Two or more races
- 5,26681.2%White alone, not Hispanic / Latino
- 59684.2%Hispanic or Latino

-
- Moved within same county
- 4727.0%White / Caucasian
- 208.5%Black or African American
- 419.3%American Indian / Alaska Native
- 2225.2%Other race
- 122.2%Two or more races
- 4416.8%White alone, not Hispanic / Latino
- 8612.1%Hispanic or Latino

-
- Moved within same state
- 3985.9%White / Caucasian
- 6327.3%Black or African American
- 1150.5%American Indian / Alaska Native
- 19100.0%Native Hawaiian / Pacific Islander
- 101.8%Two or more races
- 3675.7%White alone, not Hispanic / Latino
- 314.4%Hispanic or Latino

-
- Moved from different state
- 3805.6%White / Caucasian
- 3585.5%White alone, not Hispanic / Latino
- 182.6%Hispanic or Latino

-
- Moved from abroad
- 210.3%White
- 3213.2%Asian
- 220.3%White alone, not Hispanic / Latino

Children Nativity (place of birth) in Woodfin
Place of birth for residents in Woodfin
![Place of birth for the foreign-born population - Regions]()
- 378Americas
- 367Latin America
- 282Central America
- 176Europe
- 145Asia
- 89Eastern Europe
- 73South Eastern Asia
- 69South Central Asia
- 60Northern Europe
- 54Caribbean
- 30South America
- 26Western Europe
- 23Africa
- 23Eastern Africa
- 15Oceania
- 15Australia and New Zealand Subregion
- 10Northern America
- 2Western Asia

![Place of birth for the foreign-born population - Countries]()
- 194Mexico
- 89Russia
- 73Thailand
- 66Guatemala
- 43Iran
- 42Dominican Republic
- 41Ireland
- 30Uruguay
- 26Germany
- 26India
- 23Zimbabwe
- 21El Salvador
- 15New Zealand
- 12Haiti
- 11United Kingdom
- 10Canada
- 7Norway
- 2United Arab Emirates

Zip codes: 28701.