Races in Woodburn, Virginia (VA) Detailed Stats
Data:
Races - White alone (%)
Races - White alone (% change since 2000)
Races - Black alone (%)
Races - Black alone (% change since 2000)
Races - American Indian alone (%)
Races - American Indian alone (% change since 2000)
Races - Asian alone (%)
Races - Asian alone (% change since 2000)
Races - Hispanic (%)
Races - Hispanic (% change since 2000)
Races - Native Hawaiian and Other Pacific Islander alone (%)
Races - Native Hawaiian and Other Pacific Islander alone (% change since 2000)
Races - Two or more races(%)
Races - Two or more races(% change since 2000)
Races - Other race alone (%)
Races - Other race alone (% change since 2000)
Racial diversity
Place of birth - Born in state of residence (%)
Place of birth - Born in state of residence (%) - White
Place of birth - Born in state of residence (%) - Black or African American
Place of birth - Born in state of residence (%) - Asian
Place of birth - Born in state of residence (%) - Hispanic or Latino
Place of birth - Born in state of residence (%) - American Indian and Alaska Native
Place of birth - Born in state of residence (%) - Multirace
Place of birth - Born in state of residence (%) - Other Race
Place of birth - Born in other state (%)
Place of birth - Born in other state (%) - White
Place of birth - Born in other state (%) - Black or African American
Place of birth - Born in other state (%) - Asian
Place of birth - Born in other state (%) - Hispanic or Latino
Place of birth - Born in other state (%) - American Indian and Alaska Native
Place of birth - Born in other state (%) - Multirace
Place of birth - Born in other state (%) - Other Race
Place of birth - Native, outside of US (%)
Place of birth - Native, outside of US (%) - White
Place of birth - Native, outside of US (%) - Black or African American
Place of birth - Native, outside of US (%) - Asian
Place of birth - Native, outside of US (%) - Hispanic or Latino
Place of birth - Native, outside of US (%) - American Indian and Alaska Native
Place of birth - Native, outside of US (%) - Multirace
Place of birth - Native, outside of US (%) - Other Race
Place of birth - Foreign born (%)
Place of birth - Foreign born (%) - White
Place of birth - Foreign born (%) - Black or African American
Place of birth - Foreign born (%) - Asian
Place of birth - Foreign born (%) - Hispanic or Latino
Place of birth - Foreign born (%) - American Indian and Alaska Native
Place of birth - Foreign born (%) - Multirace
Place of birth - Foreign born (%) - Other Race
Residents speaking English at home (%)
Residents speaking English at home - Born in the United States (%)
Residents speaking English at home - Native, born elsewhere (%)
Residents speaking English at home - Foreign born (%)
Residents speaking Spanish at home (%)
Residents speaking Spanish at home - Born in the United States (%)
Residents speaking Spanish at home - Native, born elsewhere (%)
Residents speaking Spanish at home - Foreign born (%)
Residents speaking other language at home (%)
Residents speaking other language at home - Born in the United States (%)
Residents speaking other language at home - Native, born elsewhere (%)
Residents speaking other language at home - Foreign born (%)
Marital status - Never married (%)
Marital status - Now married (%)
Marital status - Separated (%)
Marital status - Widowed (%)
Marital status - Divorced (%)
Ancestries Reported - Arab (%)
Ancestries Reported - Czech (%)
Ancestries Reported - Danish (%)
Ancestries Reported - Dutch (%)
Ancestries Reported - English (%)
Ancestries Reported - French (%)
Ancestries Reported - French Canadian (%)
Ancestries Reported - German (%)
Ancestries Reported - Greek (%)
Ancestries Reported - Hungarian (%)
Ancestries Reported - Irish (%)
Ancestries Reported - Italian (%)
Ancestries Reported - Lithuanian (%)
Ancestries Reported - Norwegian (%)
Ancestries Reported - Polish (%)
Ancestries Reported - Portuguese (%)
Ancestries Reported - Russian (%)
Ancestries Reported - Scotch-Irish (%)
Ancestries Reported - Scottish (%)
Ancestries Reported - Slovak (%)
Ancestries Reported - Subsaharan African (%)
Ancestries Reported - Swedish (%)
Ancestries Reported - Swiss (%)
Ancestries Reported - Ukrainian (%)
Ancestries Reported - United States (%)
Ancestries Reported - Welsh (%)
Ancestries Reported - West Indian (%)
Ancestries Reported - Other (%)
Geographical mobility - Same house 1 year ago (%)
Geographical mobility - Same house 1 year ago (%) - White
Geographical mobility - Same house 1 year ago (%) - Black or African American
Geographical mobility - Same house 1 year ago (%) - Asian
Geographical mobility - Same house 1 year ago (%) - Hispanic or Latino
Geographical mobility - Same house 1 year ago (%) - American Indian and Alaska Native
Geographical mobility - Same house 1 year ago (%) - Multirace
Geographical mobility - Same house 1 year ago (%) - Other Race
Geographical mobility - Moved within same county (%)
Geographical mobility - Moved within same county (%) - White
Geographical mobility - Moved within same county (%) - Black or African American
Geographical mobility - Moved within same county (%) - Asian
Geographical mobility - Moved within same county (%) - Hispanic or Latino
Geographical mobility - Moved within same county (%) - American Indian and Alaska Native
Geographical mobility - Moved within same county (%) - Multirace
Geographical mobility - Moved within same county (%) - Other Race
Geographical mobility - Moved from different county within same state (%)
Geographical mobility - Moved from different county within same state (%) - White
Geographical mobility - Moved from different county within same state (%) - Black or African American
Geographical mobility - Moved from different county within same state (%) - Asian
Geographical mobility - Moved from different county within same state (%) - Hispanic or Latino
Geographical mobility - Moved from different county within same state (%) - American Indian and Alaska Native
Geographical mobility - Moved from different county within same state (%) - Multirace
Geographical mobility - Moved from different county within same state (%) - Other Race
Geographical mobility - Moved from different state (%)
Geographical mobility - Moved from different state (%) - White
Geographical mobility - Moved from different state (%) - Black or African American
Geographical mobility - Moved from different state (%) - Asian
Geographical mobility - Moved from different state (%) - Hispanic or Latino
Geographical mobility - Moved from different state (%) - American Indian and Alaska Native
Geographical mobility - Moved from different state (%) - Multirace
Geographical mobility - Moved from different state (%) - Other Race
Geographical mobility - Moved from abroad (%)
Geographical mobility - Moved from abroad (%) - White
Geographical mobility - Moved from abroad (%) - Black or African American
Geographical mobility - Moved from abroad (%) - Asian
Geographical mobility - Moved from abroad (%) - Hispanic or Latino
Geographical mobility - Moved from abroad (%) - American Indian and Alaska Native
Geographical mobility - Moved from abroad (%) - Multirace
Geographical mobility - Moved from abroad (%) - Other Race
Place of birth for the foreign-born population - Ireland (%)
Place of birth for the foreign-born population - Denmark (%)
Place of birth for the foreign-born population - Norway (%)
Place of birth for the foreign-born population - Sweden (%)
Place of birth for the foreign-born population - United Kingdom (%)
Place of birth for the foreign-born population - England (%)
Place of birth for the foreign-born population - Scotland (%)
Place of birth for the foreign-born population - Other Northern Europe (%)
Place of birth for the foreign-born population - Austria (%)
Place of birth for the foreign-born population - Belgium (%)
Place of birth for the foreign-born population - France (%)
Place of birth for the foreign-born population - Germany (%)
Place of birth for the foreign-born population - Netherlands (%)
Place of birth for the foreign-born population - Switzerland (%)
Place of birth for the foreign-born population - Other Western Europe (%)
Place of birth for the foreign-born population - Greece (%)
Place of birth for the foreign-born population - Italy (%)
Place of birth for the foreign-born population - Portugal (%)
Place of birth for the foreign-born population - Spain (%)
Place of birth for the foreign-born population - Other Southern Europe (%)
Place of birth for the foreign-born population - Albania (%)
Place of birth for the foreign-born population - Belarus (%)
Place of birth for the foreign-born population - Bosnia and Herzegovina (%)
Place of birth for the foreign-born population - Bulgaria (%)
Place of birth for the foreign-born population - Croatia (%)
Place of birth for the foreign-born population - Czechoslovakia (%)
Place of birth for the foreign-born population - Hungary (%)
Place of birth for the foreign-born population - Latvia (%)
Place of birth for the foreign-born population - Lithuania (%)
Place of birth for the foreign-born population - North Macedonia (Macedonia) (%)
Place of birth for the foreign-born population - Moldova (%)
Place of birth for the foreign-born population - Poland (%)
Place of birth for the foreign-born population - Romania (%)
Place of birth for the foreign-born population - Russia (%)
Place of birth for the foreign-born population - Serbia (%)
Place of birth for the foreign-born population - Ukraine (%)
Place of birth for the foreign-born population - Other Eastern Europe (%)
Place of birth for the foreign-born population - China (%)
Place of birth for the foreign-born population - Hong Kong (%)
Place of birth for the foreign-born population - Taiwan (%)
Place of birth for the foreign-born population - Japan (%)
Place of birth for the foreign-born population - Korea (%)
Place of birth for the foreign-born population - Other Eastern Asia (%)
Place of birth for the foreign-born population - Afghanistan (%)
Place of birth for the foreign-born population - Bangladesh (%)
Place of birth for the foreign-born population - India (%)
Place of birth for the foreign-born population - Iran (%)
Place of birth for the foreign-born population - Kazakhstan (%)
Place of birth for the foreign-born population - Nepal (%)
Place of birth for the foreign-born population - Pakistan (%)
Place of birth for the foreign-born population - Sri Lanka (%)
Place of birth for the foreign-born population - Uzbekistan (%)
Place of birth for the foreign-born population - Other South Central Asia (%)
Place of birth for the foreign-born population - Burma (%)
Place of birth for the foreign-born population - Cambodia (%)
Place of birth for the foreign-born population - Indonesia (%)
Place of birth for the foreign-born population - Laos (%)
Place of birth for the foreign-born population - Malaysia (%)
Place of birth for the foreign-born population - Philippines (%)
Place of birth for the foreign-born population - Singapore (%)
Place of birth for the foreign-born population - Thailand (%)
Place of birth for the foreign-born population - Vietnam (%)
Place of birth for the foreign-born population - Other South Eastern Asia (%)
Place of birth for the foreign-born population - Armenia (%)
Place of birth for the foreign-born population - Iraq (%)
Place of birth for the foreign-born population - Israel (%)
Place of birth for the foreign-born population - Jordan (%)
Place of birth for the foreign-born population - Kuwait (%)
Place of birth for the foreign-born population - Lebanon (%)
Place of birth for the foreign-born population - Saudi Arabia (%)
Place of birth for the foreign-born population - Syria (%)
Place of birth for the foreign-born population - Turkey (%)
Place of birth for the foreign-born population - Yemen (%)
Place of birth for the foreign-born population - Other Western Asia (%)
Place of birth for the foreign-born population - Eritrea (%)
Place of birth for the foreign-born population - Ethiopia (%)
Place of birth for the foreign-born population - Kenya (%)
Place of birth for the foreign-born population - Somalia (%)
Place of birth for the foreign-born population - Uganda (%)
Place of birth for the foreign-born population - Zimbabwe (%)
Place of birth for the foreign-born population - Other Eastern Africa (%)
Place of birth for the foreign-born population - Cameroon (%)
Place of birth for the foreign-born population - Congo (%)
Place of birth for the foreign-born population - Democratic Republic of Congo (Zaire) (%)
Place of birth for the foreign-born population - Other Middle Africa (%)
Place of birth for the foreign-born population - Egypt (%)
Place of birth for the foreign-born population - Morocco (%)
Place of birth for the foreign-born population - Sudan (%)
Place of birth for the foreign-born population - Other Northern Africa (%)
Place of birth for the foreign-born population - South Africa (%)
Place of birth for the foreign-born population - Other Southern Africa (%)
Place of birth for the foreign-born population - Cabo Verde (%)
Place of birth for the foreign-born population - Ghana (%)
Place of birth for the foreign-born population - Liberia (%)
Place of birth for the foreign-born population - Nigeria (%)
Place of birth for the foreign-born population - Senegal (%)
Place of birth for the foreign-born population - Sierra Leone (%)
Place of birth for the foreign-born population - Other Western Africa (%)
Place of birth for the foreign-born population - Australia (%)
Place of birth for the foreign-born population - New Zealand (%)
Place of birth for the foreign-born population - Fiji (%)
Place of birth for the foreign-born population - Micronesia (%)
Place of birth for the foreign-born population - Bahamas (%)
Place of birth for the foreign-born population - Barbados (%)
Place of birth for the foreign-born population - Cuba (%)
Place of birth for the foreign-born population - Dominica (%)
Place of birth for the foreign-born population - Dominican Republic (%)
Place of birth for the foreign-born population - Grenada (%)
Place of birth for the foreign-born population - Haiti (%)
Place of birth for the foreign-born population - Jamaica (%)
Place of birth for the foreign-born population - St. Vincent and the Grenadines (%)
Place of birth for the foreign-born population - Trinidad and Tobago (%)
Place of birth for the foreign-born population - West Indies (%)
Place of birth for the foreign-born population - Other Caribbean (%)
Place of birth for the foreign-born population - Belize (%)
Place of birth for the foreign-born population - Costa Rica (%)
Place of birth for the foreign-born population - El Salvador (%)
Place of birth for the foreign-born population - Guatemala (%)
Place of birth for the foreign-born population - Honduras (%)
Place of birth for the foreign-born population - Mexico (%)
Place of birth for the foreign-born population - Nicaragua (%)
Place of birth for the foreign-born population - Panama (%)
Place of birth for the foreign-born population - Other Central America (%)
Place of birth for the foreign-born population - Argentina (%)
Place of birth for the foreign-born population - Bolivia (%)
Place of birth for the foreign-born population - Brazil (%)
Place of birth for the foreign-born population - Chile (%)
Place of birth for the foreign-born population - Colombia (%)
Place of birth for the foreign-born population - Ecuador (%)
Place of birth for the foreign-born population - Guyana (%)
Place of birth for the foreign-born population - Peru (%)
Place of birth for the foreign-born population - Uruguay (%)
Place of birth for the foreign-born population - Venezuela (%)
Place of birth for the foreign-born population - Other South America (%)
Place of birth for the foreign-born population - Canada (%)
Place of birth for the foreign-born population - Other Northern America (%)
Place of birth for the foreign-born population - Other (%)
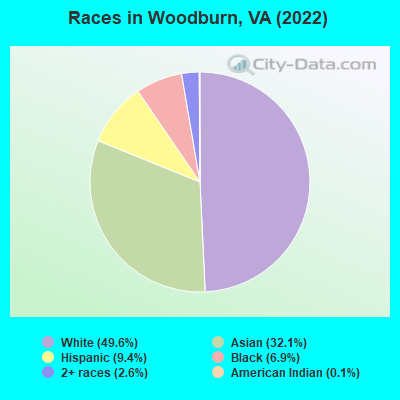
According to 2022 data, the most numerous races in Woodburn, VA are White alone (5,077 residents), Black alone (707 residents), and Hispanic (957 residents). 51.3% of Woodburn residents speak English at home.
Race distribution in Woodburn 5,077 49.6% White alone 3,279 32.1% Asian alone 957 9.4% Hispanic 707 6.9% Black alone 266 2.6% Two or more races 12 0.1% American Indian alone
2000 2022
4,965,637 70.2% White alone 1,376,378 19.4% Black alone 329,540 4.7% Hispanic 259,277 3.7% Asian alone 114,022 1.6% Two or more races 18,596 0.3% American Indian alone 11,685 0.2% Other race alone 3,380 0.05% Native Hawaiian and Other
5,095,130 58.7% White alone 1,594,785 18.4% Black alone 905,750 10.4% Hispanic 602,881 6.9% Asian alone 406,047 4.7% Two or more races 60,419 0.7% Other race alone 11,738 0.1% American Indian alone 6,869 0.08% Native Hawaiian and Other
Income and house value in Woodburn Median household income in 2022 $149,269 White non-Hispanic householders$80,929 Black householders$89,321 Asian householders$71,412 Some other race householdersover $200,000 Two or more races householders$150,845 Hispanic or Latino race householders
Median age by race in Woodburn
38.3 Median age for White residents35.1 41.1 32.6 Median age for Black or African American residents25.2 36.2 -792,063,491.3 Median age for American Indian / Alaska Native residents-862,921,347.5 -673,154,906.1 27.9 Median age for Asian residents26.0 29.5 -1,157,453,935.2 Median age for Native Hawaiian / Pacific Islander residents-541,531,822.5 -714,150,046.8 31.3 Median age for Other race residents43.4 27.0 33.9 Median age for Two or more races residents37.0 32.9 38.0 Median age for White alone residents35.1 40.7 37.4 Median age for Hispanic or Latino residents43.1 36.3
Owner/renter occupied households by race in Woodburn
House owners and renters - White residents 1,339 71.2% Owner occupied540 28.8% Renter occupiedHouse owners and renters - Black or African American residents 43 18.9% Owner occupied186 81.1% Renter occupiedHouse owners and renters - American Indian / Alaska Native residents 19 100.0% Owner occupiedHouse owners and renters - Asian residents 298 35.6% Owner occupied539 64.4% Renter occupiedHouse owners and renters - Other race residents 51 60.0% Owner occupied34 40.0% Renter occupiedHouse owners and renters - Two or more races residents 192 89.4% Owner occupied23 10.6% Renter occupiedHouse owners and renters - White alone residents 1,322 74.4% Owner occupied455 25.6% Renter occupiedHouse owners and renters - Hispanic or Latino residents 212 60.7% Owner occupied137 39.3% Renter occupied
Language usage in Woodburn
English speakers - Total 51.3% of residents of Woodburn speak English at home.
5.7% of residents speak Spanish at home 503 92.3% Speak English very well42 7.7% Speak English less than very well47.1% of residents speak other language at home 2,744 60.6% Speak English very well1,786 39.4% Speak English less than very well
English speakers - Born in the United States 75.7% of residents of Woodburn speak English at home.
3.2% of residents speak Spanish at home 123 100.0% Speak English very well27.4% of residents speak other language at home 847 79.9% Speak English very well213 20.1% Speak English less than very well
English speakers - Native, born elsewhere 45.0% of residents of Woodburn speak English at home.
60.7% of residents speak other language at home 202 100.0% Speak English very well
English speakers - Foreign-born 6.2% of residents of Woodburn speak English at home.
8.8% of residents speak Spanish at home 272 86.9% Speak English very well41 13.1% Speak English less than very well90.9% of residents speak other language at home 1,641 50.7% Speak English very well1,593 49.3% Speak English less than very well
White (Caucasian) - Speak only English Native:
84.3% (3,544)Foreign-born:
4.7% (41)
White (Caucasian) - Speak another language Native:
15.7% (659)Foreign-born:
97.8% (867)
Black or African American - Speak only English Native:
70.6% (312)Foreign-born:
9.6% (14)
Black or African American - Speak another language Native:
36.9% (163)Foreign-born:
99.2% (149)
Asian - Speak only English Native:
58.9% (566)Foreign-born:
5.4% (112)
Asian - Speak another language Native:
39.6% (381)Foreign-born:
94.5% (1,967)
Other race - Speak only English Native:
84.5% (16)Foreign-born:
25.3% (45)
Other race - Speak another language Native:
14.4% (3)Foreign-born:
72.5% (128)
Two or more races - Speak only English Native:
56.8% (253)Foreign-born:
14.0% (23)
Two or more races - Speak another language Native:
46.2% (206)Foreign-born:
86.4% (141)
White alone - Speak only English Native:
83.4% (3,287)Foreign-born:
4.1% (42)
White alone - Speak another language Native:
20.4% (803)Foreign-born:
100.0% (1,014)
Hispanic or Latino - Speak only English Native:
69.6% (408)Foreign-born:
16.8% (57)
Hispanic or Latino - Speak another language Native:
31.5% (184)Foreign-born:
84.0% (283)
Foreign-born residents in Woodburn
Marital status for residents in Woodburn Marital status - White (Caucasian) population 15 years and over
Males 34.0% Never married59.4% Now married0.1% Separated2.6% Widowed3.8% DivorcedFemales 28.1% Never married53.8% Now married2.9% Separated6.2% Widowed9.0% DivorcedWomen who gave birth in the past 12 months Now married:
100.0% (37)Unmarried:
0.0% (0)
Women who did not give birth in the past 12 months Now married:
54.6% (636)Unmarried:
45.4% (529)
Marital status - Black or African American population 15 years and over
Males 23.0% Never married43.1% Now married0.0% Separated2.4% Widowed31.6% DivorcedFemales 31.0% Never married65.2% Now married0.0% Separated3.8% Widowed0.0% DivorcedWomen who gave birth in the past 12 months Now married:
100.0% (18)Unmarried:
0.0% (0)
Women who did not give birth in the past 12 months Now married:
63.4% (77)Unmarried:
36.6% (44)
Marital status - Asian population 15 years and over
Males 30.9% Never married68.5% Now married0.0% Separated0.6% Widowed0.0% DivorcedFemales 15.2% Never married74.7% Now married0.9% Separated5.6% Widowed3.6% DivorcedWomen who gave birth in the past 12 months Now married:
100.0% (50)Unmarried:
0.0% (0)
Women who did not give birth in the past 12 months Now married:
72.5% (454)Unmarried:
27.5% (172)
Marital status - Other race population 15 years and over
Males 35.0% Never married30.0% Now married35.0% Separated0.0% Widowed0.0% DivorcedFemales 48.0% Never married28.3% Now married0.0% Separated23.6% Widowed0.0% DivorcedWomen who did not give birth in the past 12 months Now married:
35.8% (42)Unmarried:
64.2% (75)
Marital status - Two or more races population 15 years and over
Males 43.4% Never married56.6% Now married0.0% Separated0.0% Widowed0.0% DivorcedFemales 59.6% Never married35.1% Now married3.4% Separated0.0% Widowed1.9% DivorcedWomen who did not give birth in the past 12 months Now married:
17.9% (34)Unmarried:
82.1% (158)
Marital status - White alone, not Hispanic / Latino population 15 years and over
Males 33.3% Never married59.8% Now married0.1% Separated2.8% Widowed4.0% DivorcedFemales 28.3% Never married54.7% Now married2.1% Separated6.8% Widowed8.2% DivorcedWomen who gave birth in the past 12 months Now married:
100.0% (39)Unmarried:
0.0% (0)
Women who did not give birth in the past 12 months Now married:
54.0% (596)Unmarried:
46.0% (508)
Marital status - Hispanic or Latino population 15 years and over
Males 27.2% Never married70.1% Now married2.7% Separated0.0% Widowed0.0% DivorcedFemales 37.4% Never married42.4% Now married5.1% Separated6.6% Widowed8.6% DivorcedWomen who did not give birth in the past 12 months Now married:
42.6% (129)Unmarried:
57.4% (174)
Ancestries in Woodburn
364 6.6% Jordanian314 5.7% German243 4.4% English169 3.1% American153 2.8% Bulgarian145 2.6% Irish138 2.5% Iranian114 2.1% Scottish110 2.0% Italian79 1.4% European77 1.4% African62 1.1% Afghan50 0.9% Polish37 0.7% Swedish33 0.6% Kenyan32 0.6% Lebanese23 0.4% Greek23 0.4% Ethiopian18 0.3% Danish17 0.3% French17 0.3% Hungarian15 0.3% Czech12 0.2% Albanian10 0.2% Eastern European10 0.2% Dutch9 0.2% Northern European6 0.1% Lithuanian6 0.1% Ghanaian5 0.09% French Canadian5 0.09% Portuguese5 0.09% British4 0.07% Assyrian4 0.07% Ukrainian3 0.05% Arab2 0.04% Scotch-Irish1 0.02% Jamaican
Children Nativity (place of birth) in Woodburn
Children under 6 years - Living with two parents Both parents native 221 100.0% NativeBoth parents foreign-born 199 57.7% Native145 42.3% Foreign-bornOne native, one foreign-born parent 57 100.0% NativeChildren under 6 years - Living with one parent Native parent 28 100.0% NativeForeign-born parent 82 49.3% Native84 50.7% Foreign-bornChildren 6 to 17 years - Living with two parents Both parents native 471 100.0% NativeBoth parents foreign-born 978 75.4% Native320 24.6% Foreign-bornOne native, one foreign-born parent 55 90.2% Native6 9.8% Foreign-bornChildren 6 to 17 years - Living with one parent Native parent 204 100.0% NativeForeign-born parent 50 48.3% Native54 51.7% Foreign-born
Grandparents responsible for own grandchildren in Woodburn
Grandparents (30 to 59 years) White / Caucasian 5 100.0% Not responsible for grandchildrenAsian 47 100.0% Not responsible for grandchildrenWhite alone, not Hispanic / Latino 5 100.0% Not responsible for grandchildren
Grandparents (60 years and over) White / Caucasian 29 100.0% Not responsible for grandchildrenAsian 2 2.5% Responsible for grandchildren94 97.5% Not responsible for grandchildrenWhite alone, not Hispanic / Latino 31 100.0% Not responsible for grandchildren