Races in Wood-Ridge, New Jersey (NJ) Detailed Stats
Data:
Races - White alone (%)
Races - White alone (% change since 2000)
Races - Black alone (%)
Races - Black alone (% change since 2000)
Races - American Indian alone (%)
Races - American Indian alone (% change since 2000)
Races - Asian alone (%)
Races - Asian alone (% change since 2000)
Races - Hispanic (%)
Races - Hispanic (% change since 2000)
Races - Native Hawaiian and Other Pacific Islander alone (%)
Races - Native Hawaiian and Other Pacific Islander alone (% change since 2000)
Races - Two or more races(%)
Races - Two or more races(% change since 2000)
Races - Other race alone (%)
Races - Other race alone (% change since 2000)
Racial diversity
Place of birth - Born in state of residence (%)
Place of birth - Born in state of residence (%) - White
Place of birth - Born in state of residence (%) - Black or African American
Place of birth - Born in state of residence (%) - Asian
Place of birth - Born in state of residence (%) - Hispanic or Latino
Place of birth - Born in state of residence (%) - American Indian and Alaska Native
Place of birth - Born in state of residence (%) - Multirace
Place of birth - Born in state of residence (%) - Other Race
Place of birth - Born in other state (%)
Place of birth - Born in other state (%) - White
Place of birth - Born in other state (%) - Black or African American
Place of birth - Born in other state (%) - Asian
Place of birth - Born in other state (%) - Hispanic or Latino
Place of birth - Born in other state (%) - American Indian and Alaska Native
Place of birth - Born in other state (%) - Multirace
Place of birth - Born in other state (%) - Other Race
Place of birth - Native, outside of US (%)
Place of birth - Native, outside of US (%) - White
Place of birth - Native, outside of US (%) - Black or African American
Place of birth - Native, outside of US (%) - Asian
Place of birth - Native, outside of US (%) - Hispanic or Latino
Place of birth - Native, outside of US (%) - American Indian and Alaska Native
Place of birth - Native, outside of US (%) - Multirace
Place of birth - Native, outside of US (%) - Other Race
Place of birth - Foreign born (%)
Place of birth - Foreign born (%) - White
Place of birth - Foreign born (%) - Black or African American
Place of birth - Foreign born (%) - Asian
Place of birth - Foreign born (%) - Hispanic or Latino
Place of birth - Foreign born (%) - American Indian and Alaska Native
Place of birth - Foreign born (%) - Multirace
Place of birth - Foreign born (%) - Other Race
Residents speaking English at home (%)
Residents speaking English at home - Born in the United States (%)
Residents speaking English at home - Native, born elsewhere (%)
Residents speaking English at home - Foreign born (%)
Residents speaking Spanish at home (%)
Residents speaking Spanish at home - Born in the United States (%)
Residents speaking Spanish at home - Native, born elsewhere (%)
Residents speaking Spanish at home - Foreign born (%)
Residents speaking other language at home (%)
Residents speaking other language at home - Born in the United States (%)
Residents speaking other language at home - Native, born elsewhere (%)
Residents speaking other language at home - Foreign born (%)
Marital status - Never married (%)
Marital status - Now married (%)
Marital status - Separated (%)
Marital status - Widowed (%)
Marital status - Divorced (%)
Ancestries Reported - Arab (%)
Ancestries Reported - Czech (%)
Ancestries Reported - Danish (%)
Ancestries Reported - Dutch (%)
Ancestries Reported - English (%)
Ancestries Reported - French (%)
Ancestries Reported - French Canadian (%)
Ancestries Reported - German (%)
Ancestries Reported - Greek (%)
Ancestries Reported - Hungarian (%)
Ancestries Reported - Irish (%)
Ancestries Reported - Italian (%)
Ancestries Reported - Lithuanian (%)
Ancestries Reported - Norwegian (%)
Ancestries Reported - Polish (%)
Ancestries Reported - Portuguese (%)
Ancestries Reported - Russian (%)
Ancestries Reported - Scotch-Irish (%)
Ancestries Reported - Scottish (%)
Ancestries Reported - Slovak (%)
Ancestries Reported - Subsaharan African (%)
Ancestries Reported - Swedish (%)
Ancestries Reported - Swiss (%)
Ancestries Reported - Ukrainian (%)
Ancestries Reported - United States (%)
Ancestries Reported - Welsh (%)
Ancestries Reported - West Indian (%)
Ancestries Reported - Other (%)
Geographical mobility - Same house 1 year ago (%)
Geographical mobility - Same house 1 year ago (%) - White
Geographical mobility - Same house 1 year ago (%) - Black or African American
Geographical mobility - Same house 1 year ago (%) - Asian
Geographical mobility - Same house 1 year ago (%) - Hispanic or Latino
Geographical mobility - Same house 1 year ago (%) - American Indian and Alaska Native
Geographical mobility - Same house 1 year ago (%) - Multirace
Geographical mobility - Same house 1 year ago (%) - Other Race
Geographical mobility - Moved within same county (%)
Geographical mobility - Moved within same county (%) - White
Geographical mobility - Moved within same county (%) - Black or African American
Geographical mobility - Moved within same county (%) - Asian
Geographical mobility - Moved within same county (%) - Hispanic or Latino
Geographical mobility - Moved within same county (%) - American Indian and Alaska Native
Geographical mobility - Moved within same county (%) - Multirace
Geographical mobility - Moved within same county (%) - Other Race
Geographical mobility - Moved from different county within same state (%)
Geographical mobility - Moved from different county within same state (%) - White
Geographical mobility - Moved from different county within same state (%) - Black or African American
Geographical mobility - Moved from different county within same state (%) - Asian
Geographical mobility - Moved from different county within same state (%) - Hispanic or Latino
Geographical mobility - Moved from different county within same state (%) - American Indian and Alaska Native
Geographical mobility - Moved from different county within same state (%) - Multirace
Geographical mobility - Moved from different county within same state (%) - Other Race
Geographical mobility - Moved from different state (%)
Geographical mobility - Moved from different state (%) - White
Geographical mobility - Moved from different state (%) - Black or African American
Geographical mobility - Moved from different state (%) - Asian
Geographical mobility - Moved from different state (%) - Hispanic or Latino
Geographical mobility - Moved from different state (%) - American Indian and Alaska Native
Geographical mobility - Moved from different state (%) - Multirace
Geographical mobility - Moved from different state (%) - Other Race
Geographical mobility - Moved from abroad (%)
Geographical mobility - Moved from abroad (%) - White
Geographical mobility - Moved from abroad (%) - Black or African American
Geographical mobility - Moved from abroad (%) - Asian
Geographical mobility - Moved from abroad (%) - Hispanic or Latino
Geographical mobility - Moved from abroad (%) - American Indian and Alaska Native
Geographical mobility - Moved from abroad (%) - Multirace
Geographical mobility - Moved from abroad (%) - Other Race
Place of birth for the foreign-born population - Ireland (%)
Place of birth for the foreign-born population - Denmark (%)
Place of birth for the foreign-born population - Norway (%)
Place of birth for the foreign-born population - Sweden (%)
Place of birth for the foreign-born population - United Kingdom (%)
Place of birth for the foreign-born population - England (%)
Place of birth for the foreign-born population - Scotland (%)
Place of birth for the foreign-born population - Other Northern Europe (%)
Place of birth for the foreign-born population - Austria (%)
Place of birth for the foreign-born population - Belgium (%)
Place of birth for the foreign-born population - France (%)
Place of birth for the foreign-born population - Germany (%)
Place of birth for the foreign-born population - Netherlands (%)
Place of birth for the foreign-born population - Switzerland (%)
Place of birth for the foreign-born population - Other Western Europe (%)
Place of birth for the foreign-born population - Greece (%)
Place of birth for the foreign-born population - Italy (%)
Place of birth for the foreign-born population - Portugal (%)
Place of birth for the foreign-born population - Spain (%)
Place of birth for the foreign-born population - Other Southern Europe (%)
Place of birth for the foreign-born population - Albania (%)
Place of birth for the foreign-born population - Belarus (%)
Place of birth for the foreign-born population - Bosnia and Herzegovina (%)
Place of birth for the foreign-born population - Bulgaria (%)
Place of birth for the foreign-born population - Croatia (%)
Place of birth for the foreign-born population - Czechoslovakia (%)
Place of birth for the foreign-born population - Hungary (%)
Place of birth for the foreign-born population - Latvia (%)
Place of birth for the foreign-born population - Lithuania (%)
Place of birth for the foreign-born population - North Macedonia (Macedonia) (%)
Place of birth for the foreign-born population - Moldova (%)
Place of birth for the foreign-born population - Poland (%)
Place of birth for the foreign-born population - Romania (%)
Place of birth for the foreign-born population - Russia (%)
Place of birth for the foreign-born population - Serbia (%)
Place of birth for the foreign-born population - Ukraine (%)
Place of birth for the foreign-born population - Other Eastern Europe (%)
Place of birth for the foreign-born population - China (%)
Place of birth for the foreign-born population - Hong Kong (%)
Place of birth for the foreign-born population - Taiwan (%)
Place of birth for the foreign-born population - Japan (%)
Place of birth for the foreign-born population - Korea (%)
Place of birth for the foreign-born population - Other Eastern Asia (%)
Place of birth for the foreign-born population - Afghanistan (%)
Place of birth for the foreign-born population - Bangladesh (%)
Place of birth for the foreign-born population - India (%)
Place of birth for the foreign-born population - Iran (%)
Place of birth for the foreign-born population - Kazakhstan (%)
Place of birth for the foreign-born population - Nepal (%)
Place of birth for the foreign-born population - Pakistan (%)
Place of birth for the foreign-born population - Sri Lanka (%)
Place of birth for the foreign-born population - Uzbekistan (%)
Place of birth for the foreign-born population - Other South Central Asia (%)
Place of birth for the foreign-born population - Burma (%)
Place of birth for the foreign-born population - Cambodia (%)
Place of birth for the foreign-born population - Indonesia (%)
Place of birth for the foreign-born population - Laos (%)
Place of birth for the foreign-born population - Malaysia (%)
Place of birth for the foreign-born population - Philippines (%)
Place of birth for the foreign-born population - Singapore (%)
Place of birth for the foreign-born population - Thailand (%)
Place of birth for the foreign-born population - Vietnam (%)
Place of birth for the foreign-born population - Other South Eastern Asia (%)
Place of birth for the foreign-born population - Armenia (%)
Place of birth for the foreign-born population - Iraq (%)
Place of birth for the foreign-born population - Israel (%)
Place of birth for the foreign-born population - Jordan (%)
Place of birth for the foreign-born population - Kuwait (%)
Place of birth for the foreign-born population - Lebanon (%)
Place of birth for the foreign-born population - Saudi Arabia (%)
Place of birth for the foreign-born population - Syria (%)
Place of birth for the foreign-born population - Turkey (%)
Place of birth for the foreign-born population - Yemen (%)
Place of birth for the foreign-born population - Other Western Asia (%)
Place of birth for the foreign-born population - Eritrea (%)
Place of birth for the foreign-born population - Ethiopia (%)
Place of birth for the foreign-born population - Kenya (%)
Place of birth for the foreign-born population - Somalia (%)
Place of birth for the foreign-born population - Uganda (%)
Place of birth for the foreign-born population - Zimbabwe (%)
Place of birth for the foreign-born population - Other Eastern Africa (%)
Place of birth for the foreign-born population - Cameroon (%)
Place of birth for the foreign-born population - Congo (%)
Place of birth for the foreign-born population - Democratic Republic of Congo (Zaire) (%)
Place of birth for the foreign-born population - Other Middle Africa (%)
Place of birth for the foreign-born population - Egypt (%)
Place of birth for the foreign-born population - Morocco (%)
Place of birth for the foreign-born population - Sudan (%)
Place of birth for the foreign-born population - Other Northern Africa (%)
Place of birth for the foreign-born population - South Africa (%)
Place of birth for the foreign-born population - Other Southern Africa (%)
Place of birth for the foreign-born population - Cabo Verde (%)
Place of birth for the foreign-born population - Ghana (%)
Place of birth for the foreign-born population - Liberia (%)
Place of birth for the foreign-born population - Nigeria (%)
Place of birth for the foreign-born population - Senegal (%)
Place of birth for the foreign-born population - Sierra Leone (%)
Place of birth for the foreign-born population - Other Western Africa (%)
Place of birth for the foreign-born population - Australia (%)
Place of birth for the foreign-born population - New Zealand (%)
Place of birth for the foreign-born population - Fiji (%)
Place of birth for the foreign-born population - Micronesia (%)
Place of birth for the foreign-born population - Bahamas (%)
Place of birth for the foreign-born population - Barbados (%)
Place of birth for the foreign-born population - Cuba (%)
Place of birth for the foreign-born population - Dominica (%)
Place of birth for the foreign-born population - Dominican Republic (%)
Place of birth for the foreign-born population - Grenada (%)
Place of birth for the foreign-born population - Haiti (%)
Place of birth for the foreign-born population - Jamaica (%)
Place of birth for the foreign-born population - St. Vincent and the Grenadines (%)
Place of birth for the foreign-born population - Trinidad and Tobago (%)
Place of birth for the foreign-born population - West Indies (%)
Place of birth for the foreign-born population - Other Caribbean (%)
Place of birth for the foreign-born population - Belize (%)
Place of birth for the foreign-born population - Costa Rica (%)
Place of birth for the foreign-born population - El Salvador (%)
Place of birth for the foreign-born population - Guatemala (%)
Place of birth for the foreign-born population - Honduras (%)
Place of birth for the foreign-born population - Mexico (%)
Place of birth for the foreign-born population - Nicaragua (%)
Place of birth for the foreign-born population - Panama (%)
Place of birth for the foreign-born population - Other Central America (%)
Place of birth for the foreign-born population - Argentina (%)
Place of birth for the foreign-born population - Bolivia (%)
Place of birth for the foreign-born population - Brazil (%)
Place of birth for the foreign-born population - Chile (%)
Place of birth for the foreign-born population - Colombia (%)
Place of birth for the foreign-born population - Ecuador (%)
Place of birth for the foreign-born population - Guyana (%)
Place of birth for the foreign-born population - Peru (%)
Place of birth for the foreign-born population - Uruguay (%)
Place of birth for the foreign-born population - Venezuela (%)
Place of birth for the foreign-born population - Other South America (%)
Place of birth for the foreign-born population - Canada (%)
Place of birth for the foreign-born population - Other Northern America (%)
Place of birth for the foreign-born population - Other (%)
Latest news about races in Wood-Ridge, NJ collected exclusively by city-data.com from local newspapers, TV, and radio stations
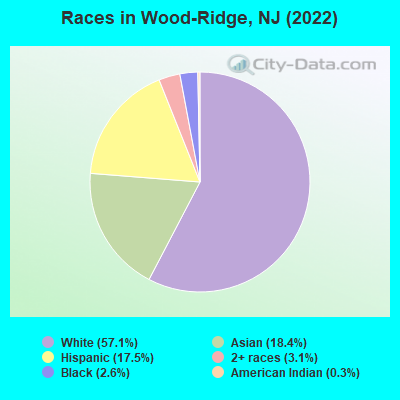
According to 2022 data, the most numerous races in Wood-Ridge, NJ are White alone (5,696 residents), Hispanic (1,744 residents), and Black alone (257 residents). 66.3% of Wood-Ridge residents speak English at home. 26.0% of Wood-Ridge, NJ residents are foreign-born (12.5% born in Asia, 6.7% born in Latin America, 5.7% born in Europe), which is 11.4% greater than the foreign-born rate of 23.0% across the entire state of New Jersey.
Race distribution in Wood-Ridge
2000 2022
5,557,209 66.0% White alone 1,117,191 13.3% Hispanic 1,096,171 13.0% Black alone 477,012 5.7% Asian alone 133,689 1.6% Two or more races 19,565 0.2% Other race alone 11,338 0.1% American Indian alone 2,175 0.03% Native Hawaiian and Other
4,766,476 51.5% White alone 2,028,470 21.9% Hispanic 1,111,632 12.0% Black alone 923,546 10.0% Asian alone 332,237 3.6% Two or more races 89,847 1.0% Other race alone 8,557 0.09% American Indian alone 934 0.01% Native Hawaiian and Other
Income and house value in Wood-Ridge Median household income in 2022 $134,534 White non-Hispanic householdersover $200,000 Black householders$120,060 Asian householders$45,026 Some other race householders$199,974 Two or more races householders$106,146 Hispanic or Latino race householdersMedian 2022 house value $519,153 White Non-Hispanic householders $667,672 Asian householders$586,132 Some other race householders$586,132 Two or more races householders$519,947 Hispanic or Latino householders
Median age by race in Wood-Ridge
43.9 Median age for White residents43.6 44.1 43.5 Median age for Black or African American residents46.2 38.1 -766,197,182.3 Median age for American Indian / Alaska Native residents-686,322,685.6 -753,722,794.2 36.7 Median age for Asian residents37.4 34.3 -510,460,250.5 Median age for Native Hawaiian / Pacific Islander residents-514,767,932.0 -713,070,378.3 31.1 Median age for Other race residents31.7 30.4 33.7 Median age for Two or more races residents24.1 36.2 44.2 Median age for White alone residents43.7 44.6 31.8 Median age for Hispanic or Latino residents32.2 30.2
Owner/renter occupied households by race in Wood-Ridge
House owners and renters - White residents 1,706 73.0% Owner occupied632 27.0% Renter occupiedHouse owners and renters - Black or African American residents 21 17.0% Owner occupied104 83.0% Renter occupiedHouse owners and renters - Asian residents 422 54.8% Owner occupied348 45.2% Renter occupiedHouse owners and renters - Other race residents 146 40.8% Owner occupied212 59.2% Renter occupiedHouse owners and renters - Two or more races residents 162 61.9% Owner occupied100 38.1% Renter occupiedHouse owners and renters - White alone residents 1,636 71.1% Owner occupied665 28.9% Renter occupiedHouse owners and renters - Hispanic or Latino residents 346 60.6% Owner occupied225 39.4% Renter occupied
Language usage in Wood-Ridge
English speakers - Total 66.3% of residents of Wood-Ridge speak English at home.
11.5% of residents speak Spanish at home 877 81.9% Speak English very well194 18.1% Speak English less than very well21.2% of residents speak other language at home 1,314 66.7% Speak English very well657 33.3% Speak English less than very well
English speakers - Born in the United States 74.3% of residents of Wood-Ridge speak English at home.
11.0% of residents speak Spanish at home 189 100.0% Speak English very well14.9% of residents speak other language at home 257 100.0% Speak English very well
English speakers - Native, born elsewhere 0.0% of residents of Wood-Ridge speak English at home.
86.7% of residents speak Spanish at home 98 100.0% Speak English very well11.5% of residents speak other language at home 13 100.0% Speak English very well
English speakers - Foreign-born 14.0% of residents of Wood-Ridge speak English at home.
24.3% of residents speak Spanish at home 464 74.7% Speak English very well157 25.3% Speak English less than very well60.3% of residents speak other language at home 886 57.5% Speak English very well654 42.5% Speak English less than very well
White (Caucasian) - Speak only English Native:
97.4% (4,905)Foreign-born:
32.6% (225)
White (Caucasian) - Speak another language Native:
4.4% (223)Foreign-born:
69.9% (482)
Black or African American - Speak only English Native:
99.9% (253)Foreign-born:
100.0% (17)
Asian - Speak only English Native:
31.8% (156)Foreign-born:
5.8% (69)
Asian - Speak another language Native:
67.5% (331)Foreign-born:
94.4% (1,114)
Other race - Speak another language Native:
65.7% (211)Foreign-born:
100.0% (246)
Two or more races - Speak only English Native:
73.2% (316)Foreign-born:
10.8% (41)
Two or more races - Speak another language Native:
24.8% (107)Foreign-born:
89.4% (338)
White alone - Speak only English Native:
98.0% (4,664)Foreign-born:
35.2% (221)
White alone - Speak another language Native:
2.3% (110)Foreign-born:
64.4% (404)
Hispanic or Latino - Speak only English Native:
53.8% (524)Foreign-born:
2.0% (13)
Hispanic or Latino - Speak another language Native:
43.1% (420)Foreign-born:
96.9% (630)
Foreign-born residents in Wood-Ridge 2,589 residents are foreign born (12.5% Asia , 6.7% Latin America , 5.7% Europe ).
This city:
26.0%New Jersey:
23.2%
Marital status for residents in Wood-Ridge Marital status - White (Caucasian) population 15 years and over
Males 28.5% Never married67.0% Now married0.0% Separated1.2% Widowed3.4% DivorcedFemales 29.3% Never married58.4% Now married0.7% Separated3.6% Widowed8.0% DivorcedWomen who gave birth in the past 12 months Now married:
100.0% (16)Unmarried:
0.0% (0)
Women who did not give birth in the past 12 months Now married:
45.8% (562)Unmarried:
54.2% (665)
Marital status - Black or African American population 15 years and over
Males 32.6% Never married67.4% Now married0.0% Separated0.0% Widowed0.0% DivorcedFemales 0.0% Never married100.0% Now married0.0% Separated0.0% Widowed0.0% DivorcedWomen who did not give birth in the past 12 months Now married:
100.0% (79)Unmarried:
0.0% (0)
Marital status - Asian population 15 years and over
Males 27.4% Never married72.6% Now married0.0% Separated0.0% Widowed0.0% DivorcedFemales 36.9% Never married58.7% Now married0.0% Separated4.4% Widowed0.0% DivorcedWomen who gave birth in the past 12 months Now married:
100.0% (45)Unmarried:
0.0% (0)
Women who did not give birth in the past 12 months Now married:
40.2% (226)Unmarried:
59.8% (336)
Marital status - Other race population 15 years and over
Males 73.9% Never married26.1% Now married0.0% Separated0.0% Widowed0.0% DivorcedFemales 43.6% Never married29.8% Now married0.0% Separated0.0% Widowed26.6% DivorcedWomen who gave birth in the past 12 months Now married:
100.0% (49)Unmarried:
0.0% (0)
Women who did not give birth in the past 12 months Now married:
0.0% (0)Unmarried:
100.0% (72)
Marital status - Two or more races population 15 years and over
Males 53.4% Never married46.6% Now married0.0% Separated0.0% Widowed0.0% DivorcedFemales 35.9% Never married43.0% Now married0.0% Separated7.1% Widowed13.9% DivorcedWomen who did not give birth in the past 12 months Now married:
30.1% (86)Unmarried:
69.9% (200)
Marital status - White alone, not Hispanic / Latino population 15 years and over
Males 27.7% Never married67.0% Now married0.0% Separated1.4% Widowed3.9% DivorcedFemales 28.2% Never married58.7% Now married0.7% Separated3.9% Widowed8.4% DivorcedWomen who gave birth in the past 12 months Now married:
100.0% (18)Unmarried:
0.0% (0)
Women who did not give birth in the past 12 months Now married:
46.7% (588)Unmarried:
53.3% (673)
Marital status - Hispanic or Latino population 15 years and over
Males 46.3% Never married53.7% Now married0.0% Separated0.0% Widowed0.0% DivorcedFemales 43.9% Never married43.7% Now married0.0% Separated3.8% Widowed8.6% DivorcedWomen who gave birth in the past 12 months Now married:
100.0% (29)Unmarried:
0.0% (0)
Women who did not give birth in the past 12 months Now married:
28.7% (106)Unmarried:
71.3% (262)
Ancestries in Wood-Ridge
1,174 22.6% Italian250 4.8% American200 3.9% Irish150 2.9% Polish129 2.5% German70 1.3% Romanian69 1.3% Armenian63 1.2% Welsh57 1.1% English54 1.0% Albanian54 1.0% European48 0.9% Eastern European48 0.9% Iranian37 0.7% Hungarian31 0.6% Croatian26 0.5% Belizean19 0.4% British19 0.4% Slavic18 0.3% Arab18 0.3% Macedonian17 0.3% Ukrainian15 0.3% Trinidadian and Tobagonian8 0.2% Swiss
Children Nativity (place of birth) in Wood-Ridge
Children under 6 years - Living with two parents Both parents native 287 100.0% NativeBoth parents foreign-born 158 80.3% Native39 19.7% Foreign-bornOne native, one foreign-born parent 105 100.0% NativeChildren under 6 years - Living with one parent Native parent 26 100.0% NativeForeign-born parent 111 100.0% NativeChildren 6 to 17 years - Living with two parents Both parents native 583 99.7% Native2 0.3% Foreign-bornBoth parents foreign-born 105 82.9% Native22 17.1% Foreign-bornOne native, one foreign-born parent 143 100.0% NativeChildren 6 to 17 years - Living with one parent Native parent 60 100.0% NativeForeign-born parent 49 49.5% Native50 50.5% Foreign-born