Races in Winsted, Connecticut (CT) Detailed Stats
Data:
Races - White alone (%)
Races - White alone (% change since 2000)
Races - Black alone (%)
Races - Black alone (% change since 2000)
Races - American Indian alone (%)
Races - American Indian alone (% change since 2000)
Races - Asian alone (%)
Races - Asian alone (% change since 2000)
Races - Hispanic (%)
Races - Hispanic (% change since 2000)
Races - Native Hawaiian and Other Pacific Islander alone (%)
Races - Native Hawaiian and Other Pacific Islander alone (% change since 2000)
Races - Two or more races(%)
Races - Two or more races(% change since 2000)
Races - Other race alone (%)
Races - Other race alone (% change since 2000)
Racial diversity
Place of birth - Born in state of residence (%)
Place of birth - Born in state of residence (%) - White
Place of birth - Born in state of residence (%) - Black or African American
Place of birth - Born in state of residence (%) - Asian
Place of birth - Born in state of residence (%) - Hispanic or Latino
Place of birth - Born in state of residence (%) - American Indian and Alaska Native
Place of birth - Born in state of residence (%) - Multirace
Place of birth - Born in state of residence (%) - Other Race
Place of birth - Born in other state (%)
Place of birth - Born in other state (%) - White
Place of birth - Born in other state (%) - Black or African American
Place of birth - Born in other state (%) - Asian
Place of birth - Born in other state (%) - Hispanic or Latino
Place of birth - Born in other state (%) - American Indian and Alaska Native
Place of birth - Born in other state (%) - Multirace
Place of birth - Born in other state (%) - Other Race
Place of birth - Native, outside of US (%)
Place of birth - Native, outside of US (%) - White
Place of birth - Native, outside of US (%) - Black or African American
Place of birth - Native, outside of US (%) - Asian
Place of birth - Native, outside of US (%) - Hispanic or Latino
Place of birth - Native, outside of US (%) - American Indian and Alaska Native
Place of birth - Native, outside of US (%) - Multirace
Place of birth - Native, outside of US (%) - Other Race
Place of birth - Foreign born (%)
Place of birth - Foreign born (%) - White
Place of birth - Foreign born (%) - Black or African American
Place of birth - Foreign born (%) - Asian
Place of birth - Foreign born (%) - Hispanic or Latino
Place of birth - Foreign born (%) - American Indian and Alaska Native
Place of birth - Foreign born (%) - Multirace
Place of birth - Foreign born (%) - Other Race
Residents speaking English at home (%)
Residents speaking English at home - Born in the United States (%)
Residents speaking English at home - Native, born elsewhere (%)
Residents speaking English at home - Foreign born (%)
Residents speaking Spanish at home (%)
Residents speaking Spanish at home - Born in the United States (%)
Residents speaking Spanish at home - Native, born elsewhere (%)
Residents speaking Spanish at home - Foreign born (%)
Residents speaking other language at home (%)
Residents speaking other language at home - Born in the United States (%)
Residents speaking other language at home - Native, born elsewhere (%)
Residents speaking other language at home - Foreign born (%)
Marital status - Never married (%)
Marital status - Now married (%)
Marital status - Separated (%)
Marital status - Widowed (%)
Marital status - Divorced (%)
Ancestries Reported - Arab (%)
Ancestries Reported - Czech (%)
Ancestries Reported - Danish (%)
Ancestries Reported - Dutch (%)
Ancestries Reported - English (%)
Ancestries Reported - French (%)
Ancestries Reported - French Canadian (%)
Ancestries Reported - German (%)
Ancestries Reported - Greek (%)
Ancestries Reported - Hungarian (%)
Ancestries Reported - Irish (%)
Ancestries Reported - Italian (%)
Ancestries Reported - Lithuanian (%)
Ancestries Reported - Norwegian (%)
Ancestries Reported - Polish (%)
Ancestries Reported - Portuguese (%)
Ancestries Reported - Russian (%)
Ancestries Reported - Scotch-Irish (%)
Ancestries Reported - Scottish (%)
Ancestries Reported - Slovak (%)
Ancestries Reported - Subsaharan African (%)
Ancestries Reported - Swedish (%)
Ancestries Reported - Swiss (%)
Ancestries Reported - Ukrainian (%)
Ancestries Reported - United States (%)
Ancestries Reported - Welsh (%)
Ancestries Reported - West Indian (%)
Ancestries Reported - Other (%)
Geographical mobility - Same house 1 year ago (%)
Geographical mobility - Same house 1 year ago (%) - White
Geographical mobility - Same house 1 year ago (%) - Black or African American
Geographical mobility - Same house 1 year ago (%) - Asian
Geographical mobility - Same house 1 year ago (%) - Hispanic or Latino
Geographical mobility - Same house 1 year ago (%) - American Indian and Alaska Native
Geographical mobility - Same house 1 year ago (%) - Multirace
Geographical mobility - Same house 1 year ago (%) - Other Race
Geographical mobility - Moved within same county (%)
Geographical mobility - Moved within same county (%) - White
Geographical mobility - Moved within same county (%) - Black or African American
Geographical mobility - Moved within same county (%) - Asian
Geographical mobility - Moved within same county (%) - Hispanic or Latino
Geographical mobility - Moved within same county (%) - American Indian and Alaska Native
Geographical mobility - Moved within same county (%) - Multirace
Geographical mobility - Moved within same county (%) - Other Race
Geographical mobility - Moved from different county within same state (%)
Geographical mobility - Moved from different county within same state (%) - White
Geographical mobility - Moved from different county within same state (%) - Black or African American
Geographical mobility - Moved from different county within same state (%) - Asian
Geographical mobility - Moved from different county within same state (%) - Hispanic or Latino
Geographical mobility - Moved from different county within same state (%) - American Indian and Alaska Native
Geographical mobility - Moved from different county within same state (%) - Multirace
Geographical mobility - Moved from different county within same state (%) - Other Race
Geographical mobility - Moved from different state (%)
Geographical mobility - Moved from different state (%) - White
Geographical mobility - Moved from different state (%) - Black or African American
Geographical mobility - Moved from different state (%) - Asian
Geographical mobility - Moved from different state (%) - Hispanic or Latino
Geographical mobility - Moved from different state (%) - American Indian and Alaska Native
Geographical mobility - Moved from different state (%) - Multirace
Geographical mobility - Moved from different state (%) - Other Race
Geographical mobility - Moved from abroad (%)
Geographical mobility - Moved from abroad (%) - White
Geographical mobility - Moved from abroad (%) - Black or African American
Geographical mobility - Moved from abroad (%) - Asian
Geographical mobility - Moved from abroad (%) - Hispanic or Latino
Geographical mobility - Moved from abroad (%) - American Indian and Alaska Native
Geographical mobility - Moved from abroad (%) - Multirace
Geographical mobility - Moved from abroad (%) - Other Race
Place of birth for the foreign-born population - Ireland (%)
Place of birth for the foreign-born population - Denmark (%)
Place of birth for the foreign-born population - Norway (%)
Place of birth for the foreign-born population - Sweden (%)
Place of birth for the foreign-born population - United Kingdom (%)
Place of birth for the foreign-born population - England (%)
Place of birth for the foreign-born population - Scotland (%)
Place of birth for the foreign-born population - Other Northern Europe (%)
Place of birth for the foreign-born population - Austria (%)
Place of birth for the foreign-born population - Belgium (%)
Place of birth for the foreign-born population - France (%)
Place of birth for the foreign-born population - Germany (%)
Place of birth for the foreign-born population - Netherlands (%)
Place of birth for the foreign-born population - Switzerland (%)
Place of birth for the foreign-born population - Other Western Europe (%)
Place of birth for the foreign-born population - Greece (%)
Place of birth for the foreign-born population - Italy (%)
Place of birth for the foreign-born population - Portugal (%)
Place of birth for the foreign-born population - Spain (%)
Place of birth for the foreign-born population - Other Southern Europe (%)
Place of birth for the foreign-born population - Albania (%)
Place of birth for the foreign-born population - Belarus (%)
Place of birth for the foreign-born population - Bosnia and Herzegovina (%)
Place of birth for the foreign-born population - Bulgaria (%)
Place of birth for the foreign-born population - Croatia (%)
Place of birth for the foreign-born population - Czechoslovakia (%)
Place of birth for the foreign-born population - Hungary (%)
Place of birth for the foreign-born population - Latvia (%)
Place of birth for the foreign-born population - Lithuania (%)
Place of birth for the foreign-born population - North Macedonia (Macedonia) (%)
Place of birth for the foreign-born population - Moldova (%)
Place of birth for the foreign-born population - Poland (%)
Place of birth for the foreign-born population - Romania (%)
Place of birth for the foreign-born population - Russia (%)
Place of birth for the foreign-born population - Serbia (%)
Place of birth for the foreign-born population - Ukraine (%)
Place of birth for the foreign-born population - Other Eastern Europe (%)
Place of birth for the foreign-born population - China (%)
Place of birth for the foreign-born population - Hong Kong (%)
Place of birth for the foreign-born population - Taiwan (%)
Place of birth for the foreign-born population - Japan (%)
Place of birth for the foreign-born population - Korea (%)
Place of birth for the foreign-born population - Other Eastern Asia (%)
Place of birth for the foreign-born population - Afghanistan (%)
Place of birth for the foreign-born population - Bangladesh (%)
Place of birth for the foreign-born population - India (%)
Place of birth for the foreign-born population - Iran (%)
Place of birth for the foreign-born population - Kazakhstan (%)
Place of birth for the foreign-born population - Nepal (%)
Place of birth for the foreign-born population - Pakistan (%)
Place of birth for the foreign-born population - Sri Lanka (%)
Place of birth for the foreign-born population - Uzbekistan (%)
Place of birth for the foreign-born population - Other South Central Asia (%)
Place of birth for the foreign-born population - Burma (%)
Place of birth for the foreign-born population - Cambodia (%)
Place of birth for the foreign-born population - Indonesia (%)
Place of birth for the foreign-born population - Laos (%)
Place of birth for the foreign-born population - Malaysia (%)
Place of birth for the foreign-born population - Philippines (%)
Place of birth for the foreign-born population - Singapore (%)
Place of birth for the foreign-born population - Thailand (%)
Place of birth for the foreign-born population - Vietnam (%)
Place of birth for the foreign-born population - Other South Eastern Asia (%)
Place of birth for the foreign-born population - Armenia (%)
Place of birth for the foreign-born population - Iraq (%)
Place of birth for the foreign-born population - Israel (%)
Place of birth for the foreign-born population - Jordan (%)
Place of birth for the foreign-born population - Kuwait (%)
Place of birth for the foreign-born population - Lebanon (%)
Place of birth for the foreign-born population - Saudi Arabia (%)
Place of birth for the foreign-born population - Syria (%)
Place of birth for the foreign-born population - Turkey (%)
Place of birth for the foreign-born population - Yemen (%)
Place of birth for the foreign-born population - Other Western Asia (%)
Place of birth for the foreign-born population - Eritrea (%)
Place of birth for the foreign-born population - Ethiopia (%)
Place of birth for the foreign-born population - Kenya (%)
Place of birth for the foreign-born population - Somalia (%)
Place of birth for the foreign-born population - Uganda (%)
Place of birth for the foreign-born population - Zimbabwe (%)
Place of birth for the foreign-born population - Other Eastern Africa (%)
Place of birth for the foreign-born population - Cameroon (%)
Place of birth for the foreign-born population - Congo (%)
Place of birth for the foreign-born population - Democratic Republic of Congo (Zaire) (%)
Place of birth for the foreign-born population - Other Middle Africa (%)
Place of birth for the foreign-born population - Egypt (%)
Place of birth for the foreign-born population - Morocco (%)
Place of birth for the foreign-born population - Sudan (%)
Place of birth for the foreign-born population - Other Northern Africa (%)
Place of birth for the foreign-born population - South Africa (%)
Place of birth for the foreign-born population - Other Southern Africa (%)
Place of birth for the foreign-born population - Cabo Verde (%)
Place of birth for the foreign-born population - Ghana (%)
Place of birth for the foreign-born population - Liberia (%)
Place of birth for the foreign-born population - Nigeria (%)
Place of birth for the foreign-born population - Senegal (%)
Place of birth for the foreign-born population - Sierra Leone (%)
Place of birth for the foreign-born population - Other Western Africa (%)
Place of birth for the foreign-born population - Australia (%)
Place of birth for the foreign-born population - New Zealand (%)
Place of birth for the foreign-born population - Fiji (%)
Place of birth for the foreign-born population - Micronesia (%)
Place of birth for the foreign-born population - Bahamas (%)
Place of birth for the foreign-born population - Barbados (%)
Place of birth for the foreign-born population - Cuba (%)
Place of birth for the foreign-born population - Dominica (%)
Place of birth for the foreign-born population - Dominican Republic (%)
Place of birth for the foreign-born population - Grenada (%)
Place of birth for the foreign-born population - Haiti (%)
Place of birth for the foreign-born population - Jamaica (%)
Place of birth for the foreign-born population - St. Vincent and the Grenadines (%)
Place of birth for the foreign-born population - Trinidad and Tobago (%)
Place of birth for the foreign-born population - West Indies (%)
Place of birth for the foreign-born population - Other Caribbean (%)
Place of birth for the foreign-born population - Belize (%)
Place of birth for the foreign-born population - Costa Rica (%)
Place of birth for the foreign-born population - El Salvador (%)
Place of birth for the foreign-born population - Guatemala (%)
Place of birth for the foreign-born population - Honduras (%)
Place of birth for the foreign-born population - Mexico (%)
Place of birth for the foreign-born population - Nicaragua (%)
Place of birth for the foreign-born population - Panama (%)
Place of birth for the foreign-born population - Other Central America (%)
Place of birth for the foreign-born population - Argentina (%)
Place of birth for the foreign-born population - Bolivia (%)
Place of birth for the foreign-born population - Brazil (%)
Place of birth for the foreign-born population - Chile (%)
Place of birth for the foreign-born population - Colombia (%)
Place of birth for the foreign-born population - Ecuador (%)
Place of birth for the foreign-born population - Guyana (%)
Place of birth for the foreign-born population - Peru (%)
Place of birth for the foreign-born population - Uruguay (%)
Place of birth for the foreign-born population - Venezuela (%)
Place of birth for the foreign-born population - Other South America (%)
Place of birth for the foreign-born population - Canada (%)
Place of birth for the foreign-born population - Other Northern America (%)
Place of birth for the foreign-born population - Other (%)
Latest news about races in Winsted, CT collected exclusively by city-data.com from local newspapers, TV, and radio stations
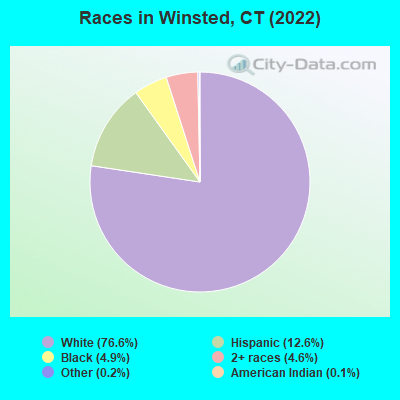
According to 2022 data, the most numerous races in Winsted, CT are White alone (5,293 residents), Hispanic (872 residents), and Black alone (337 residents). 90.9% of Winsted residents speak English at home. 7.0% of Winsted, CT residents are foreign-born (3.5% born in Latin America, 2.2% born in Europe, 1.0% born in North America), which is 115.0% less than the foreign-born rate of 15.0% across the entire state of Connecticut.
Race distribution in Winsted
2000 2022
2,638,845 77.5% White alone 320,323 9.4% Hispanic 295,571 8.7% Black alone 81,564 2.4% Asian alone 52,896 1.6% Two or more races 8,141 0.2% Other race alone 7,267 0.2% American Indian alone 958 0.03% Native Hawaiian and Other
2,246,913 62.0% White alone 658,978 18.2% Hispanic 353,973 9.8% Black alone 172,929 4.8% Asian alone 159,631 4.4% Two or more races 29,761 0.8% Other race alone 3,428 0.09% American Indian alone 592 0.02% Native Hawaiian and Other
Income and house value in Winsted Median household income in 2022 $66,460 White non-Hispanic householders$109,348 Two or more races householders$76,010 Hispanic or Latino race householdersMedian 2022 house value $200,424 White Non-Hispanic householders$144,618 Black or African American householders $382,813 Asian householders$191,406 Some other race householders$173,201 Two or more races householders$191,406 Hispanic or Latino householders
Median age by race in Winsted
48.3 Median age for White residents50.9 45.4 34.4 Median age for Black or African American residents34.7 -681,159,419.6 -742,173,111.6 Median age for American Indian / Alaska Native residents-701,030,927.1 -704,477,611.2 -689,013,034.7 Median age for Asian residents-678,062,677.4 -695,810,564.0 -641,269,840.6 Median age for Native Hawaiian / Pacific Islander residents-414,239,481.8 -691,588,784.4 45.3 Median age for Other race residents44.7 34.5 39.4 Median age for Two or more races residents20.7 39.6 48.5 Median age for White alone residents50.5 47.7 37.2 Median age for Hispanic or Latino residents26.2 37.6
Owner/renter occupied households by race in Winsted
House owners and renters - White residents 1,346 51.4% Owner occupied1,271 48.6% Renter occupiedHouse owners and renters - Black or African American residents 58 49.1% Owner occupied60 50.9% Renter occupiedHouse owners and renters - American Indian / Alaska Native residents 11 100.0% Renter occupiedHouse owners and renters - Other race residents 73 42.8% Owner occupied98 57.2% Renter occupiedHouse owners and renters - Two or more races residents 158 35.8% Owner occupied283 64.2% Renter occupiedHouse owners and renters - White alone residents 1,366 51.2% Owner occupied1,302 48.8% Renter occupiedHouse owners and renters - Hispanic or Latino residents 63 16.7% Owner occupied314 83.3% Renter occupied
Language usage in Winsted
English speakers - Total 90.9% of residents of Winsted speak English at home.
3.9% of residents speak Spanish at home 94 35.2% Speak English very well173 64.8% Speak English less than very well4.6% of residents speak other language at home 213 68.5% Speak English very well98 31.5% Speak English less than very well
English speakers - Born in the United States 95.3% of residents of Winsted speak English at home.
3.8% of residents speak other language at home 55 100.0% Speak English very well
English speakers - Native, born elsewhere 33.9% of residents of Winsted speak English at home.
64.4% of residents speak Spanish at home 40 52.6% Speak English very well36 47.4% Speak English less than very well
English speakers - Foreign-born 24.1% of residents of Winsted speak English at home.
37.3% of residents speak Spanish at home 48 26.7% Speak English very well132 73.3% Speak English less than very well38.4% of residents speak other language at home 102 55.1% Speak English very well83 44.9% Speak English less than very well
White (Caucasian) - Speak only English Native:
100.0% (4,974)Foreign-born:
31.5% (57)
White (Caucasian) - Speak another language Native:
1.0% (51)Foreign-born:
68.6% (124)
American Indian / Alaska Native - Speak only English Native:
86.4% (10)Foreign-born:
100.0% (67)
Other race - Speak another language Native:
51.6% (101)Foreign-born:
100.0% (205)
Two or more races - Speak another language Native:
11.0% (81)Foreign-born:
100.0% (26)
White alone - Speak only English Native:
98.6% (4,875)Foreign-born:
28.0% (59)
White alone - Speak another language Native:
1.4% (70)Foreign-born:
71.8% (151)
Hispanic or Latino - Speak only English Native:
89.8% (563)Foreign-born:
17.1% (42)
Hispanic or Latino - Speak another language Native:
13.7% (86)Foreign-born:
80.6% (199)
Foreign-born residents in Winsted 482 residents are foreign born (3.5% Latin America , 2.2% Europe , 1.0% North America ).
This city:
7.0%Connecticut:
15.0%
Marital status for residents in Winsted Marital status - White (Caucasian) population 15 years and over
Males 38.1% Never married45.2% Now married2.5% Separated2.5% Widowed11.7% DivorcedFemales 30.1% Never married44.6% Now married0.5% Separated7.8% Widowed17.0% DivorcedWomen who gave birth in the past 12 months Now married:
100.0% (32)Unmarried:
0.0% (0)
Women who did not give birth in the past 12 months Now married:
35.2% (396)Unmarried:
64.8% (728)
Marital status - Other race population 15 years and over
Males 35.6% Never married45.9% Now married18.5% Separated0.0% Widowed0.0% DivorcedFemales 32.7% Never married58.5% Now married8.8% Separated0.0% Widowed0.0% DivorcedWomen who did not give birth in the past 12 months Now married:
45.6% (58)Unmarried:
54.4% (69)
Marital status - Two or more races population 15 years and over
Males 85.2% Never married13.1% Now married0.0% Separated0.0% Widowed1.6% DivorcedFemales 74.0% Never married21.6% Now married0.0% Separated4.4% Widowed0.0% DivorcedWomen who did not give birth in the past 12 months Now married:
0.0% (0)Unmarried:
100.0% (361)
Marital status - White alone, not Hispanic / Latino population 15 years and over
Males 37.0% Never married46.1% Now married2.5% Separated2.5% Widowed11.9% DivorcedFemales 31.1% Never married46.0% Now married0.5% Separated8.0% Widowed14.4% DivorcedWomen who gave birth in the past 12 months Now married:
100.0% (34)Unmarried:
0.0% (0)
Women who did not give birth in the past 12 months Now married:
37.5% (417)Unmarried:
62.5% (696)
Marital status - Hispanic or Latino population 15 years and over
Males 34.8% Never married54.3% Now married10.9% Separated0.0% Widowed0.0% DivorcedFemales 55.3% Never married23.6% Now married3.5% Separated0.0% Widowed17.5% DivorcedWomen who did not give birth in the past 12 months Now married:
13.2% (49)Unmarried:
86.8% (324)
Ancestries in Winsted
462 16.7% Italian317 11.4% Irish266 9.6% American205 7.4% English86 3.1% French Canadian84 3.0% German80 2.9% European68 2.5% Greek35 1.3% Polish35 1.3% Scottish32 1.2% Canadian28 1.0% Swedish17 0.6% Ukrainian12 0.4% Russian11 0.4% Lebanese11 0.4% Assyrian11 0.4% Portuguese10 0.4% Scandinavian9 0.3% French
Children Nativity (place of birth) in Winsted
Children under 6 years - Living with two parents Both parents native 197 100.0% NativeChildren under 6 years - Living with one parent Native parent 49 100.0% Native
Children 6 to 17 years - Living with two parents Both parents native 267 100.0% NativeOne native, one foreign-born parent 68 100.0% NativeChildren 6 to 17 years - Living with one parent Native parent 376 100.0% Native