Races in Winfield, Illinois (IL) Detailed Stats
Data:
Races - White alone (%)
Races - White alone (% change since 2000)
Races - Black alone (%)
Races - Black alone (% change since 2000)
Races - American Indian alone (%)
Races - American Indian alone (% change since 2000)
Races - Asian alone (%)
Races - Asian alone (% change since 2000)
Races - Hispanic (%)
Races - Hispanic (% change since 2000)
Races - Native Hawaiian and Other Pacific Islander alone (%)
Races - Native Hawaiian and Other Pacific Islander alone (% change since 2000)
Races - Two or more races(%)
Races - Two or more races(% change since 2000)
Races - Other race alone (%)
Races - Other race alone (% change since 2000)
Racial diversity
Place of birth - Born in state of residence (%)
Place of birth - Born in state of residence (%) - White
Place of birth - Born in state of residence (%) - Black or African American
Place of birth - Born in state of residence (%) - Asian
Place of birth - Born in state of residence (%) - Hispanic or Latino
Place of birth - Born in state of residence (%) - American Indian and Alaska Native
Place of birth - Born in state of residence (%) - Multirace
Place of birth - Born in state of residence (%) - Other Race
Place of birth - Born in other state (%)
Place of birth - Born in other state (%) - White
Place of birth - Born in other state (%) - Black or African American
Place of birth - Born in other state (%) - Asian
Place of birth - Born in other state (%) - Hispanic or Latino
Place of birth - Born in other state (%) - American Indian and Alaska Native
Place of birth - Born in other state (%) - Multirace
Place of birth - Born in other state (%) - Other Race
Place of birth - Native, outside of US (%)
Place of birth - Native, outside of US (%) - White
Place of birth - Native, outside of US (%) - Black or African American
Place of birth - Native, outside of US (%) - Asian
Place of birth - Native, outside of US (%) - Hispanic or Latino
Place of birth - Native, outside of US (%) - American Indian and Alaska Native
Place of birth - Native, outside of US (%) - Multirace
Place of birth - Native, outside of US (%) - Other Race
Place of birth - Foreign born (%)
Place of birth - Foreign born (%) - White
Place of birth - Foreign born (%) - Black or African American
Place of birth - Foreign born (%) - Asian
Place of birth - Foreign born (%) - Hispanic or Latino
Place of birth - Foreign born (%) - American Indian and Alaska Native
Place of birth - Foreign born (%) - Multirace
Place of birth - Foreign born (%) - Other Race
Residents speaking English at home (%)
Residents speaking English at home - Born in the United States (%)
Residents speaking English at home - Native, born elsewhere (%)
Residents speaking English at home - Foreign born (%)
Residents speaking Spanish at home (%)
Residents speaking Spanish at home - Born in the United States (%)
Residents speaking Spanish at home - Native, born elsewhere (%)
Residents speaking Spanish at home - Foreign born (%)
Residents speaking other language at home (%)
Residents speaking other language at home - Born in the United States (%)
Residents speaking other language at home - Native, born elsewhere (%)
Residents speaking other language at home - Foreign born (%)
Marital status - Never married (%)
Marital status - Now married (%)
Marital status - Separated (%)
Marital status - Widowed (%)
Marital status - Divorced (%)
Ancestries Reported - Arab (%)
Ancestries Reported - Czech (%)
Ancestries Reported - Danish (%)
Ancestries Reported - Dutch (%)
Ancestries Reported - English (%)
Ancestries Reported - French (%)
Ancestries Reported - French Canadian (%)
Ancestries Reported - German (%)
Ancestries Reported - Greek (%)
Ancestries Reported - Hungarian (%)
Ancestries Reported - Irish (%)
Ancestries Reported - Italian (%)
Ancestries Reported - Lithuanian (%)
Ancestries Reported - Norwegian (%)
Ancestries Reported - Polish (%)
Ancestries Reported - Portuguese (%)
Ancestries Reported - Russian (%)
Ancestries Reported - Scotch-Irish (%)
Ancestries Reported - Scottish (%)
Ancestries Reported - Slovak (%)
Ancestries Reported - Subsaharan African (%)
Ancestries Reported - Swedish (%)
Ancestries Reported - Swiss (%)
Ancestries Reported - Ukrainian (%)
Ancestries Reported - United States (%)
Ancestries Reported - Welsh (%)
Ancestries Reported - West Indian (%)
Ancestries Reported - Other (%)
Geographical mobility - Same house 1 year ago (%)
Geographical mobility - Same house 1 year ago (%) - White
Geographical mobility - Same house 1 year ago (%) - Black or African American
Geographical mobility - Same house 1 year ago (%) - Asian
Geographical mobility - Same house 1 year ago (%) - Hispanic or Latino
Geographical mobility - Same house 1 year ago (%) - American Indian and Alaska Native
Geographical mobility - Same house 1 year ago (%) - Multirace
Geographical mobility - Same house 1 year ago (%) - Other Race
Geographical mobility - Moved within same county (%)
Geographical mobility - Moved within same county (%) - White
Geographical mobility - Moved within same county (%) - Black or African American
Geographical mobility - Moved within same county (%) - Asian
Geographical mobility - Moved within same county (%) - Hispanic or Latino
Geographical mobility - Moved within same county (%) - American Indian and Alaska Native
Geographical mobility - Moved within same county (%) - Multirace
Geographical mobility - Moved within same county (%) - Other Race
Geographical mobility - Moved from different county within same state (%)
Geographical mobility - Moved from different county within same state (%) - White
Geographical mobility - Moved from different county within same state (%) - Black or African American
Geographical mobility - Moved from different county within same state (%) - Asian
Geographical mobility - Moved from different county within same state (%) - Hispanic or Latino
Geographical mobility - Moved from different county within same state (%) - American Indian and Alaska Native
Geographical mobility - Moved from different county within same state (%) - Multirace
Geographical mobility - Moved from different county within same state (%) - Other Race
Geographical mobility - Moved from different state (%)
Geographical mobility - Moved from different state (%) - White
Geographical mobility - Moved from different state (%) - Black or African American
Geographical mobility - Moved from different state (%) - Asian
Geographical mobility - Moved from different state (%) - Hispanic or Latino
Geographical mobility - Moved from different state (%) - American Indian and Alaska Native
Geographical mobility - Moved from different state (%) - Multirace
Geographical mobility - Moved from different state (%) - Other Race
Geographical mobility - Moved from abroad (%)
Geographical mobility - Moved from abroad (%) - White
Geographical mobility - Moved from abroad (%) - Black or African American
Geographical mobility - Moved from abroad (%) - Asian
Geographical mobility - Moved from abroad (%) - Hispanic or Latino
Geographical mobility - Moved from abroad (%) - American Indian and Alaska Native
Geographical mobility - Moved from abroad (%) - Multirace
Geographical mobility - Moved from abroad (%) - Other Race
Place of birth for the foreign-born population - Ireland (%)
Place of birth for the foreign-born population - Denmark (%)
Place of birth for the foreign-born population - Norway (%)
Place of birth for the foreign-born population - Sweden (%)
Place of birth for the foreign-born population - United Kingdom (%)
Place of birth for the foreign-born population - England (%)
Place of birth for the foreign-born population - Scotland (%)
Place of birth for the foreign-born population - Other Northern Europe (%)
Place of birth for the foreign-born population - Austria (%)
Place of birth for the foreign-born population - Belgium (%)
Place of birth for the foreign-born population - France (%)
Place of birth for the foreign-born population - Germany (%)
Place of birth for the foreign-born population - Netherlands (%)
Place of birth for the foreign-born population - Switzerland (%)
Place of birth for the foreign-born population - Other Western Europe (%)
Place of birth for the foreign-born population - Greece (%)
Place of birth for the foreign-born population - Italy (%)
Place of birth for the foreign-born population - Portugal (%)
Place of birth for the foreign-born population - Spain (%)
Place of birth for the foreign-born population - Other Southern Europe (%)
Place of birth for the foreign-born population - Albania (%)
Place of birth for the foreign-born population - Belarus (%)
Place of birth for the foreign-born population - Bosnia and Herzegovina (%)
Place of birth for the foreign-born population - Bulgaria (%)
Place of birth for the foreign-born population - Croatia (%)
Place of birth for the foreign-born population - Czechoslovakia (%)
Place of birth for the foreign-born population - Hungary (%)
Place of birth for the foreign-born population - Latvia (%)
Place of birth for the foreign-born population - Lithuania (%)
Place of birth for the foreign-born population - North Macedonia (Macedonia) (%)
Place of birth for the foreign-born population - Moldova (%)
Place of birth for the foreign-born population - Poland (%)
Place of birth for the foreign-born population - Romania (%)
Place of birth for the foreign-born population - Russia (%)
Place of birth for the foreign-born population - Serbia (%)
Place of birth for the foreign-born population - Ukraine (%)
Place of birth for the foreign-born population - Other Eastern Europe (%)
Place of birth for the foreign-born population - China (%)
Place of birth for the foreign-born population - Hong Kong (%)
Place of birth for the foreign-born population - Taiwan (%)
Place of birth for the foreign-born population - Japan (%)
Place of birth for the foreign-born population - Korea (%)
Place of birth for the foreign-born population - Other Eastern Asia (%)
Place of birth for the foreign-born population - Afghanistan (%)
Place of birth for the foreign-born population - Bangladesh (%)
Place of birth for the foreign-born population - India (%)
Place of birth for the foreign-born population - Iran (%)
Place of birth for the foreign-born population - Kazakhstan (%)
Place of birth for the foreign-born population - Nepal (%)
Place of birth for the foreign-born population - Pakistan (%)
Place of birth for the foreign-born population - Sri Lanka (%)
Place of birth for the foreign-born population - Uzbekistan (%)
Place of birth for the foreign-born population - Other South Central Asia (%)
Place of birth for the foreign-born population - Burma (%)
Place of birth for the foreign-born population - Cambodia (%)
Place of birth for the foreign-born population - Indonesia (%)
Place of birth for the foreign-born population - Laos (%)
Place of birth for the foreign-born population - Malaysia (%)
Place of birth for the foreign-born population - Philippines (%)
Place of birth for the foreign-born population - Singapore (%)
Place of birth for the foreign-born population - Thailand (%)
Place of birth for the foreign-born population - Vietnam (%)
Place of birth for the foreign-born population - Other South Eastern Asia (%)
Place of birth for the foreign-born population - Armenia (%)
Place of birth for the foreign-born population - Iraq (%)
Place of birth for the foreign-born population - Israel (%)
Place of birth for the foreign-born population - Jordan (%)
Place of birth for the foreign-born population - Kuwait (%)
Place of birth for the foreign-born population - Lebanon (%)
Place of birth for the foreign-born population - Saudi Arabia (%)
Place of birth for the foreign-born population - Syria (%)
Place of birth for the foreign-born population - Turkey (%)
Place of birth for the foreign-born population - Yemen (%)
Place of birth for the foreign-born population - Other Western Asia (%)
Place of birth for the foreign-born population - Eritrea (%)
Place of birth for the foreign-born population - Ethiopia (%)
Place of birth for the foreign-born population - Kenya (%)
Place of birth for the foreign-born population - Somalia (%)
Place of birth for the foreign-born population - Uganda (%)
Place of birth for the foreign-born population - Zimbabwe (%)
Place of birth for the foreign-born population - Other Eastern Africa (%)
Place of birth for the foreign-born population - Cameroon (%)
Place of birth for the foreign-born population - Congo (%)
Place of birth for the foreign-born population - Democratic Republic of Congo (Zaire) (%)
Place of birth for the foreign-born population - Other Middle Africa (%)
Place of birth for the foreign-born population - Egypt (%)
Place of birth for the foreign-born population - Morocco (%)
Place of birth for the foreign-born population - Sudan (%)
Place of birth for the foreign-born population - Other Northern Africa (%)
Place of birth for the foreign-born population - South Africa (%)
Place of birth for the foreign-born population - Other Southern Africa (%)
Place of birth for the foreign-born population - Cabo Verde (%)
Place of birth for the foreign-born population - Ghana (%)
Place of birth for the foreign-born population - Liberia (%)
Place of birth for the foreign-born population - Nigeria (%)
Place of birth for the foreign-born population - Senegal (%)
Place of birth for the foreign-born population - Sierra Leone (%)
Place of birth for the foreign-born population - Other Western Africa (%)
Place of birth for the foreign-born population - Australia (%)
Place of birth for the foreign-born population - New Zealand (%)
Place of birth for the foreign-born population - Fiji (%)
Place of birth for the foreign-born population - Micronesia (%)
Place of birth for the foreign-born population - Bahamas (%)
Place of birth for the foreign-born population - Barbados (%)
Place of birth for the foreign-born population - Cuba (%)
Place of birth for the foreign-born population - Dominica (%)
Place of birth for the foreign-born population - Dominican Republic (%)
Place of birth for the foreign-born population - Grenada (%)
Place of birth for the foreign-born population - Haiti (%)
Place of birth for the foreign-born population - Jamaica (%)
Place of birth for the foreign-born population - St. Vincent and the Grenadines (%)
Place of birth for the foreign-born population - Trinidad and Tobago (%)
Place of birth for the foreign-born population - West Indies (%)
Place of birth for the foreign-born population - Other Caribbean (%)
Place of birth for the foreign-born population - Belize (%)
Place of birth for the foreign-born population - Costa Rica (%)
Place of birth for the foreign-born population - El Salvador (%)
Place of birth for the foreign-born population - Guatemala (%)
Place of birth for the foreign-born population - Honduras (%)
Place of birth for the foreign-born population - Mexico (%)
Place of birth for the foreign-born population - Nicaragua (%)
Place of birth for the foreign-born population - Panama (%)
Place of birth for the foreign-born population - Other Central America (%)
Place of birth for the foreign-born population - Argentina (%)
Place of birth for the foreign-born population - Bolivia (%)
Place of birth for the foreign-born population - Brazil (%)
Place of birth for the foreign-born population - Chile (%)
Place of birth for the foreign-born population - Colombia (%)
Place of birth for the foreign-born population - Ecuador (%)
Place of birth for the foreign-born population - Guyana (%)
Place of birth for the foreign-born population - Peru (%)
Place of birth for the foreign-born population - Uruguay (%)
Place of birth for the foreign-born population - Venezuela (%)
Place of birth for the foreign-born population - Other South America (%)
Place of birth for the foreign-born population - Canada (%)
Place of birth for the foreign-born population - Other Northern America (%)
Place of birth for the foreign-born population - Other (%)
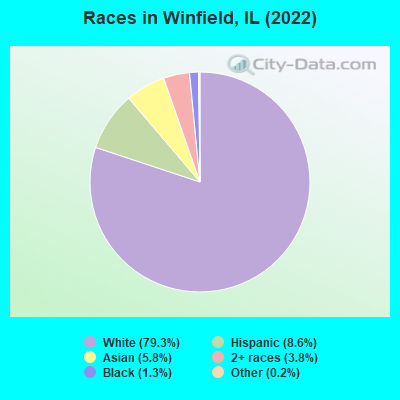
According to 2022 data, the most numerous races in Winfield, IL are White alone (7,807 residents), Hispanic (843 residents), and Black alone (125 residents). 87.7% of Winfield residents speak English at home. 7.2% of Winfield, IL residents are foreign-born (3.9% born in Asia, 1.6% born in Europe, 1.0% born in Latin America), which is 95.2% less than the foreign-born rate of 14.0% across the entire state of Illinois.
Race distribution in Winfield
2000 2022
8,424,140 67.8% White alone 1,856,152 14.9% Black alone 1,530,262 12.3% Hispanic 419,916 3.4% Asian alone 153,996 1.2% Two or more races 13,479 0.1% Other race alone 18,232 0.1% American Indian alone 3,116 0.03% Native Hawaiian and Other
7,356,301 58.5% White alone 2,299,726 18.3% Hispanic 1,660,423 13.2% Black alone 747,296 5.9% Asian alone 458,599 3.6% Two or more races 45,386 0.4% Other race alone 10,405 0.08% American Indian alone 3,896 0.03% Native Hawaiian and Other
Income and house value in Winfield Median household income in 2022 $128,610 White non-Hispanic householders$140,887 Asian householders$122,552 Two or more races householders$116,067 Hispanic or Latino race householdersMedian 2022 house value $358,216 White Non-Hispanic householders$471,112 Black or African American householders$192,727 American Indian or Alaska Native householders $479,335 Asian householders$235,556 Two or more races householders$334,404 Hispanic or Latino householders
Median age by race in Winfield
51.6 Median age for White residents47.8 53.2 50.0 Median age for Black or African American residents52.9 49.0 -699,421,964.6 Median age for American Indian / Alaska Native residents-721,943,047.9 -545,253,862.6 42.8 Median age for Asian residents42.3 46.7 -593,236,714.4 Median age for Native Hawaiian / Pacific Islander residents-658,536,584.7 -576,015,108.0 37.4 Median age for Other race residents35.6 57.4 22.7 Median age for Two or more races residents40.3 14.3 50.7 Median age for White alone residents48.7 52.4 36.3 Median age for Hispanic or Latino residents37.1 26.1
Owner/renter occupied households by race in Winfield
House owners and renters - White residents 3,174 95.6% Owner occupied148 4.4% Renter occupiedHouse owners and renters - Black or African American residents 29 55.3% Owner occupied23 44.7% Renter occupiedHouse owners and renters - Asian residents 235 100.0% Owner occupiedHouse owners and renters - Other race residents 26 42.4% Owner occupied36 57.6% Renter occupiedHouse owners and renters - Two or more races residents 214 69.5% Owner occupied94 30.5% Renter occupiedHouse owners and renters - White alone residents 3,217 96.3% Owner occupied123 3.7% Renter occupiedHouse owners and renters - Hispanic or Latino residents 137 51.0% Owner occupied132 49.0% Renter occupied
Language usage in Winfield
English speakers - Total 87.7% of residents of Winfield speak English at home.
4.7% of residents speak Spanish at home 345 78.6% Speak English very well94 21.4% Speak English less than very well7.3% of residents speak other language at home 491 71.4% Speak English very well197 28.6% Speak English less than very well
English speakers - Born in the United States 96.2% of residents of Winfield speak English at home.
1.3% of residents speak Spanish at home 29 100.0% Speak English very well2.3% of residents speak other language at home 51 100.0% Speak English very well
English speakers - Native, born elsewhere 66.0% of residents of Winfield speak English at home.
11.3% of residents speak Spanish at home 12 100.0% Speak English less than very well24.5% of residents speak other language at home 26 100.0% Speak English very well
English speakers - Foreign-born 15.2% of residents of Winfield speak English at home.
11.7% of residents speak Spanish at home 57 69.5% Speak English very well25 30.5% Speak English less than very well71.0% of residents speak other language at home 314 62.9% Speak English very well185 37.1% Speak English less than very well
White (Caucasian) - Speak only English Native:
97.9% (6,989)Foreign-born:
31.8% (77)
White (Caucasian) - Speak another language Native:
3.1% (220)Foreign-born:
70.1% (171)
Asian - Speak only English Native:
75.4% (146)Foreign-born:
6.3% (22)
Asian - Speak another language Native:
28.1% (54)Foreign-born:
94.1% (329)
Other race - Speak only English Native:
89.4% (106)Foreign-born:
23.6% (9)
Other race - Speak another language Native:
23.9% (28)Foreign-born:
72.4% (29)
Two or more races - Speak another language Native:
21.8% (218)Foreign-born:
100.0% (50)
White alone - Speak only English Native:
97.4% (6,975)Foreign-born:
27.5% (76)
White alone - Speak another language Native:
2.8% (197)Foreign-born:
72.8% (202)
Hispanic or Latino - Speak only English Native:
66.2% (487)Foreign-born:
18.3% (16)
Hispanic or Latino - Speak another language Native:
32.5% (239)Foreign-born:
80.1% (69)
Foreign-born residents in Winfield 706 residents are foreign born (3.9% Asia , 1.6% Europe , 1.0% Latin America ).
This city:
7.2%Illinois:
14.1%
Marital status for residents in Winfield Marital status - White (Caucasian) population 15 years and over
Males 22.5% Never married66.4% Now married0.6% Separated2.8% Widowed7.6% DivorcedFemales 21.0% Never married62.4% Now married0.5% Separated5.5% Widowed10.7% DivorcedWomen who gave birth in the past 12 months Now married:
89.7% (54)Unmarried:
10.3% (6)
Women who did not give birth in the past 12 months Now married:
52.7% (698)Unmarried:
47.3% (626)
Marital status - Black or African American population 15 years and over
Males 39.7% Never married27.0% Now married0.0% Separated0.0% Widowed33.3% DivorcedFemales 67.3% Never married18.4% Now married0.0% Separated14.3% Widowed0.0% DivorcedWomen who did not give birth in the past 12 months Now married:
0.0% (0)Unmarried:
100.0% (34)
Marital status - Asian population 15 years and over
Males 29.2% Never married70.8% Now married0.0% Separated0.0% Widowed0.0% DivorcedFemales 20.6% Never married79.4% Now married0.0% Separated0.0% Widowed0.0% DivorcedWomen who gave birth in the past 12 months Now married:
100.0% (10)Unmarried:
0.0% (0)
Women who did not give birth in the past 12 months Now married:
66.4% (89)Unmarried:
33.6% (45)
Marital status - Other race population 15 years and over
Males 85.1% Never married14.9% Now married0.0% Separated0.0% Widowed0.0% DivorcedFemales 0.0% Never married100.0% Now married0.0% Separated0.0% Widowed0.0% DivorcedWomen who did not give birth in the past 12 months Now married:
100.0% (43)Unmarried:
0.0% (0)
Marital status - Two or more races population 15 years and over
Males 39.5% Never married38.6% Now married0.0% Separated0.0% Widowed22.0% DivorcedFemales 41.3% Never married46.0% Now married0.0% Separated2.0% Widowed10.7% DivorcedWomen who did not give birth in the past 12 months Now married:
31.1% (40)Unmarried:
68.9% (88)
Marital status - White alone, not Hispanic / Latino population 15 years and over
Males 23.3% Never married65.3% Now married0.6% Separated2.9% Widowed7.9% DivorcedFemales 20.9% Never married62.4% Now married0.5% Separated5.6% Widowed10.6% DivorcedWomen who gave birth in the past 12 months Now married:
89.7% (58)Unmarried:
10.3% (7)
Women who did not give birth in the past 12 months Now married:
52.8% (729)Unmarried:
47.2% (652)
Marital status - Hispanic or Latino population 15 years and over
Males 26.4% Never married55.5% Now married0.0% Separated0.0% Widowed18.1% DivorcedFemales 14.1% Never married72.4% Now married0.0% Separated0.0% Widowed13.5% DivorcedWomen who did not give birth in the past 12 months Now married:
64.8% (61)Unmarried:
35.2% (33)
Ancestries in Winfield
574 16.4% German362 10.3% Polish350 10.0% Irish206 5.9% European205 5.8% Italian179 5.1% English170 4.8% American94 2.7% Norwegian66 1.9% Swedish62 1.8% Dutch43 1.2% Assyrian41 1.2% Albanian40 1.1% Turkish35 1.0% Iraqi30 0.9% French Canadian26 0.7% Danish26 0.7% Scottish22 0.6% Czech21 0.6% Lithuanian20 0.6% Slovak19 0.5% Canadian15 0.4% African12 0.3% Ukrainian10 0.3% Scotch-Irish9 0.3% Iranian8 0.2% British8 0.2% Croatian7 0.2% Eastern European7 0.2% Russian7 0.2% Serbian6 0.2% French5 0.1% Scandinavian
Children Nativity (place of birth) in Winfield
Children under 6 years - Living with two parents Both parents native 429 100.0% NativeBoth parents foreign-born 56 100.0% NativeOne native, one foreign-born parent 42 100.0% NativeChildren under 6 years - Living with one parent Native parent 6 100.0% NativeChildren 6 to 17 years - Living with two parents Both parents native 1,089 100.0% NativeBoth parents foreign-born 79 70.6% Native33 29.4% Foreign-bornOne native, one foreign-born parent 62 100.0% NativeChildren 6 to 17 years - Living with one parent Native parent 145 96.4% Native5 3.6% Foreign-bornForeign-born parent 11 100.0% Native
Grandparents responsible for own grandchildren in Winfield
Grandparents (30 to 59 years) Black or African American 17 100.0% Responsible for grandchildren
Grandparents (60 years and over)