Races in Winder, Georgia (GA) Detailed Stats
Data:
Races - White alone (%)
Races - White alone (% change since 2000)
Races - Black alone (%)
Races - Black alone (% change since 2000)
Races - American Indian alone (%)
Races - American Indian alone (% change since 2000)
Races - Asian alone (%)
Races - Asian alone (% change since 2000)
Races - Hispanic (%)
Races - Hispanic (% change since 2000)
Races - Native Hawaiian and Other Pacific Islander alone (%)
Races - Native Hawaiian and Other Pacific Islander alone (% change since 2000)
Races - Two or more races(%)
Races - Two or more races(% change since 2000)
Races - Other race alone (%)
Races - Other race alone (% change since 2000)
Racial diversity
Place of birth - Born in state of residence (%)
Place of birth - Born in state of residence (%) - White
Place of birth - Born in state of residence (%) - Black or African American
Place of birth - Born in state of residence (%) - Asian
Place of birth - Born in state of residence (%) - Hispanic or Latino
Place of birth - Born in state of residence (%) - American Indian and Alaska Native
Place of birth - Born in state of residence (%) - Multirace
Place of birth - Born in state of residence (%) - Other Race
Place of birth - Born in other state (%)
Place of birth - Born in other state (%) - White
Place of birth - Born in other state (%) - Black or African American
Place of birth - Born in other state (%) - Asian
Place of birth - Born in other state (%) - Hispanic or Latino
Place of birth - Born in other state (%) - American Indian and Alaska Native
Place of birth - Born in other state (%) - Multirace
Place of birth - Born in other state (%) - Other Race
Place of birth - Native, outside of US (%)
Place of birth - Native, outside of US (%) - White
Place of birth - Native, outside of US (%) - Black or African American
Place of birth - Native, outside of US (%) - Asian
Place of birth - Native, outside of US (%) - Hispanic or Latino
Place of birth - Native, outside of US (%) - American Indian and Alaska Native
Place of birth - Native, outside of US (%) - Multirace
Place of birth - Native, outside of US (%) - Other Race
Place of birth - Foreign born (%)
Place of birth - Foreign born (%) - White
Place of birth - Foreign born (%) - Black or African American
Place of birth - Foreign born (%) - Asian
Place of birth - Foreign born (%) - Hispanic or Latino
Place of birth - Foreign born (%) - American Indian and Alaska Native
Place of birth - Foreign born (%) - Multirace
Place of birth - Foreign born (%) - Other Race
Residents speaking English at home (%)
Residents speaking English at home - Born in the United States (%)
Residents speaking English at home - Native, born elsewhere (%)
Residents speaking English at home - Foreign born (%)
Residents speaking Spanish at home (%)
Residents speaking Spanish at home - Born in the United States (%)
Residents speaking Spanish at home - Native, born elsewhere (%)
Residents speaking Spanish at home - Foreign born (%)
Residents speaking other language at home (%)
Residents speaking other language at home - Born in the United States (%)
Residents speaking other language at home - Native, born elsewhere (%)
Residents speaking other language at home - Foreign born (%)
Marital status - Never married (%)
Marital status - Now married (%)
Marital status - Separated (%)
Marital status - Widowed (%)
Marital status - Divorced (%)
Ancestries Reported - Arab (%)
Ancestries Reported - Czech (%)
Ancestries Reported - Danish (%)
Ancestries Reported - Dutch (%)
Ancestries Reported - English (%)
Ancestries Reported - French (%)
Ancestries Reported - French Canadian (%)
Ancestries Reported - German (%)
Ancestries Reported - Greek (%)
Ancestries Reported - Hungarian (%)
Ancestries Reported - Irish (%)
Ancestries Reported - Italian (%)
Ancestries Reported - Lithuanian (%)
Ancestries Reported - Norwegian (%)
Ancestries Reported - Polish (%)
Ancestries Reported - Portuguese (%)
Ancestries Reported - Russian (%)
Ancestries Reported - Scotch-Irish (%)
Ancestries Reported - Scottish (%)
Ancestries Reported - Slovak (%)
Ancestries Reported - Subsaharan African (%)
Ancestries Reported - Swedish (%)
Ancestries Reported - Swiss (%)
Ancestries Reported - Ukrainian (%)
Ancestries Reported - United States (%)
Ancestries Reported - Welsh (%)
Ancestries Reported - West Indian (%)
Ancestries Reported - Other (%)
Geographical mobility - Same house 1 year ago (%)
Geographical mobility - Same house 1 year ago (%) - White
Geographical mobility - Same house 1 year ago (%) - Black or African American
Geographical mobility - Same house 1 year ago (%) - Asian
Geographical mobility - Same house 1 year ago (%) - Hispanic or Latino
Geographical mobility - Same house 1 year ago (%) - American Indian and Alaska Native
Geographical mobility - Same house 1 year ago (%) - Multirace
Geographical mobility - Same house 1 year ago (%) - Other Race
Geographical mobility - Moved within same county (%)
Geographical mobility - Moved within same county (%) - White
Geographical mobility - Moved within same county (%) - Black or African American
Geographical mobility - Moved within same county (%) - Asian
Geographical mobility - Moved within same county (%) - Hispanic or Latino
Geographical mobility - Moved within same county (%) - American Indian and Alaska Native
Geographical mobility - Moved within same county (%) - Multirace
Geographical mobility - Moved within same county (%) - Other Race
Geographical mobility - Moved from different county within same state (%)
Geographical mobility - Moved from different county within same state (%) - White
Geographical mobility - Moved from different county within same state (%) - Black or African American
Geographical mobility - Moved from different county within same state (%) - Asian
Geographical mobility - Moved from different county within same state (%) - Hispanic or Latino
Geographical mobility - Moved from different county within same state (%) - American Indian and Alaska Native
Geographical mobility - Moved from different county within same state (%) - Multirace
Geographical mobility - Moved from different county within same state (%) - Other Race
Geographical mobility - Moved from different state (%)
Geographical mobility - Moved from different state (%) - White
Geographical mobility - Moved from different state (%) - Black or African American
Geographical mobility - Moved from different state (%) - Asian
Geographical mobility - Moved from different state (%) - Hispanic or Latino
Geographical mobility - Moved from different state (%) - American Indian and Alaska Native
Geographical mobility - Moved from different state (%) - Multirace
Geographical mobility - Moved from different state (%) - Other Race
Geographical mobility - Moved from abroad (%)
Geographical mobility - Moved from abroad (%) - White
Geographical mobility - Moved from abroad (%) - Black or African American
Geographical mobility - Moved from abroad (%) - Asian
Geographical mobility - Moved from abroad (%) - Hispanic or Latino
Geographical mobility - Moved from abroad (%) - American Indian and Alaska Native
Geographical mobility - Moved from abroad (%) - Multirace
Geographical mobility - Moved from abroad (%) - Other Race
Place of birth for the foreign-born population - Ireland (%)
Place of birth for the foreign-born population - Denmark (%)
Place of birth for the foreign-born population - Norway (%)
Place of birth for the foreign-born population - Sweden (%)
Place of birth for the foreign-born population - United Kingdom (%)
Place of birth for the foreign-born population - England (%)
Place of birth for the foreign-born population - Scotland (%)
Place of birth for the foreign-born population - Other Northern Europe (%)
Place of birth for the foreign-born population - Austria (%)
Place of birth for the foreign-born population - Belgium (%)
Place of birth for the foreign-born population - France (%)
Place of birth for the foreign-born population - Germany (%)
Place of birth for the foreign-born population - Netherlands (%)
Place of birth for the foreign-born population - Switzerland (%)
Place of birth for the foreign-born population - Other Western Europe (%)
Place of birth for the foreign-born population - Greece (%)
Place of birth for the foreign-born population - Italy (%)
Place of birth for the foreign-born population - Portugal (%)
Place of birth for the foreign-born population - Spain (%)
Place of birth for the foreign-born population - Other Southern Europe (%)
Place of birth for the foreign-born population - Albania (%)
Place of birth for the foreign-born population - Belarus (%)
Place of birth for the foreign-born population - Bosnia and Herzegovina (%)
Place of birth for the foreign-born population - Bulgaria (%)
Place of birth for the foreign-born population - Croatia (%)
Place of birth for the foreign-born population - Czechoslovakia (%)
Place of birth for the foreign-born population - Hungary (%)
Place of birth for the foreign-born population - Latvia (%)
Place of birth for the foreign-born population - Lithuania (%)
Place of birth for the foreign-born population - North Macedonia (Macedonia) (%)
Place of birth for the foreign-born population - Moldova (%)
Place of birth for the foreign-born population - Poland (%)
Place of birth for the foreign-born population - Romania (%)
Place of birth for the foreign-born population - Russia (%)
Place of birth for the foreign-born population - Serbia (%)
Place of birth for the foreign-born population - Ukraine (%)
Place of birth for the foreign-born population - Other Eastern Europe (%)
Place of birth for the foreign-born population - China (%)
Place of birth for the foreign-born population - Hong Kong (%)
Place of birth for the foreign-born population - Taiwan (%)
Place of birth for the foreign-born population - Japan (%)
Place of birth for the foreign-born population - Korea (%)
Place of birth for the foreign-born population - Other Eastern Asia (%)
Place of birth for the foreign-born population - Afghanistan (%)
Place of birth for the foreign-born population - Bangladesh (%)
Place of birth for the foreign-born population - India (%)
Place of birth for the foreign-born population - Iran (%)
Place of birth for the foreign-born population - Kazakhstan (%)
Place of birth for the foreign-born population - Nepal (%)
Place of birth for the foreign-born population - Pakistan (%)
Place of birth for the foreign-born population - Sri Lanka (%)
Place of birth for the foreign-born population - Uzbekistan (%)
Place of birth for the foreign-born population - Other South Central Asia (%)
Place of birth for the foreign-born population - Burma (%)
Place of birth for the foreign-born population - Cambodia (%)
Place of birth for the foreign-born population - Indonesia (%)
Place of birth for the foreign-born population - Laos (%)
Place of birth for the foreign-born population - Malaysia (%)
Place of birth for the foreign-born population - Philippines (%)
Place of birth for the foreign-born population - Singapore (%)
Place of birth for the foreign-born population - Thailand (%)
Place of birth for the foreign-born population - Vietnam (%)
Place of birth for the foreign-born population - Other South Eastern Asia (%)
Place of birth for the foreign-born population - Armenia (%)
Place of birth for the foreign-born population - Iraq (%)
Place of birth for the foreign-born population - Israel (%)
Place of birth for the foreign-born population - Jordan (%)
Place of birth for the foreign-born population - Kuwait (%)
Place of birth for the foreign-born population - Lebanon (%)
Place of birth for the foreign-born population - Saudi Arabia (%)
Place of birth for the foreign-born population - Syria (%)
Place of birth for the foreign-born population - Turkey (%)
Place of birth for the foreign-born population - Yemen (%)
Place of birth for the foreign-born population - Other Western Asia (%)
Place of birth for the foreign-born population - Eritrea (%)
Place of birth for the foreign-born population - Ethiopia (%)
Place of birth for the foreign-born population - Kenya (%)
Place of birth for the foreign-born population - Somalia (%)
Place of birth for the foreign-born population - Uganda (%)
Place of birth for the foreign-born population - Zimbabwe (%)
Place of birth for the foreign-born population - Other Eastern Africa (%)
Place of birth for the foreign-born population - Cameroon (%)
Place of birth for the foreign-born population - Congo (%)
Place of birth for the foreign-born population - Democratic Republic of Congo (Zaire) (%)
Place of birth for the foreign-born population - Other Middle Africa (%)
Place of birth for the foreign-born population - Egypt (%)
Place of birth for the foreign-born population - Morocco (%)
Place of birth for the foreign-born population - Sudan (%)
Place of birth for the foreign-born population - Other Northern Africa (%)
Place of birth for the foreign-born population - South Africa (%)
Place of birth for the foreign-born population - Other Southern Africa (%)
Place of birth for the foreign-born population - Cabo Verde (%)
Place of birth for the foreign-born population - Ghana (%)
Place of birth for the foreign-born population - Liberia (%)
Place of birth for the foreign-born population - Nigeria (%)
Place of birth for the foreign-born population - Senegal (%)
Place of birth for the foreign-born population - Sierra Leone (%)
Place of birth for the foreign-born population - Other Western Africa (%)
Place of birth for the foreign-born population - Australia (%)
Place of birth for the foreign-born population - New Zealand (%)
Place of birth for the foreign-born population - Fiji (%)
Place of birth for the foreign-born population - Micronesia (%)
Place of birth for the foreign-born population - Bahamas (%)
Place of birth for the foreign-born population - Barbados (%)
Place of birth for the foreign-born population - Cuba (%)
Place of birth for the foreign-born population - Dominica (%)
Place of birth for the foreign-born population - Dominican Republic (%)
Place of birth for the foreign-born population - Grenada (%)
Place of birth for the foreign-born population - Haiti (%)
Place of birth for the foreign-born population - Jamaica (%)
Place of birth for the foreign-born population - St. Vincent and the Grenadines (%)
Place of birth for the foreign-born population - Trinidad and Tobago (%)
Place of birth for the foreign-born population - West Indies (%)
Place of birth for the foreign-born population - Other Caribbean (%)
Place of birth for the foreign-born population - Belize (%)
Place of birth for the foreign-born population - Costa Rica (%)
Place of birth for the foreign-born population - El Salvador (%)
Place of birth for the foreign-born population - Guatemala (%)
Place of birth for the foreign-born population - Honduras (%)
Place of birth for the foreign-born population - Mexico (%)
Place of birth for the foreign-born population - Nicaragua (%)
Place of birth for the foreign-born population - Panama (%)
Place of birth for the foreign-born population - Other Central America (%)
Place of birth for the foreign-born population - Argentina (%)
Place of birth for the foreign-born population - Bolivia (%)
Place of birth for the foreign-born population - Brazil (%)
Place of birth for the foreign-born population - Chile (%)
Place of birth for the foreign-born population - Colombia (%)
Place of birth for the foreign-born population - Ecuador (%)
Place of birth for the foreign-born population - Guyana (%)
Place of birth for the foreign-born population - Peru (%)
Place of birth for the foreign-born population - Uruguay (%)
Place of birth for the foreign-born population - Venezuela (%)
Place of birth for the foreign-born population - Other South America (%)
Place of birth for the foreign-born population - Canada (%)
Place of birth for the foreign-born population - Other Northern America (%)
Place of birth for the foreign-born population - Other (%)
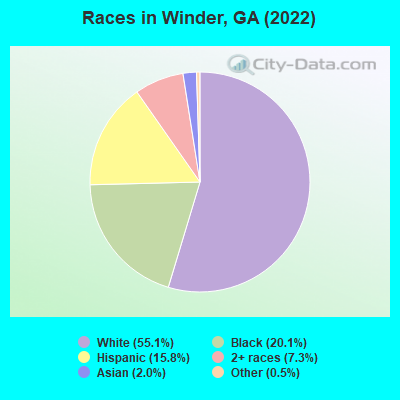
According to 2022 data, the most numerous races in Winder, GA are White alone (10,332 residents), Black alone (3,768 residents), and Hispanic (2,963 residents). 83.4% of Winder residents speak English at home. 8.9% of Winder, GA residents are foreign-born (6.2% born in Latin America, 1.2% born in Asia, 1.0% born in Africa), which is 12.4% less than the foreign-born rate of 10.0% across the entire state of Georgia.
Race distribution in Winder
2000 2022
5,128,661 62.6% White alone 2,331,465 28.5% Black alone 435,227 5.3% Hispanic 171,513 2.1% Asian alone 87,364 1.1% Two or more races 17,670 0.2% American Indian alone 11,275 0.1% Other race alone 3,278 0.04% Native Hawaiian and Other
5,415,657 49.6% White alone 3,349,240 30.7% Black alone 1,132,604 10.4% Hispanic 479,156 4.4% Asian alone 462,923 4.2% Two or more races 54,416 0.5% Other race alone 11,923 0.1% American Indian alone 6,957 0.06% Native Hawaiian and Other
Income and house value in Winder Median household income in 2022 $57,145 White non-Hispanic householders$84,966 Black householders$81,266 Asian householders$46,799 Some other race householders$54,867 Two or more races householders$44,218 Hispanic or Latino race householdersMedian 2022 house value $337,636 White Non-Hispanic householders$253,314 Black or African American householders$78,398 American Indian or Alaska Native householders $267,251 Asian householders$261,328 Two or more races householders$351,922 Hispanic or Latino householders
Median age by race in Winder
39.3 Median age for White residents36.5 43.3 37.4 Median age for Black or African American residents38.7 38.2 24.8 Median age for American Indian / Alaska Native residents23.8 24.9 34.6 Median age for Asian residents27.7 42.7 -657,243,815.6 Median age for Native Hawaiian / Pacific Islander residents-693,227,090.9 -666,666,666.0 26.4 Median age for Other race residents18.3 21.7 31.2 Median age for Two or more races residents39.2 24.7 41.2 Median age for White alone residents37.8 45.1 26.2 Median age for Hispanic or Latino residents21.2 29.6
Owner/renter occupied households by race in Winder
House owners and renters - White residents 3,174 68.1% Owner occupied1,490 31.9% Renter occupiedHouse owners and renters - Black or African American residents 985 67.4% Owner occupied477 32.6% Renter occupiedHouse owners and renters - American Indian / Alaska Native residents 54 100.0% Owner occupiedHouse owners and renters - Asian residents 147 80.9% Owner occupied35 19.1% Renter occupiedHouse owners and renters - Other race residents 204 74.2% Owner occupied71 25.8% Renter occupiedHouse owners and renters - Two or more races residents 448 60.5% Owner occupied292 39.5% Renter occupiedHouse owners and renters - White alone residents 3,002 67.9% Owner occupied1,422 32.1% Renter occupiedHouse owners and renters - Hispanic or Latino residents 726 80.5% Owner occupied176 19.5% Renter occupied
Language usage in Winder
English speakers - Total 83.4% of residents of Winder speak English at home.
13.2% of residents speak Spanish at home 1,162 48.4% Speak English very well1,239 51.6% Speak English less than very well3.6% of residents speak other language at home 529 80.2% Speak English very well131 19.8% Speak English less than very well
English speakers - Born in the United States 89.4% of residents of Winder speak English at home.
7.5% of residents speak Spanish at home 459 97.0% Speak English very well14 3.0% Speak English less than very well3.1% of residents speak other language at home 195 100.0% Speak English very well
English speakers - Native, born elsewhere 47.5% of residents of Winder speak English at home.
49.2% of residents speak Spanish at home 152 59.8% Speak English very well102 40.2% Speak English less than very well5.0% of residents speak other language at home 26 100.0% Speak English less than very well
English speakers - Foreign-born 28.8% of residents of Winder speak English at home.
56.2% of residents speak Spanish at home 206 19.3% Speak English very well860 80.7% Speak English less than very well16.7% of residents speak other language at home 240 75.9% Speak English very well76 24.1% Speak English less than very well
White (Caucasian) - Speak only English Native:
94.3% (9,835)Foreign-born:
43.2% (86)
White (Caucasian) - Speak another language Native:
4.3% (446)Foreign-born:
83.9% (168)
Black or African American - Speak only English Native:
98.1% (3,065)Foreign-born:
76.2% (387)
Black or African American - Speak another language Native:
1.8% (56)Foreign-born:
22.5% (114)
American Indian / Alaska Native - Speak another language Native:
100.0% (78)Foreign-born:
100.0% (38)
Asian - Speak only English Native:
37.3% (96)Foreign-born:
8.5% (12)
Asian - Speak another language Native:
59.1% (153)Foreign-born:
100.0% (142)
Other race - Speak only English Native:
34.2% (313)Foreign-born:
10.1% (61)
Other race - Speak another language Native:
65.7% (601)Foreign-born:
91.4% (550)
Two or more races - Speak another language Native:
18.9% (312)Foreign-born:
100.0% (459)
White alone - Speak only English Native:
96.6% (9,326)Foreign-born:
46.7% (66)
White alone - Speak another language Native:
3.3% (323)Foreign-born:
53.3% (75)
Hispanic or Latino - Speak only English Native:
36.8% (776)Foreign-born:
6.7% (72)
Hispanic or Latino - Speak another language Native:
58.4% (1,230)Foreign-born:
97.5% (1,042)
Foreign-born residents in Winder 1,733 residents are foreign born (6.2% Latin America , 1.2% Asia , 1.0% Africa ).
This city:
8.9%Georgia:
10.4%
Marital status for residents in Winder Marital status - White (Caucasian) population 15 years and over
Males 30.3% Never married54.8% Now married1.1% Separated4.7% Widowed9.2% DivorcedFemales 19.4% Never married44.3% Now married2.7% Separated11.6% Widowed22.0% DivorcedWomen who gave birth in the past 12 months Now married:
64.2% (50)Unmarried:
35.8% (28)
Women who did not give birth in the past 12 months Now married:
41.1% (970)Unmarried:
58.9% (1,390)
Marital status - Black or African American population 15 years and over
Males 41.0% Never married42.3% Now married1.2% Separated3.1% Widowed12.5% DivorcedFemales 33.4% Never married39.7% Now married5.5% Separated4.8% Widowed16.6% DivorcedWomen who gave birth in the past 12 months Now married:
100.0% (64)Unmarried:
0.0% (0)
Women who did not give birth in the past 12 months Now married:
45.5% (373)Unmarried:
54.5% (447)
Marital status - American Indian / Alaska Native population 15 years and over
Males 75.6% Never married24.4% Now married0.0% Separated0.0% Widowed0.0% DivorcedFemales 0.0% Never married100.0% Now married0.0% Separated0.0% Widowed0.0% DivorcedWomen who did not give birth in the past 12 months Now married:
100.0% (67)Unmarried:
0.0% (0)
Marital status - Asian population 15 years and over
Males 28.2% Never married40.9% Now married5.4% Separated0.0% Widowed25.5% DivorcedFemales 49.7% Never married48.2% Now married0.0% Separated0.0% Widowed2.1% DivorcedWomen who did not give birth in the past 12 months Now married:
47.6% (91)Unmarried:
52.4% (100)
Marital status - Other race population 15 years and over
Males 66.7% Never married33.3% Now married0.0% Separated0.0% Widowed0.0% DivorcedFemales 46.8% Never married25.6% Now married1.7% Separated1.9% Widowed24.0% DivorcedWomen who did not give birth in the past 12 months Now married:
26.4% (175)Unmarried:
73.6% (486)
Marital status - Two or more races population 15 years and over
Males 49.3% Never married32.3% Now married0.0% Separated3.2% Widowed15.3% DivorcedFemales 46.3% Never married37.6% Now married4.3% Separated0.1% Widowed11.5% DivorcedWomen who gave birth in the past 12 months Now married:
0.0% (0)Unmarried:
100.0% (31)
Women who did not give birth in the past 12 months Now married:
46.3% (367)Unmarried:
53.7% (426)
Marital status - White alone, not Hispanic / Latino population 15 years and over
Males 26.5% Never married57.7% Now married1.2% Separated4.8% Widowed9.8% DivorcedFemales 18.8% Never married45.3% Now married2.8% Separated11.2% Widowed21.8% DivorcedWomen who gave birth in the past 12 months Now married:
64.2% (52)Unmarried:
35.8% (29)
Women who did not give birth in the past 12 months Now married:
42.2% (954)Unmarried:
57.8% (1,304)
Marital status - Hispanic or Latino population 15 years and over
Males 59.1% Never married34.2% Now married0.0% Separated1.1% Widowed5.6% DivorcedFemales 35.5% Never married33.2% Now married2.9% Separated5.9% Widowed22.6% DivorcedWomen who did not give birth in the past 12 months Now married:
37.6% (350)Unmarried:
62.4% (581)
Ancestries in Winder
949 11.7% English882 10.9% American658 8.1% Irish299 3.7% German206 2.5% European189 2.3% Trinidadian and Tobagonian173 2.1% Italian165 2.0% Scottish120 1.5% Ukrainian109 1.3% West Indian88 1.1% French88 1.1% Scotch-Irish69 0.8% Jamaican66 0.8% Nigerian46 0.6% Polish38 0.5% African25 0.3% French Canadian24 0.3% Welsh18 0.2% British15 0.2% Norwegian14 0.2% Danish13 0.2% Latvian9 0.1% Czech8 0.10% Dutch8 0.10% Scandinavian4 0.05% Guyanese3 0.04% Pennsylvania German
Geographical mobility in Winder Same house 1 year ago 9,399 84.9% White (Caucasian)3,206 85.6% Black or African American79 63.6% American Indian / Alaska Native293 73.2% Asian940 76.9% Other race2,314 83.4% Two or more races9,177 88.0% White alone, not Hispanic / Latino2,533 74.7% Hispanic or LatinoMoved within same county 609 5.5% White / Caucasian44 1.2% Black or African American13 1.0% Other race33 1.2% Two or more races246 2.4% White alone, not Hispanic / Latino473 13.9% Hispanic or LatinoMoved within same state 934 8.4% White / Caucasian482 12.9% Black or African American56 45.0% American Indian / Alaska Native109 27.3% Asian119 9.7% Other race445 16.0% Two or more races881 8.4% White alone, not Hispanic / Latino295 8.7% Hispanic or LatinoMoved from different state 59 0.5% White / Caucasian10 0.3% Black or African American141 11.5% Other race42 0.4% White alone, not Hispanic / Latino70 2.1% Hispanic or LatinoMoved from abroad 22 0.2% White9 0.2% Black or African American11 0.1% White alone, not Hispanic / Latino21 0.6% Hispanic or Latino
Children Nativity (place of birth) in Winder
Children under 6 years - Living with two parents Both parents native 523 100.0% NativeBoth parents foreign-born 110 100.0% NativeOne native, one foreign-born parent 107 100.0% NativeChildren under 6 years - Living with one parent Native parent 592 100.0% NativeForeign-born parent 67 100.0% NativeChildren 6 to 17 years - Living with two parents Both parents native 955 100.0% NativeBoth parents foreign-born 456 98.6% Native6 1.4% Foreign-bornOne native, one foreign-born parent 136 95.5% Native6 4.5% Foreign-bornChildren 6 to 17 years - Living with one parent Native parent 1,159 100.0% NativeForeign-born parent 192 50.3% Native190 49.7% Foreign-born
Grandparents responsible for own grandchildren in Winder
Grandparents (30 to 59 years) White / Caucasian 84 62.4% Responsible for grandchildren51 37.6% Not responsible for grandchildrenBlack or African American 25 29.7% Responsible for grandchildren59 70.3% Not responsible for grandchildrenAmerican Indian / Alaska Native 5 100.0% Not responsible for grandchildrenTwo or more races 51 100.0% Not responsible for grandchildrenWhite alone, not Hispanic / Latino 69 56.1% Responsible for grandchildren54 43.9% Not responsible for grandchildrenHispanic or Latino 15 76.3% Responsible for grandchildren5 23.7% Not responsible for grandchildrenGrandparents (60 years and over) White / Caucasian 71 32.1% Responsible for grandchildren150 67.9% Not responsible for grandchildrenBlack or African American 7 29.9% Responsible for grandchildren16 70.1% Not responsible for grandchildrenWhite alone, not Hispanic / Latino 72 32.1% Responsible for grandchildren152 67.9% Not responsible for grandchildrenHispanic or Latino 21 100.0% Not responsible for grandchildren