Races in Wilsonville, Oregon (OR) Detailed Stats
Data:
Races - White alone (%)
Races - White alone (% change since 2000)
Races - Black alone (%)
Races - Black alone (% change since 2000)
Races - American Indian alone (%)
Races - American Indian alone (% change since 2000)
Races - Asian alone (%)
Races - Asian alone (% change since 2000)
Races - Hispanic (%)
Races - Hispanic (% change since 2000)
Races - Native Hawaiian and Other Pacific Islander alone (%)
Races - Native Hawaiian and Other Pacific Islander alone (% change since 2000)
Races - Two or more races(%)
Races - Two or more races(% change since 2000)
Races - Other race alone (%)
Races - Other race alone (% change since 2000)
Racial diversity
Place of birth - Born in state of residence (%)
Place of birth - Born in state of residence (%) - White
Place of birth - Born in state of residence (%) - Black or African American
Place of birth - Born in state of residence (%) - Asian
Place of birth - Born in state of residence (%) - Hispanic or Latino
Place of birth - Born in state of residence (%) - American Indian and Alaska Native
Place of birth - Born in state of residence (%) - Multirace
Place of birth - Born in state of residence (%) - Other Race
Place of birth - Born in other state (%)
Place of birth - Born in other state (%) - White
Place of birth - Born in other state (%) - Black or African American
Place of birth - Born in other state (%) - Asian
Place of birth - Born in other state (%) - Hispanic or Latino
Place of birth - Born in other state (%) - American Indian and Alaska Native
Place of birth - Born in other state (%) - Multirace
Place of birth - Born in other state (%) - Other Race
Place of birth - Native, outside of US (%)
Place of birth - Native, outside of US (%) - White
Place of birth - Native, outside of US (%) - Black or African American
Place of birth - Native, outside of US (%) - Asian
Place of birth - Native, outside of US (%) - Hispanic or Latino
Place of birth - Native, outside of US (%) - American Indian and Alaska Native
Place of birth - Native, outside of US (%) - Multirace
Place of birth - Native, outside of US (%) - Other Race
Place of birth - Foreign born (%)
Place of birth - Foreign born (%) - White
Place of birth - Foreign born (%) - Black or African American
Place of birth - Foreign born (%) - Asian
Place of birth - Foreign born (%) - Hispanic or Latino
Place of birth - Foreign born (%) - American Indian and Alaska Native
Place of birth - Foreign born (%) - Multirace
Place of birth - Foreign born (%) - Other Race
Residents speaking English at home (%)
Residents speaking English at home - Born in the United States (%)
Residents speaking English at home - Native, born elsewhere (%)
Residents speaking English at home - Foreign born (%)
Residents speaking Spanish at home (%)
Residents speaking Spanish at home - Born in the United States (%)
Residents speaking Spanish at home - Native, born elsewhere (%)
Residents speaking Spanish at home - Foreign born (%)
Residents speaking other language at home (%)
Residents speaking other language at home - Born in the United States (%)
Residents speaking other language at home - Native, born elsewhere (%)
Residents speaking other language at home - Foreign born (%)
Marital status - Never married (%)
Marital status - Now married (%)
Marital status - Separated (%)
Marital status - Widowed (%)
Marital status - Divorced (%)
Ancestries Reported - Arab (%)
Ancestries Reported - Czech (%)
Ancestries Reported - Danish (%)
Ancestries Reported - Dutch (%)
Ancestries Reported - English (%)
Ancestries Reported - French (%)
Ancestries Reported - French Canadian (%)
Ancestries Reported - German (%)
Ancestries Reported - Greek (%)
Ancestries Reported - Hungarian (%)
Ancestries Reported - Irish (%)
Ancestries Reported - Italian (%)
Ancestries Reported - Lithuanian (%)
Ancestries Reported - Norwegian (%)
Ancestries Reported - Polish (%)
Ancestries Reported - Portuguese (%)
Ancestries Reported - Russian (%)
Ancestries Reported - Scotch-Irish (%)
Ancestries Reported - Scottish (%)
Ancestries Reported - Slovak (%)
Ancestries Reported - Subsaharan African (%)
Ancestries Reported - Swedish (%)
Ancestries Reported - Swiss (%)
Ancestries Reported - Ukrainian (%)
Ancestries Reported - United States (%)
Ancestries Reported - Welsh (%)
Ancestries Reported - West Indian (%)
Ancestries Reported - Other (%)
Geographical mobility - Same house 1 year ago (%)
Geographical mobility - Same house 1 year ago (%) - White
Geographical mobility - Same house 1 year ago (%) - Black or African American
Geographical mobility - Same house 1 year ago (%) - Asian
Geographical mobility - Same house 1 year ago (%) - Hispanic or Latino
Geographical mobility - Same house 1 year ago (%) - American Indian and Alaska Native
Geographical mobility - Same house 1 year ago (%) - Multirace
Geographical mobility - Same house 1 year ago (%) - Other Race
Geographical mobility - Moved within same county (%)
Geographical mobility - Moved within same county (%) - White
Geographical mobility - Moved within same county (%) - Black or African American
Geographical mobility - Moved within same county (%) - Asian
Geographical mobility - Moved within same county (%) - Hispanic or Latino
Geographical mobility - Moved within same county (%) - American Indian and Alaska Native
Geographical mobility - Moved within same county (%) - Multirace
Geographical mobility - Moved within same county (%) - Other Race
Geographical mobility - Moved from different county within same state (%)
Geographical mobility - Moved from different county within same state (%) - White
Geographical mobility - Moved from different county within same state (%) - Black or African American
Geographical mobility - Moved from different county within same state (%) - Asian
Geographical mobility - Moved from different county within same state (%) - Hispanic or Latino
Geographical mobility - Moved from different county within same state (%) - American Indian and Alaska Native
Geographical mobility - Moved from different county within same state (%) - Multirace
Geographical mobility - Moved from different county within same state (%) - Other Race
Geographical mobility - Moved from different state (%)
Geographical mobility - Moved from different state (%) - White
Geographical mobility - Moved from different state (%) - Black or African American
Geographical mobility - Moved from different state (%) - Asian
Geographical mobility - Moved from different state (%) - Hispanic or Latino
Geographical mobility - Moved from different state (%) - American Indian and Alaska Native
Geographical mobility - Moved from different state (%) - Multirace
Geographical mobility - Moved from different state (%) - Other Race
Geographical mobility - Moved from abroad (%)
Geographical mobility - Moved from abroad (%) - White
Geographical mobility - Moved from abroad (%) - Black or African American
Geographical mobility - Moved from abroad (%) - Asian
Geographical mobility - Moved from abroad (%) - Hispanic or Latino
Geographical mobility - Moved from abroad (%) - American Indian and Alaska Native
Geographical mobility - Moved from abroad (%) - Multirace
Geographical mobility - Moved from abroad (%) - Other Race
Place of birth for the foreign-born population - Ireland (%)
Place of birth for the foreign-born population - Denmark (%)
Place of birth for the foreign-born population - Norway (%)
Place of birth for the foreign-born population - Sweden (%)
Place of birth for the foreign-born population - United Kingdom (%)
Place of birth for the foreign-born population - England (%)
Place of birth for the foreign-born population - Scotland (%)
Place of birth for the foreign-born population - Other Northern Europe (%)
Place of birth for the foreign-born population - Austria (%)
Place of birth for the foreign-born population - Belgium (%)
Place of birth for the foreign-born population - France (%)
Place of birth for the foreign-born population - Germany (%)
Place of birth for the foreign-born population - Netherlands (%)
Place of birth for the foreign-born population - Switzerland (%)
Place of birth for the foreign-born population - Other Western Europe (%)
Place of birth for the foreign-born population - Greece (%)
Place of birth for the foreign-born population - Italy (%)
Place of birth for the foreign-born population - Portugal (%)
Place of birth for the foreign-born population - Spain (%)
Place of birth for the foreign-born population - Other Southern Europe (%)
Place of birth for the foreign-born population - Albania (%)
Place of birth for the foreign-born population - Belarus (%)
Place of birth for the foreign-born population - Bosnia and Herzegovina (%)
Place of birth for the foreign-born population - Bulgaria (%)
Place of birth for the foreign-born population - Croatia (%)
Place of birth for the foreign-born population - Czechoslovakia (%)
Place of birth for the foreign-born population - Hungary (%)
Place of birth for the foreign-born population - Latvia (%)
Place of birth for the foreign-born population - Lithuania (%)
Place of birth for the foreign-born population - North Macedonia (Macedonia) (%)
Place of birth for the foreign-born population - Moldova (%)
Place of birth for the foreign-born population - Poland (%)
Place of birth for the foreign-born population - Romania (%)
Place of birth for the foreign-born population - Russia (%)
Place of birth for the foreign-born population - Serbia (%)
Place of birth for the foreign-born population - Ukraine (%)
Place of birth for the foreign-born population - Other Eastern Europe (%)
Place of birth for the foreign-born population - China (%)
Place of birth for the foreign-born population - Hong Kong (%)
Place of birth for the foreign-born population - Taiwan (%)
Place of birth for the foreign-born population - Japan (%)
Place of birth for the foreign-born population - Korea (%)
Place of birth for the foreign-born population - Other Eastern Asia (%)
Place of birth for the foreign-born population - Afghanistan (%)
Place of birth for the foreign-born population - Bangladesh (%)
Place of birth for the foreign-born population - India (%)
Place of birth for the foreign-born population - Iran (%)
Place of birth for the foreign-born population - Kazakhstan (%)
Place of birth for the foreign-born population - Nepal (%)
Place of birth for the foreign-born population - Pakistan (%)
Place of birth for the foreign-born population - Sri Lanka (%)
Place of birth for the foreign-born population - Uzbekistan (%)
Place of birth for the foreign-born population - Other South Central Asia (%)
Place of birth for the foreign-born population - Burma (%)
Place of birth for the foreign-born population - Cambodia (%)
Place of birth for the foreign-born population - Indonesia (%)
Place of birth for the foreign-born population - Laos (%)
Place of birth for the foreign-born population - Malaysia (%)
Place of birth for the foreign-born population - Philippines (%)
Place of birth for the foreign-born population - Singapore (%)
Place of birth for the foreign-born population - Thailand (%)
Place of birth for the foreign-born population - Vietnam (%)
Place of birth for the foreign-born population - Other South Eastern Asia (%)
Place of birth for the foreign-born population - Armenia (%)
Place of birth for the foreign-born population - Iraq (%)
Place of birth for the foreign-born population - Israel (%)
Place of birth for the foreign-born population - Jordan (%)
Place of birth for the foreign-born population - Kuwait (%)
Place of birth for the foreign-born population - Lebanon (%)
Place of birth for the foreign-born population - Saudi Arabia (%)
Place of birth for the foreign-born population - Syria (%)
Place of birth for the foreign-born population - Turkey (%)
Place of birth for the foreign-born population - Yemen (%)
Place of birth for the foreign-born population - Other Western Asia (%)
Place of birth for the foreign-born population - Eritrea (%)
Place of birth for the foreign-born population - Ethiopia (%)
Place of birth for the foreign-born population - Kenya (%)
Place of birth for the foreign-born population - Somalia (%)
Place of birth for the foreign-born population - Uganda (%)
Place of birth for the foreign-born population - Zimbabwe (%)
Place of birth for the foreign-born population - Other Eastern Africa (%)
Place of birth for the foreign-born population - Cameroon (%)
Place of birth for the foreign-born population - Congo (%)
Place of birth for the foreign-born population - Democratic Republic of Congo (Zaire) (%)
Place of birth for the foreign-born population - Other Middle Africa (%)
Place of birth for the foreign-born population - Egypt (%)
Place of birth for the foreign-born population - Morocco (%)
Place of birth for the foreign-born population - Sudan (%)
Place of birth for the foreign-born population - Other Northern Africa (%)
Place of birth for the foreign-born population - South Africa (%)
Place of birth for the foreign-born population - Other Southern Africa (%)
Place of birth for the foreign-born population - Cabo Verde (%)
Place of birth for the foreign-born population - Ghana (%)
Place of birth for the foreign-born population - Liberia (%)
Place of birth for the foreign-born population - Nigeria (%)
Place of birth for the foreign-born population - Senegal (%)
Place of birth for the foreign-born population - Sierra Leone (%)
Place of birth for the foreign-born population - Other Western Africa (%)
Place of birth for the foreign-born population - Australia (%)
Place of birth for the foreign-born population - New Zealand (%)
Place of birth for the foreign-born population - Fiji (%)
Place of birth for the foreign-born population - Micronesia (%)
Place of birth for the foreign-born population - Bahamas (%)
Place of birth for the foreign-born population - Barbados (%)
Place of birth for the foreign-born population - Cuba (%)
Place of birth for the foreign-born population - Dominica (%)
Place of birth for the foreign-born population - Dominican Republic (%)
Place of birth for the foreign-born population - Grenada (%)
Place of birth for the foreign-born population - Haiti (%)
Place of birth for the foreign-born population - Jamaica (%)
Place of birth for the foreign-born population - St. Vincent and the Grenadines (%)
Place of birth for the foreign-born population - Trinidad and Tobago (%)
Place of birth for the foreign-born population - West Indies (%)
Place of birth for the foreign-born population - Other Caribbean (%)
Place of birth for the foreign-born population - Belize (%)
Place of birth for the foreign-born population - Costa Rica (%)
Place of birth for the foreign-born population - El Salvador (%)
Place of birth for the foreign-born population - Guatemala (%)
Place of birth for the foreign-born population - Honduras (%)
Place of birth for the foreign-born population - Mexico (%)
Place of birth for the foreign-born population - Nicaragua (%)
Place of birth for the foreign-born population - Panama (%)
Place of birth for the foreign-born population - Other Central America (%)
Place of birth for the foreign-born population - Argentina (%)
Place of birth for the foreign-born population - Bolivia (%)
Place of birth for the foreign-born population - Brazil (%)
Place of birth for the foreign-born population - Chile (%)
Place of birth for the foreign-born population - Colombia (%)
Place of birth for the foreign-born population - Ecuador (%)
Place of birth for the foreign-born population - Guyana (%)
Place of birth for the foreign-born population - Peru (%)
Place of birth for the foreign-born population - Uruguay (%)
Place of birth for the foreign-born population - Venezuela (%)
Place of birth for the foreign-born population - Other South America (%)
Place of birth for the foreign-born population - Canada (%)
Place of birth for the foreign-born population - Other Northern America (%)
Place of birth for the foreign-born population - Other (%)
Latest news about races in Wilsonville, OR collected exclusively by city-data.com from local newspapers, TV, and radio stations
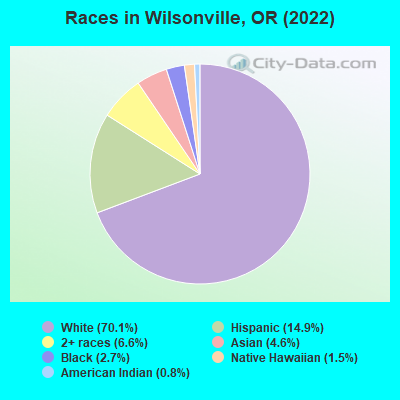
According to 2022 data, the most numerous races in Wilsonville, OR are White alone (18,308 residents), Hispanic (3,881 residents), and Two or more races (1,735 residents). 87.1% of Wilsonville residents speak English at home. 11.2% of Wilsonville, OR residents are foreign-born (5.0% born in Asia, 3.1% born in Latin America), which is 19.5% greater than the foreign-born rate of 9.0% across the entire state of Oregon.
Race distribution in Wilsonville
2000 2022
2,857,616 83.5% White alone 275,314 8.0% Hispanic 100,333 2.9% Asian alone 82,733 2.4% Two or more races 53,325 1.6% Black alone 40,130 1.2% American Indian alone 7,398 0.2% Native Hawaiian and Other 4,550 0.1% Other race alone
3,037,571 71.6% White alone 609,538 14.4% Hispanic 252,744 6.0% Two or more races 191,283 4.5% Asian alone 78,228 1.8% Black alone 29,399 0.7% American Indian alone 25,731 0.6% Other race alone 15,643 0.4% Native Hawaiian and Other
Income and house value in Wilsonville Median household income in 2022 $81,935 White non-Hispanic householders$53,945 Black householders$122,914 American Indian and Alaska Native householders$141,721 Asian householders$73,000 Some other race householders$115,288 Two or more races householders$82,695 Hispanic or Latino race householdersMedian 2022 house value $676,061 White Non-Hispanic householders$815,067 Black or African American householders$555,727 American Indian or Alaska Native householders $679,321 Asian householders$609,373 Some other race householders$765,570 Two or more races householders$444,582 Hispanic or Latino householders
Median age by race in Wilsonville
42.4 Median age for White residents39.1 44.8 30.4 Median age for Black or African American residents33.0 30.8 32.5 Median age for American Indian / Alaska Native residents24.4 36.6 40.4 Median age for Asian residents33.6 43.8 21.1 Median age for Native Hawaiian / Pacific Islander residents14.6 47.8 29.9 Median age for Other race residents25.5 32.0 29.8 Median age for Two or more races residents30.4 31.0 43.8 Median age for White alone residents40.7 46.9 31.6 Median age for Hispanic or Latino residents31.8 29.3
Owner/renter occupied households by race in Wilsonville
House owners and renters - White residents 4,677 52.4% Owner occupied4,252 47.6% Renter occupiedHouse owners and renters - Black or African American residents 94 49.2% Owner occupied98 50.8% Renter occupiedHouse owners and renters - American Indian / Alaska Native residents 87 73.6% Owner occupied31 26.4% Renter occupiedHouse owners and renters - Asian residents 256 69.4% Owner occupied113 30.6% Renter occupiedHouse owners and renters - Native Hawaiian / Pacific Islander residents 41 100.0% Renter occupiedHouse owners and renters - Other race residents 23 11.9% Owner occupied172 88.1% Renter occupiedHouse owners and renters - Two or more races residents 302 33.3% Owner occupied604 66.7% Renter occupiedHouse owners and renters - White alone residents 4,456 52.0% Owner occupied4,109 48.0% Renter occupiedHouse owners and renters - Hispanic or Latino residents 476 41.7% Owner occupied665 58.3% Renter occupied
Language usage in Wilsonville
English speakers - Total 87.1% of residents of Wilsonville speak English at home.
6.0% of residents speak Spanish at home 1,118 74.2% Speak English very well389 25.8% Speak English less than very well6.6% of residents speak other language at home 947 57.2% Speak English very well708 42.8% Speak English less than very well
English speakers - Born in the United States 94.3% of residents of Wilsonville speak English at home.
4.3% of residents speak Spanish at home 513 96.4% Speak English very well19 3.6% Speak English less than very well1.5% of residents speak other language at home 182 100.0% Speak English very well
English speakers - Native, born elsewhere 76.2% of residents of Wilsonville speak English at home.
6.3% of residents speak Spanish at home 26 100.0% Speak English less than very well10.0% of residents speak other language at home 21 51.2% Speak English very well20 48.8% Speak English less than very well
English speakers - Foreign-born 35.2% of residents of Wilsonville speak English at home.
16.9% of residents speak Spanish at home 112 24.7% Speak English very well341 75.3% Speak English less than very well50.9% of residents speak other language at home 589 43.2% Speak English very well774 56.8% Speak English less than very well
White (Caucasian) - Speak only English Native:
97.1% (17,338)Foreign-born:
56.9% (476)
White (Caucasian) - Speak another language Native:
2.9% (527)Foreign-born:
47.0% (393)
Black or African American - Speak only English Native:
99.5% (313)Foreign-born:
6.8% (9)
Asian - Speak only English Native:
99.1% (359)Foreign-born:
17.0% (127)
Asian - Speak another language Native:
5.2% (19)Foreign-born:
81.8% (613)
Native Hawaiian / Pacific Islander - Speak another language Native:
30.3% (37)Foreign-born:
96.9% (71)
Other race - Speak another language Native:
84.2% (305)Foreign-born:
89.1% (147)
Two or more races - Speak only English Native:
80.4% (2,446)Foreign-born:
50.9% (430)
Two or more races - Speak another language Native:
19.5% (594)Foreign-born:
54.2% (458)
White alone - Speak only English Native:
98.7% (16,594)Foreign-born:
51.9% (450)
White alone - Speak another language Native:
1.3% (214)Foreign-born:
48.9% (424)
Hispanic or Latino - Speak only English Native:
68.1% (2,117)Foreign-born:
61.5% (419)
Hispanic or Latino - Speak another language Native:
31.5% (979)Foreign-born:
58.4% (398)
Foreign-born residents in Wilsonville 2,923 residents are foreign born (5.0% Asia , 3.1% Latin America ).
This city:
11.2%Oregon:
9.8%
Marital status for residents in Wilsonville Marital status - White (Caucasian) population 15 years and over
Males 30.3% Never married56.4% Now married0.2% Separated2.1% Widowed11.0% DivorcedFemales 27.2% Never married44.5% Now married0.7% Separated11.0% Widowed16.6% DivorcedWomen who gave birth in the past 12 months Now married:
50.5% (100)Unmarried:
49.5% (98)
Women who did not give birth in the past 12 months Now married:
42.0% (1,913)Unmarried:
58.0% (2,637)
Marital status - Black or African American population 15 years and over
Males 36.5% Never married63.5% Now married0.0% Separated0.0% Widowed0.0% DivorcedFemales 52.7% Never married33.2% Now married0.0% Separated4.4% Widowed9.7% DivorcedWomen who gave birth in the past 12 months Now married:
0.0% (0)Unmarried:
100.0% (10)
Women who did not give birth in the past 12 months Now married:
21.5% (34)Unmarried:
78.5% (125)
Marital status - American Indian / Alaska Native population 15 years and over
Males 14.9% Never married85.1% Now married0.0% Separated0.0% Widowed0.0% DivorcedFemales 14.2% Never married49.3% Now married6.8% Separated8.1% Widowed21.6% DivorcedWomen who gave birth in the past 12 months Now married:
100.0% (15)Unmarried:
0.0% (0)
Women who did not give birth in the past 12 months Now married:
59.6% (68)Unmarried:
40.4% (46)
Marital status - Asian population 15 years and over
Males 46.7% Never married50.8% Now married0.0% Separated0.0% Widowed2.5% DivorcedFemales 6.2% Never married81.4% Now married0.0% Separated0.0% Widowed12.4% DivorcedWomen who gave birth in the past 12 months Now married:
100.0% (22)Unmarried:
0.0% (0)
Women who did not give birth in the past 12 months Now married:
74.2% (224)Unmarried:
25.8% (78)
Marital status - Native Hawaiian / Pacific Islander population 15 years and over
Males 55.6% Never married38.3% Now married0.0% Separated0.0% Widowed6.2% DivorcedFemales 0.0% Never married100.0% Now married0.0% Separated0.0% Widowed0.0% DivorcedWomen who gave birth in the past 12 months Now married:
100.0% (14)Unmarried:
0.0% (0)
Women who did not give birth in the past 12 months Now married:
100.0% (40)Unmarried:
0.0% (0)
Marital status - Other race population 15 years and over
Males 44.9% Never married55.1% Now married0.0% Separated0.0% Widowed0.0% DivorcedFemales 31.5% Never married63.1% Now married0.0% Separated0.0% Widowed5.4% DivorcedWomen who did not give birth in the past 12 months Now married:
49.4% (55)Unmarried:
50.6% (56)
Marital status - Two or more races population 15 years and over
Males 44.1% Never married45.3% Now married0.0% Separated0.0% Widowed10.6% DivorcedFemales 42.7% Never married43.1% Now married2.5% Separated2.3% Widowed9.3% DivorcedWomen who gave birth in the past 12 months Now married:
100.0% (6)Unmarried:
0.0% (0)
Women who did not give birth in the past 12 months Now married:
43.5% (499)Unmarried:
56.5% (649)
Marital status - White alone, not Hispanic / Latino population 15 years and over
Males 29.7% Never married56.4% Now married0.2% Separated2.3% Widowed11.5% DivorcedFemales 26.3% Never married44.9% Now married0.8% Separated11.7% Widowed16.4% DivorcedWomen who gave birth in the past 12 months Now married:
53.9% (101)Unmarried:
46.1% (87)
Women who did not give birth in the past 12 months Now married:
43.5% (1,849)Unmarried:
56.5% (2,397)
Marital status - Hispanic or Latino population 15 years and over
Males 40.8% Never married51.8% Now married0.0% Separated0.0% Widowed7.4% DivorcedFemales 40.9% Never married42.5% Now married2.3% Separated0.0% Widowed14.2% DivorcedWomen who gave birth in the past 12 months Now married:
18.5% (5)Unmarried:
81.5% (23)
Women who did not give birth in the past 12 months Now married:
36.7% (381)Unmarried:
63.3% (656)
Ancestries in Wilsonville
1,548 13.1% English1,158 9.8% German852 7.2% American848 7.2% Irish620 5.2% European379 3.2% Norwegian237 2.0% Italian211 1.8% Scandinavian174 1.5% Arab158 1.3% Dutch140 1.2% Scottish112 0.9% Swedish108 0.9% Polish98 0.8% French Canadian75 0.6% French73 0.6% Iranian68 0.6% Ukrainian59 0.5% Ethiopian57 0.5% Danish56 0.5% Czech55 0.5% British47 0.4% Russian28 0.2% Slovak23 0.2% Swiss21 0.2% Croatian21 0.2% Slavic20 0.2% Lithuanian20 0.2% Scotch-Irish19 0.2% Hungarian15 0.1% Finnish14 0.1% Lebanese11 0.09% Canadian11 0.09% New Zealander9 0.08% Eastern European8 0.07% Northern European8 0.07% Portuguese6 0.05% South African5 0.04% Romanian3 0.03% African
Geographical mobility in Wilsonville Same house 1 year ago 15,917 82.3% White (Caucasian)393 79.5% Black or African American246 98.7% American Indian / Alaska Native962 80.0% Asian85 37.4% Native Hawaiian / Pacific Islander594 100.0% Other race3,174 77.9% Two or more races14,911 81.8% White alone, not Hispanic / Latino3,410 88.4% Hispanic or LatinoMoved within same county 522 2.7% White / Caucasian20 4.1% Black or African American27 2.2% Asian115 50.6% Native Hawaiian / Pacific Islander167 4.1% Two or more races506 2.8% White alone, not Hispanic / Latino51 1.3% Hispanic or LatinoMoved within same state 2,911 15.1% White / Caucasian48 9.7% Black or African American13 5.2% American Indian / Alaska Native151 12.6% Asian7 3.3% Native Hawaiian / Pacific Islander9 1.5% Other race544 13.4% Two or more races2,890 15.9% White alone, not Hispanic / Latino390 10.1% Hispanic or LatinoMoved from different state 532 2.8% White / Caucasian29 5.8% Black or African American12 1.0% Asian143 3.5% Two or more races490 2.7% White alone, not Hispanic / Latino55 1.4% Hispanic or LatinoMoved from abroad 188 1.0% White17 0.4% Two or more races76 0.4% White alone, not Hispanic / Latino
Children Nativity (place of birth) in Wilsonville
Children under 6 years - Living with two parents Both parents native 871 100.0% NativeBoth parents foreign-born 105 89.0% Native13 11.0% Foreign-bornOne native, one foreign-born parent 268 100.0% NativeChildren under 6 years - Living with one parent Native parent 191 100.0% NativeForeign-born parent 34 100.0% NativeChildren 6 to 17 years - Living with two parents Both parents native 1,594 100.0% NativeBoth parents foreign-born 107 66.1% Native55 33.9% Foreign-bornOne native, one foreign-born parent 198 100.0% NativeChildren 6 to 17 years - Living with one parent Native parent 897 100.0% NativeForeign-born parent 123 50.0% Native123 50.0% Foreign-born
Grandparents responsible for own grandchildren in Wilsonville
Grandparents (30 to 59 years) White / Caucasian 10 26.9% Responsible for grandchildren26 73.1% Not responsible for grandchildrenAsian 25 100.0% Not responsible for grandchildrenWhite alone, not Hispanic / Latino 10 100.0% Responsible for grandchildrenHispanic or Latino 26 100.0% Not responsible for grandchildrenGrandparents (60 years and over) White / Caucasian 22 12.9% Responsible for grandchildren146 87.1% Not responsible for grandchildrenAsian 27 100.0% Not responsible for grandchildrenWhite alone, not Hispanic / Latino 22 12.3% Responsible for grandchildren155 87.7% Not responsible for grandchildren