Races in Wilson, Pennsylvania (PA) Detailed Stats
Data:
Races - White alone (%)
Races - White alone (% change since 2000)
Races - Black alone (%)
Races - Black alone (% change since 2000)
Races - American Indian alone (%)
Races - American Indian alone (% change since 2000)
Races - Asian alone (%)
Races - Asian alone (% change since 2000)
Races - Hispanic (%)
Races - Hispanic (% change since 2000)
Races - Native Hawaiian and Other Pacific Islander alone (%)
Races - Native Hawaiian and Other Pacific Islander alone (% change since 2000)
Races - Two or more races(%)
Races - Two or more races(% change since 2000)
Races - Other race alone (%)
Races - Other race alone (% change since 2000)
Racial diversity
Place of birth - Born in state of residence (%)
Place of birth - Born in state of residence (%) - White
Place of birth - Born in state of residence (%) - Black or African American
Place of birth - Born in state of residence (%) - Asian
Place of birth - Born in state of residence (%) - Hispanic or Latino
Place of birth - Born in state of residence (%) - American Indian and Alaska Native
Place of birth - Born in state of residence (%) - Multirace
Place of birth - Born in state of residence (%) - Other Race
Place of birth - Born in other state (%)
Place of birth - Born in other state (%) - White
Place of birth - Born in other state (%) - Black or African American
Place of birth - Born in other state (%) - Asian
Place of birth - Born in other state (%) - Hispanic or Latino
Place of birth - Born in other state (%) - American Indian and Alaska Native
Place of birth - Born in other state (%) - Multirace
Place of birth - Born in other state (%) - Other Race
Place of birth - Native, outside of US (%)
Place of birth - Native, outside of US (%) - White
Place of birth - Native, outside of US (%) - Black or African American
Place of birth - Native, outside of US (%) - Asian
Place of birth - Native, outside of US (%) - Hispanic or Latino
Place of birth - Native, outside of US (%) - American Indian and Alaska Native
Place of birth - Native, outside of US (%) - Multirace
Place of birth - Native, outside of US (%) - Other Race
Place of birth - Foreign born (%)
Place of birth - Foreign born (%) - White
Place of birth - Foreign born (%) - Black or African American
Place of birth - Foreign born (%) - Asian
Place of birth - Foreign born (%) - Hispanic or Latino
Place of birth - Foreign born (%) - American Indian and Alaska Native
Place of birth - Foreign born (%) - Multirace
Place of birth - Foreign born (%) - Other Race
Residents speaking English at home (%)
Residents speaking English at home - Born in the United States (%)
Residents speaking English at home - Native, born elsewhere (%)
Residents speaking English at home - Foreign born (%)
Residents speaking Spanish at home (%)
Residents speaking Spanish at home - Born in the United States (%)
Residents speaking Spanish at home - Native, born elsewhere (%)
Residents speaking Spanish at home - Foreign born (%)
Residents speaking other language at home (%)
Residents speaking other language at home - Born in the United States (%)
Residents speaking other language at home - Native, born elsewhere (%)
Residents speaking other language at home - Foreign born (%)
Marital status - Never married (%)
Marital status - Now married (%)
Marital status - Separated (%)
Marital status - Widowed (%)
Marital status - Divorced (%)
Ancestries Reported - Arab (%)
Ancestries Reported - Czech (%)
Ancestries Reported - Danish (%)
Ancestries Reported - Dutch (%)
Ancestries Reported - English (%)
Ancestries Reported - French (%)
Ancestries Reported - French Canadian (%)
Ancestries Reported - German (%)
Ancestries Reported - Greek (%)
Ancestries Reported - Hungarian (%)
Ancestries Reported - Irish (%)
Ancestries Reported - Italian (%)
Ancestries Reported - Lithuanian (%)
Ancestries Reported - Norwegian (%)
Ancestries Reported - Polish (%)
Ancestries Reported - Portuguese (%)
Ancestries Reported - Russian (%)
Ancestries Reported - Scotch-Irish (%)
Ancestries Reported - Scottish (%)
Ancestries Reported - Slovak (%)
Ancestries Reported - Subsaharan African (%)
Ancestries Reported - Swedish (%)
Ancestries Reported - Swiss (%)
Ancestries Reported - Ukrainian (%)
Ancestries Reported - United States (%)
Ancestries Reported - Welsh (%)
Ancestries Reported - West Indian (%)
Ancestries Reported - Other (%)
Geographical mobility - Same house 1 year ago (%)
Geographical mobility - Same house 1 year ago (%) - White
Geographical mobility - Same house 1 year ago (%) - Black or African American
Geographical mobility - Same house 1 year ago (%) - Asian
Geographical mobility - Same house 1 year ago (%) - Hispanic or Latino
Geographical mobility - Same house 1 year ago (%) - American Indian and Alaska Native
Geographical mobility - Same house 1 year ago (%) - Multirace
Geographical mobility - Same house 1 year ago (%) - Other Race
Geographical mobility - Moved within same county (%)
Geographical mobility - Moved within same county (%) - White
Geographical mobility - Moved within same county (%) - Black or African American
Geographical mobility - Moved within same county (%) - Asian
Geographical mobility - Moved within same county (%) - Hispanic or Latino
Geographical mobility - Moved within same county (%) - American Indian and Alaska Native
Geographical mobility - Moved within same county (%) - Multirace
Geographical mobility - Moved within same county (%) - Other Race
Geographical mobility - Moved from different county within same state (%)
Geographical mobility - Moved from different county within same state (%) - White
Geographical mobility - Moved from different county within same state (%) - Black or African American
Geographical mobility - Moved from different county within same state (%) - Asian
Geographical mobility - Moved from different county within same state (%) - Hispanic or Latino
Geographical mobility - Moved from different county within same state (%) - American Indian and Alaska Native
Geographical mobility - Moved from different county within same state (%) - Multirace
Geographical mobility - Moved from different county within same state (%) - Other Race
Geographical mobility - Moved from different state (%)
Geographical mobility - Moved from different state (%) - White
Geographical mobility - Moved from different state (%) - Black or African American
Geographical mobility - Moved from different state (%) - Asian
Geographical mobility - Moved from different state (%) - Hispanic or Latino
Geographical mobility - Moved from different state (%) - American Indian and Alaska Native
Geographical mobility - Moved from different state (%) - Multirace
Geographical mobility - Moved from different state (%) - Other Race
Geographical mobility - Moved from abroad (%)
Geographical mobility - Moved from abroad (%) - White
Geographical mobility - Moved from abroad (%) - Black or African American
Geographical mobility - Moved from abroad (%) - Asian
Geographical mobility - Moved from abroad (%) - Hispanic or Latino
Geographical mobility - Moved from abroad (%) - American Indian and Alaska Native
Geographical mobility - Moved from abroad (%) - Multirace
Geographical mobility - Moved from abroad (%) - Other Race
Place of birth for the foreign-born population - Ireland (%)
Place of birth for the foreign-born population - Denmark (%)
Place of birth for the foreign-born population - Norway (%)
Place of birth for the foreign-born population - Sweden (%)
Place of birth for the foreign-born population - United Kingdom (%)
Place of birth for the foreign-born population - England (%)
Place of birth for the foreign-born population - Scotland (%)
Place of birth for the foreign-born population - Other Northern Europe (%)
Place of birth for the foreign-born population - Austria (%)
Place of birth for the foreign-born population - Belgium (%)
Place of birth for the foreign-born population - France (%)
Place of birth for the foreign-born population - Germany (%)
Place of birth for the foreign-born population - Netherlands (%)
Place of birth for the foreign-born population - Switzerland (%)
Place of birth for the foreign-born population - Other Western Europe (%)
Place of birth for the foreign-born population - Greece (%)
Place of birth for the foreign-born population - Italy (%)
Place of birth for the foreign-born population - Portugal (%)
Place of birth for the foreign-born population - Spain (%)
Place of birth for the foreign-born population - Other Southern Europe (%)
Place of birth for the foreign-born population - Albania (%)
Place of birth for the foreign-born population - Belarus (%)
Place of birth for the foreign-born population - Bosnia and Herzegovina (%)
Place of birth for the foreign-born population - Bulgaria (%)
Place of birth for the foreign-born population - Croatia (%)
Place of birth for the foreign-born population - Czechoslovakia (%)
Place of birth for the foreign-born population - Hungary (%)
Place of birth for the foreign-born population - Latvia (%)
Place of birth for the foreign-born population - Lithuania (%)
Place of birth for the foreign-born population - North Macedonia (Macedonia) (%)
Place of birth for the foreign-born population - Moldova (%)
Place of birth for the foreign-born population - Poland (%)
Place of birth for the foreign-born population - Romania (%)
Place of birth for the foreign-born population - Russia (%)
Place of birth for the foreign-born population - Serbia (%)
Place of birth for the foreign-born population - Ukraine (%)
Place of birth for the foreign-born population - Other Eastern Europe (%)
Place of birth for the foreign-born population - China (%)
Place of birth for the foreign-born population - Hong Kong (%)
Place of birth for the foreign-born population - Taiwan (%)
Place of birth for the foreign-born population - Japan (%)
Place of birth for the foreign-born population - Korea (%)
Place of birth for the foreign-born population - Other Eastern Asia (%)
Place of birth for the foreign-born population - Afghanistan (%)
Place of birth for the foreign-born population - Bangladesh (%)
Place of birth for the foreign-born population - India (%)
Place of birth for the foreign-born population - Iran (%)
Place of birth for the foreign-born population - Kazakhstan (%)
Place of birth for the foreign-born population - Nepal (%)
Place of birth for the foreign-born population - Pakistan (%)
Place of birth for the foreign-born population - Sri Lanka (%)
Place of birth for the foreign-born population - Uzbekistan (%)
Place of birth for the foreign-born population - Other South Central Asia (%)
Place of birth for the foreign-born population - Burma (%)
Place of birth for the foreign-born population - Cambodia (%)
Place of birth for the foreign-born population - Indonesia (%)
Place of birth for the foreign-born population - Laos (%)
Place of birth for the foreign-born population - Malaysia (%)
Place of birth for the foreign-born population - Philippines (%)
Place of birth for the foreign-born population - Singapore (%)
Place of birth for the foreign-born population - Thailand (%)
Place of birth for the foreign-born population - Vietnam (%)
Place of birth for the foreign-born population - Other South Eastern Asia (%)
Place of birth for the foreign-born population - Armenia (%)
Place of birth for the foreign-born population - Iraq (%)
Place of birth for the foreign-born population - Israel (%)
Place of birth for the foreign-born population - Jordan (%)
Place of birth for the foreign-born population - Kuwait (%)
Place of birth for the foreign-born population - Lebanon (%)
Place of birth for the foreign-born population - Saudi Arabia (%)
Place of birth for the foreign-born population - Syria (%)
Place of birth for the foreign-born population - Turkey (%)
Place of birth for the foreign-born population - Yemen (%)
Place of birth for the foreign-born population - Other Western Asia (%)
Place of birth for the foreign-born population - Eritrea (%)
Place of birth for the foreign-born population - Ethiopia (%)
Place of birth for the foreign-born population - Kenya (%)
Place of birth for the foreign-born population - Somalia (%)
Place of birth for the foreign-born population - Uganda (%)
Place of birth for the foreign-born population - Zimbabwe (%)
Place of birth for the foreign-born population - Other Eastern Africa (%)
Place of birth for the foreign-born population - Cameroon (%)
Place of birth for the foreign-born population - Congo (%)
Place of birth for the foreign-born population - Democratic Republic of Congo (Zaire) (%)
Place of birth for the foreign-born population - Other Middle Africa (%)
Place of birth for the foreign-born population - Egypt (%)
Place of birth for the foreign-born population - Morocco (%)
Place of birth for the foreign-born population - Sudan (%)
Place of birth for the foreign-born population - Other Northern Africa (%)
Place of birth for the foreign-born population - South Africa (%)
Place of birth for the foreign-born population - Other Southern Africa (%)
Place of birth for the foreign-born population - Cabo Verde (%)
Place of birth for the foreign-born population - Ghana (%)
Place of birth for the foreign-born population - Liberia (%)
Place of birth for the foreign-born population - Nigeria (%)
Place of birth for the foreign-born population - Senegal (%)
Place of birth for the foreign-born population - Sierra Leone (%)
Place of birth for the foreign-born population - Other Western Africa (%)
Place of birth for the foreign-born population - Australia (%)
Place of birth for the foreign-born population - New Zealand (%)
Place of birth for the foreign-born population - Fiji (%)
Place of birth for the foreign-born population - Micronesia (%)
Place of birth for the foreign-born population - Bahamas (%)
Place of birth for the foreign-born population - Barbados (%)
Place of birth for the foreign-born population - Cuba (%)
Place of birth for the foreign-born population - Dominica (%)
Place of birth for the foreign-born population - Dominican Republic (%)
Place of birth for the foreign-born population - Grenada (%)
Place of birth for the foreign-born population - Haiti (%)
Place of birth for the foreign-born population - Jamaica (%)
Place of birth for the foreign-born population - St. Vincent and the Grenadines (%)
Place of birth for the foreign-born population - Trinidad and Tobago (%)
Place of birth for the foreign-born population - West Indies (%)
Place of birth for the foreign-born population - Other Caribbean (%)
Place of birth for the foreign-born population - Belize (%)
Place of birth for the foreign-born population - Costa Rica (%)
Place of birth for the foreign-born population - El Salvador (%)
Place of birth for the foreign-born population - Guatemala (%)
Place of birth for the foreign-born population - Honduras (%)
Place of birth for the foreign-born population - Mexico (%)
Place of birth for the foreign-born population - Nicaragua (%)
Place of birth for the foreign-born population - Panama (%)
Place of birth for the foreign-born population - Other Central America (%)
Place of birth for the foreign-born population - Argentina (%)
Place of birth for the foreign-born population - Bolivia (%)
Place of birth for the foreign-born population - Brazil (%)
Place of birth for the foreign-born population - Chile (%)
Place of birth for the foreign-born population - Colombia (%)
Place of birth for the foreign-born population - Ecuador (%)
Place of birth for the foreign-born population - Guyana (%)
Place of birth for the foreign-born population - Peru (%)
Place of birth for the foreign-born population - Uruguay (%)
Place of birth for the foreign-born population - Venezuela (%)
Place of birth for the foreign-born population - Other South America (%)
Place of birth for the foreign-born population - Canada (%)
Place of birth for the foreign-born population - Other Northern America (%)
Place of birth for the foreign-born population - Other (%)
Latest news about races in Wilson, PA collected exclusively by city-data.com from local newspapers, TV, and radio stations
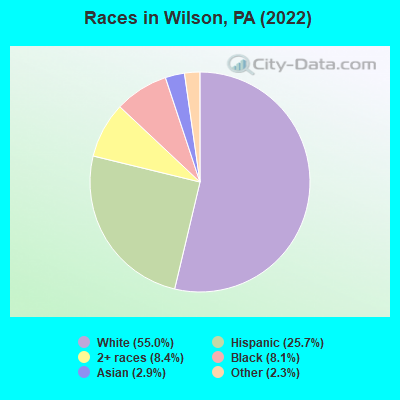
According to 2022 data, the most numerous races in Wilson, PA are White alone (4,576 residents), Black alone (672 residents), and Hispanic (2,134 residents). 74.3% of Wilson residents speak English at home. 10.7% of Wilson, PA residents are foreign-born (7.4% born in Latin America, 2.2% born in Asia), which is 34.3% greater than the foreign-born rate of 7.0% across the entire state of Pennsylvania.
Race distribution in Wilson
2000 2022
10,322,455 84.1% White alone 1,202,437 9.8% Black alone 394,088 3.2% Hispanic 218,296 1.8% Asian alone 113,097 0.9% Two or more races 13,086 0.1% Other race alone 14,904 0.1% American Indian alone 2,691 0.02% Native Hawaiian and Other
9,487,228 73.1% White alone 1,311,581 10.1% Black alone 1,115,997 8.6% Hispanic 493,942 3.8% Two or more races 487,124 3.8% Asian alone 63,582 0.5% Other race alone 10,130 0.08% American Indian alone 2,424 0.02% Native Hawaiian and Other
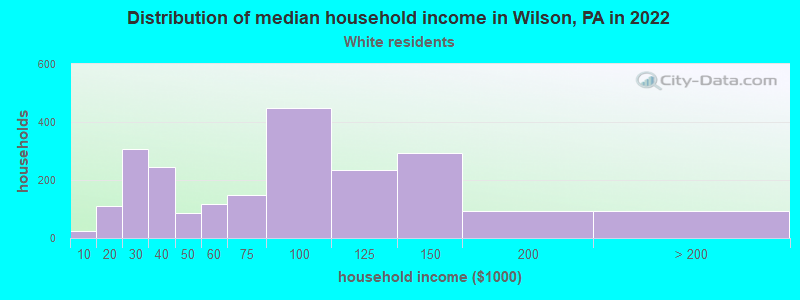
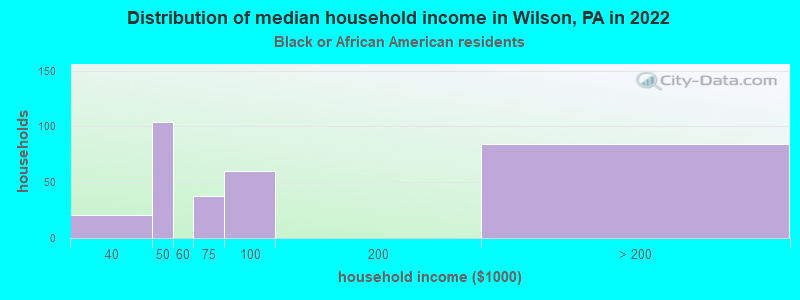
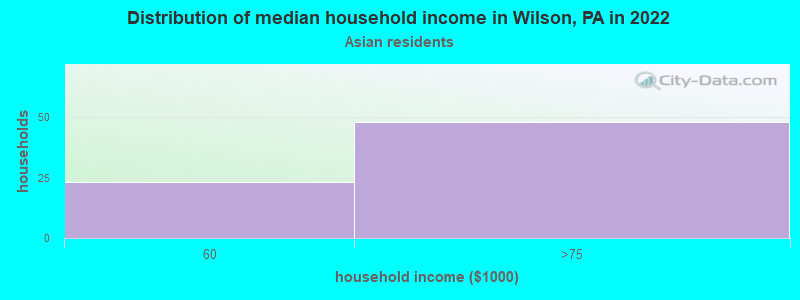
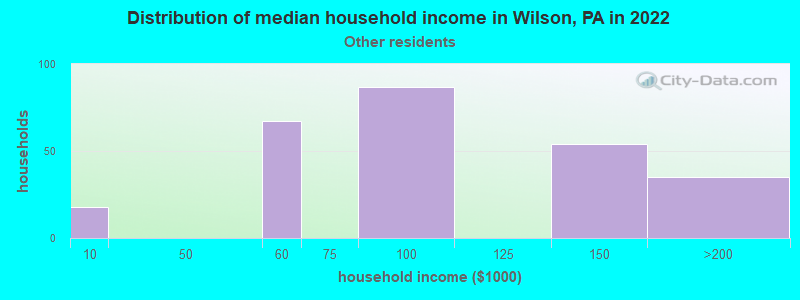
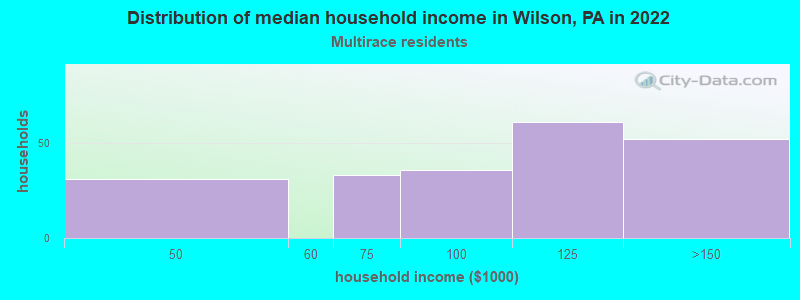
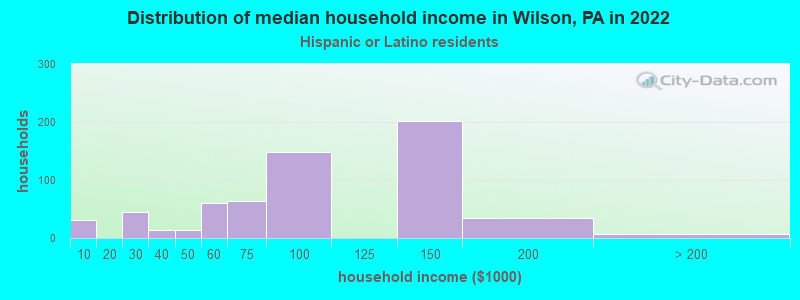
Income and house value in Wilson Median household income in 2022 $73,988 White non-Hispanic householders$54,839 Black householders$67,452 Asian householders$95,772 Two or more races householders$65,957 Hispanic or Latino race householdersMedian 2022 house value $188,172 White Non-Hispanic householders$161,562 Black or African American householders $225,712 Asian householders$143,742 Two or more races householders$190,073 Hispanic or Latino householders
Median age by race in Wilson
36.8 Median age for White residents36.3 38.3 43.3 Median age for Black or African American residents34.4 44.1 -678,642,713.9 Median age for American Indian / Alaska Native residents-835,945,662.7 -553,571,428.0 8.1 Median age for Asian residents6.3 33.7 -680,432,644.4 Median age for Native Hawaiian / Pacific Islander residents-649,523,808.9 -666,666,666.0 23.0 Median age for Other race residents17.0 33.0 14.8 Median age for Two or more races residents10.2 23.3 38.5 Median age for White alone residents39.4 38.6 26.2 Median age for Hispanic or Latino residents21.2 31.4
Owner/renter occupied households by race in Wilson
House owners and renters - White residents 1,405 64.9% Owner occupied759 35.1% Renter occupiedHouse owners and renters - Black or African American residents 183 62.8% Owner occupied108 37.2% Renter occupiedHouse owners and renters - Asian residents 22 35.9% Owner occupied39 64.1% Renter occupiedHouse owners and renters - Other race residents 186 63.9% Owner occupied105 36.1% Renter occupiedHouse owners and renters - Two or more races residents 56 23.2% Owner occupied185 76.8% Renter occupiedHouse owners and renters - White alone residents 1,333 68.0% Owner occupied627 32.0% Renter occupiedHouse owners and renters - Hispanic or Latino residents 241 40.4% Owner occupied355 59.6% Renter occupied
Language usage in Wilson
English speakers - Total 74.3% of residents of Wilson speak English at home.
23.8% of residents speak Spanish at home 1,316 70.9% Speak English very well539 29.1% Speak English less than very well3.7% of residents speak other language at home 148 51.9% Speak English very well137 48.1% Speak English less than very well
English speakers - Born in the United States 82.2% of residents of Wilson speak English at home.
17.2% of residents speak Spanish at home 361 95.5% Speak English very well17 4.5% Speak English less than very well1.7% of residents speak other language at home 15 40.5% Speak English very well22 59.5% Speak English less than very well
English speakers - Native, born elsewhere 7.7% of residents of Wilson speak English at home.
91.2% of residents speak Spanish at home 175 73.5% Speak English very well63 26.5% Speak English less than very well
English speakers - Foreign-born 20.3% of residents of Wilson speak English at home.
65.3% of residents speak Spanish at home 177 27.8% Speak English very well459 72.2% Speak English less than very well20.8% of residents speak other language at home 110 54.2% Speak English very well93 45.8% Speak English less than very well
White (Caucasian) - Speak only English Native:
92.3% (4,280)Foreign-born:
22.0% (61)
White (Caucasian) - Speak another language Native:
6.4% (295)Foreign-born:
73.7% (204)
Black or African American - Speak only English Native:
95.6% (639)Foreign-born:
52.3% (60)
Black or African American - Speak another language Native:
4.2% (28)Foreign-born:
24.1% (28)
Asian - Speak another language Native:
100.0% (23)Foreign-born:
87.3% (119)
Other race - Speak only English Native:
11.7% (129)Foreign-born:
7.5% (30)
Other race - Speak another language Native:
97.2% (1,076)Foreign-born:
92.7% (369)
Two or more races - Speak another language Native:
2.3% (16)Foreign-born:
100.0% (58)
White alone - Speak only English Native:
97.8% (4,250)Foreign-born:
32.3% (35)
White alone - Speak another language Native:
2.2% (96)Foreign-born:
67.4% (73)
Hispanic or Latino - Speak only English Native:
19.5% (268)Foreign-born:
4.9% (32)
Hispanic or Latino - Speak another language Native:
89.2% (1,229)Foreign-born:
96.0% (631)
Foreign-born residents in Wilson 886 residents are foreign born (7.4% Latin America , 2.2% Asia ).
This city:
10.7%Pennsylvania:
7.3%
Marital status for residents in Wilson Marital status - White (Caucasian) population 15 years and over
Males 38.7% Never married47.2% Now married2.4% Separated4.0% Widowed7.7% DivorcedFemales 24.9% Never married52.8% Now married0.0% Separated9.5% Widowed12.9% DivorcedWomen who gave birth in the past 12 months Now married:
60.3% (73)Unmarried:
39.7% (48)
Women who did not give birth in the past 12 months Now married:
58.0% (655)Unmarried:
42.0% (475)
Marital status - Black or African American population 15 years and over
Males 36.7% Never married58.9% Now married0.0% Separated0.0% Widowed4.4% DivorcedFemales 40.6% Never married34.3% Now married17.6% Separated1.7% Widowed5.8% DivorcedWomen who did not give birth in the past 12 months Now married:
50.2% (124)Unmarried:
49.8% (123)
Marital status - Asian population 15 years and over
Males 48.4% Never married51.6% Now married0.0% Separated0.0% Widowed0.0% DivorcedFemales 42.0% Never married58.0% Now married0.0% Separated0.0% Widowed0.0% DivorcedWomen who gave birth in the past 12 months Now married:
0.0% (0)Unmarried:
100.0% (23)
Women who did not give birth in the past 12 months Now married:
100.0% (31)Unmarried:
0.0% (0)
Marital status - Other race population 15 years and over
Males 33.6% Never married66.4% Now married0.0% Separated0.0% Widowed0.0% DivorcedFemales 16.7% Never married76.5% Now married0.0% Separated0.0% Widowed6.8% DivorcedWomen who did not give birth in the past 12 months Now married:
80.4% (228)Unmarried:
19.6% (55)
Marital status - Two or more races population 15 years and over
Males 53.8% Never married46.2% Now married0.0% Separated0.0% Widowed0.0% DivorcedFemales 14.2% Never married64.0% Now married0.0% Separated0.0% Widowed21.8% DivorcedWomen who did not give birth in the past 12 months Now married:
64.0% (165)Unmarried:
36.0% (93)
Marital status - White alone, not Hispanic / Latino population 15 years and over
Males 36.7% Never married48.7% Now married1.5% Separated4.7% Widowed8.4% DivorcedFemales 23.8% Never married53.2% Now married0.0% Separated10.6% Widowed12.4% DivorcedWomen who gave birth in the past 12 months Now married:
44.3% (31)Unmarried:
55.7% (39)
Women who did not give birth in the past 12 months Now married:
61.1% (623)Unmarried:
38.9% (396)
Marital status - Hispanic or Latino population 15 years and over
Males 41.0% Never married53.6% Now married3.6% Separated0.0% Widowed1.9% DivorcedFemales 29.1% Never married58.1% Now married0.0% Separated0.0% Widowed12.8% DivorcedWomen who gave birth in the past 12 months Now married:
80.4% (49)Unmarried:
19.6% (12)
Women who did not give birth in the past 12 months Now married:
58.7% (285)Unmarried:
41.3% (201)
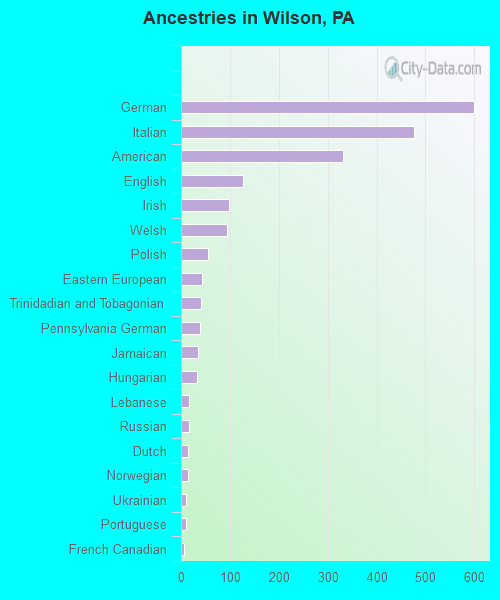
Ancestries in Wilson
600 15.5% German476 12.3% Italian331 8.6% American126 3.3% English98 2.5% Irish94 2.4% Welsh55 1.4% Polish42 1.1% Eastern European41 1.1% Trinidadian and Tobagonian38 1.0% Pennsylvania German35 0.9% Jamaican33 0.9% Hungarian17 0.4% Lebanese16 0.4% Russian15 0.4% Dutch15 0.4% Norwegian11 0.3% Ukrainian10 0.3% Portuguese7 0.2% French Canadian
Children Nativity (place of birth) in Wilson
Children under 6 years - Living with two parents Both parents native 212 100.0% NativeBoth parents foreign-born 44 100.0% NativeOne native, one foreign-born parent 22 100.0% NativeChildren under 6 years - Living with one parent Native parent 337 100.0% NativeForeign-born parent 93 100.0% NativeChildren 6 to 17 years - Living with two parents Both parents native 867 100.0% NativeBoth parents foreign-born 55 29.5% Native130 70.5% Foreign-bornOne native, one foreign-born parent 89 100.0% NativeChildren 6 to 17 years - Living with one parent Native parent 287 100.0% NativeForeign-born parent 105 47.1% Native118 52.9% Foreign-born
Grandparents responsible for own grandchildren in Wilson
Grandparents (30 to 59 years) White / Caucasian 16 100.0% Responsible for grandchildrenWhite alone, not Hispanic / Latino 12 100.0% Responsible for grandchildrenHispanic or Latino 5 100.0% Responsible for grandchildren
Grandparents (60 years and over) White / Caucasian 26 100.0% Responsible for grandchildrenWhite alone, not Hispanic / Latino 26 100.0% Responsible for grandchildren