Races in Wilson, North Carolina (NC) Detailed Stats
Data:
Races - White alone (%)
Races - White alone (% change since 2000)
Races - Black alone (%)
Races - Black alone (% change since 2000)
Races - American Indian alone (%)
Races - American Indian alone (% change since 2000)
Races - Asian alone (%)
Races - Asian alone (% change since 2000)
Races - Hispanic (%)
Races - Hispanic (% change since 2000)
Races - Native Hawaiian and Other Pacific Islander alone (%)
Races - Native Hawaiian and Other Pacific Islander alone (% change since 2000)
Races - Two or more races(%)
Races - Two or more races(% change since 2000)
Races - Other race alone (%)
Races - Other race alone (% change since 2000)
Racial diversity
Place of birth - Born in state of residence (%)
Place of birth - Born in state of residence (%) - White
Place of birth - Born in state of residence (%) - Black or African American
Place of birth - Born in state of residence (%) - Asian
Place of birth - Born in state of residence (%) - Hispanic or Latino
Place of birth - Born in state of residence (%) - American Indian and Alaska Native
Place of birth - Born in state of residence (%) - Multirace
Place of birth - Born in state of residence (%) - Other Race
Place of birth - Born in other state (%)
Place of birth - Born in other state (%) - White
Place of birth - Born in other state (%) - Black or African American
Place of birth - Born in other state (%) - Asian
Place of birth - Born in other state (%) - Hispanic or Latino
Place of birth - Born in other state (%) - American Indian and Alaska Native
Place of birth - Born in other state (%) - Multirace
Place of birth - Born in other state (%) - Other Race
Place of birth - Native, outside of US (%)
Place of birth - Native, outside of US (%) - White
Place of birth - Native, outside of US (%) - Black or African American
Place of birth - Native, outside of US (%) - Asian
Place of birth - Native, outside of US (%) - Hispanic or Latino
Place of birth - Native, outside of US (%) - American Indian and Alaska Native
Place of birth - Native, outside of US (%) - Multirace
Place of birth - Native, outside of US (%) - Other Race
Place of birth - Foreign born (%)
Place of birth - Foreign born (%) - White
Place of birth - Foreign born (%) - Black or African American
Place of birth - Foreign born (%) - Asian
Place of birth - Foreign born (%) - Hispanic or Latino
Place of birth - Foreign born (%) - American Indian and Alaska Native
Place of birth - Foreign born (%) - Multirace
Place of birth - Foreign born (%) - Other Race
Residents speaking English at home (%)
Residents speaking English at home - Born in the United States (%)
Residents speaking English at home - Native, born elsewhere (%)
Residents speaking English at home - Foreign born (%)
Residents speaking Spanish at home (%)
Residents speaking Spanish at home - Born in the United States (%)
Residents speaking Spanish at home - Native, born elsewhere (%)
Residents speaking Spanish at home - Foreign born (%)
Residents speaking other language at home (%)
Residents speaking other language at home - Born in the United States (%)
Residents speaking other language at home - Native, born elsewhere (%)
Residents speaking other language at home - Foreign born (%)
Marital status - Never married (%)
Marital status - Now married (%)
Marital status - Separated (%)
Marital status - Widowed (%)
Marital status - Divorced (%)
Ancestries Reported - Arab (%)
Ancestries Reported - Czech (%)
Ancestries Reported - Danish (%)
Ancestries Reported - Dutch (%)
Ancestries Reported - English (%)
Ancestries Reported - French (%)
Ancestries Reported - French Canadian (%)
Ancestries Reported - German (%)
Ancestries Reported - Greek (%)
Ancestries Reported - Hungarian (%)
Ancestries Reported - Irish (%)
Ancestries Reported - Italian (%)
Ancestries Reported - Lithuanian (%)
Ancestries Reported - Norwegian (%)
Ancestries Reported - Polish (%)
Ancestries Reported - Portuguese (%)
Ancestries Reported - Russian (%)
Ancestries Reported - Scotch-Irish (%)
Ancestries Reported - Scottish (%)
Ancestries Reported - Slovak (%)
Ancestries Reported - Subsaharan African (%)
Ancestries Reported - Swedish (%)
Ancestries Reported - Swiss (%)
Ancestries Reported - Ukrainian (%)
Ancestries Reported - United States (%)
Ancestries Reported - Welsh (%)
Ancestries Reported - West Indian (%)
Ancestries Reported - Other (%)
Geographical mobility - Same house 1 year ago (%)
Geographical mobility - Same house 1 year ago (%) - White
Geographical mobility - Same house 1 year ago (%) - Black or African American
Geographical mobility - Same house 1 year ago (%) - Asian
Geographical mobility - Same house 1 year ago (%) - Hispanic or Latino
Geographical mobility - Same house 1 year ago (%) - American Indian and Alaska Native
Geographical mobility - Same house 1 year ago (%) - Multirace
Geographical mobility - Same house 1 year ago (%) - Other Race
Geographical mobility - Moved within same county (%)
Geographical mobility - Moved within same county (%) - White
Geographical mobility - Moved within same county (%) - Black or African American
Geographical mobility - Moved within same county (%) - Asian
Geographical mobility - Moved within same county (%) - Hispanic or Latino
Geographical mobility - Moved within same county (%) - American Indian and Alaska Native
Geographical mobility - Moved within same county (%) - Multirace
Geographical mobility - Moved within same county (%) - Other Race
Geographical mobility - Moved from different county within same state (%)
Geographical mobility - Moved from different county within same state (%) - White
Geographical mobility - Moved from different county within same state (%) - Black or African American
Geographical mobility - Moved from different county within same state (%) - Asian
Geographical mobility - Moved from different county within same state (%) - Hispanic or Latino
Geographical mobility - Moved from different county within same state (%) - American Indian and Alaska Native
Geographical mobility - Moved from different county within same state (%) - Multirace
Geographical mobility - Moved from different county within same state (%) - Other Race
Geographical mobility - Moved from different state (%)
Geographical mobility - Moved from different state (%) - White
Geographical mobility - Moved from different state (%) - Black or African American
Geographical mobility - Moved from different state (%) - Asian
Geographical mobility - Moved from different state (%) - Hispanic or Latino
Geographical mobility - Moved from different state (%) - American Indian and Alaska Native
Geographical mobility - Moved from different state (%) - Multirace
Geographical mobility - Moved from different state (%) - Other Race
Geographical mobility - Moved from abroad (%)
Geographical mobility - Moved from abroad (%) - White
Geographical mobility - Moved from abroad (%) - Black or African American
Geographical mobility - Moved from abroad (%) - Asian
Geographical mobility - Moved from abroad (%) - Hispanic or Latino
Geographical mobility - Moved from abroad (%) - American Indian and Alaska Native
Geographical mobility - Moved from abroad (%) - Multirace
Geographical mobility - Moved from abroad (%) - Other Race
Place of birth for the foreign-born population - Ireland (%)
Place of birth for the foreign-born population - Denmark (%)
Place of birth for the foreign-born population - Norway (%)
Place of birth for the foreign-born population - Sweden (%)
Place of birth for the foreign-born population - United Kingdom (%)
Place of birth for the foreign-born population - England (%)
Place of birth for the foreign-born population - Scotland (%)
Place of birth for the foreign-born population - Other Northern Europe (%)
Place of birth for the foreign-born population - Austria (%)
Place of birth for the foreign-born population - Belgium (%)
Place of birth for the foreign-born population - France (%)
Place of birth for the foreign-born population - Germany (%)
Place of birth for the foreign-born population - Netherlands (%)
Place of birth for the foreign-born population - Switzerland (%)
Place of birth for the foreign-born population - Other Western Europe (%)
Place of birth for the foreign-born population - Greece (%)
Place of birth for the foreign-born population - Italy (%)
Place of birth for the foreign-born population - Portugal (%)
Place of birth for the foreign-born population - Spain (%)
Place of birth for the foreign-born population - Other Southern Europe (%)
Place of birth for the foreign-born population - Albania (%)
Place of birth for the foreign-born population - Belarus (%)
Place of birth for the foreign-born population - Bosnia and Herzegovina (%)
Place of birth for the foreign-born population - Bulgaria (%)
Place of birth for the foreign-born population - Croatia (%)
Place of birth for the foreign-born population - Czechoslovakia (%)
Place of birth for the foreign-born population - Hungary (%)
Place of birth for the foreign-born population - Latvia (%)
Place of birth for the foreign-born population - Lithuania (%)
Place of birth for the foreign-born population - North Macedonia (Macedonia) (%)
Place of birth for the foreign-born population - Moldova (%)
Place of birth for the foreign-born population - Poland (%)
Place of birth for the foreign-born population - Romania (%)
Place of birth for the foreign-born population - Russia (%)
Place of birth for the foreign-born population - Serbia (%)
Place of birth for the foreign-born population - Ukraine (%)
Place of birth for the foreign-born population - Other Eastern Europe (%)
Place of birth for the foreign-born population - China (%)
Place of birth for the foreign-born population - Hong Kong (%)
Place of birth for the foreign-born population - Taiwan (%)
Place of birth for the foreign-born population - Japan (%)
Place of birth for the foreign-born population - Korea (%)
Place of birth for the foreign-born population - Other Eastern Asia (%)
Place of birth for the foreign-born population - Afghanistan (%)
Place of birth for the foreign-born population - Bangladesh (%)
Place of birth for the foreign-born population - India (%)
Place of birth for the foreign-born population - Iran (%)
Place of birth for the foreign-born population - Kazakhstan (%)
Place of birth for the foreign-born population - Nepal (%)
Place of birth for the foreign-born population - Pakistan (%)
Place of birth for the foreign-born population - Sri Lanka (%)
Place of birth for the foreign-born population - Uzbekistan (%)
Place of birth for the foreign-born population - Other South Central Asia (%)
Place of birth for the foreign-born population - Burma (%)
Place of birth for the foreign-born population - Cambodia (%)
Place of birth for the foreign-born population - Indonesia (%)
Place of birth for the foreign-born population - Laos (%)
Place of birth for the foreign-born population - Malaysia (%)
Place of birth for the foreign-born population - Philippines (%)
Place of birth for the foreign-born population - Singapore (%)
Place of birth for the foreign-born population - Thailand (%)
Place of birth for the foreign-born population - Vietnam (%)
Place of birth for the foreign-born population - Other South Eastern Asia (%)
Place of birth for the foreign-born population - Armenia (%)
Place of birth for the foreign-born population - Iraq (%)
Place of birth for the foreign-born population - Israel (%)
Place of birth for the foreign-born population - Jordan (%)
Place of birth for the foreign-born population - Kuwait (%)
Place of birth for the foreign-born population - Lebanon (%)
Place of birth for the foreign-born population - Saudi Arabia (%)
Place of birth for the foreign-born population - Syria (%)
Place of birth for the foreign-born population - Turkey (%)
Place of birth for the foreign-born population - Yemen (%)
Place of birth for the foreign-born population - Other Western Asia (%)
Place of birth for the foreign-born population - Eritrea (%)
Place of birth for the foreign-born population - Ethiopia (%)
Place of birth for the foreign-born population - Kenya (%)
Place of birth for the foreign-born population - Somalia (%)
Place of birth for the foreign-born population - Uganda (%)
Place of birth for the foreign-born population - Zimbabwe (%)
Place of birth for the foreign-born population - Other Eastern Africa (%)
Place of birth for the foreign-born population - Cameroon (%)
Place of birth for the foreign-born population - Congo (%)
Place of birth for the foreign-born population - Democratic Republic of Congo (Zaire) (%)
Place of birth for the foreign-born population - Other Middle Africa (%)
Place of birth for the foreign-born population - Egypt (%)
Place of birth for the foreign-born population - Morocco (%)
Place of birth for the foreign-born population - Sudan (%)
Place of birth for the foreign-born population - Other Northern Africa (%)
Place of birth for the foreign-born population - South Africa (%)
Place of birth for the foreign-born population - Other Southern Africa (%)
Place of birth for the foreign-born population - Cabo Verde (%)
Place of birth for the foreign-born population - Ghana (%)
Place of birth for the foreign-born population - Liberia (%)
Place of birth for the foreign-born population - Nigeria (%)
Place of birth for the foreign-born population - Senegal (%)
Place of birth for the foreign-born population - Sierra Leone (%)
Place of birth for the foreign-born population - Other Western Africa (%)
Place of birth for the foreign-born population - Australia (%)
Place of birth for the foreign-born population - New Zealand (%)
Place of birth for the foreign-born population - Fiji (%)
Place of birth for the foreign-born population - Micronesia (%)
Place of birth for the foreign-born population - Bahamas (%)
Place of birth for the foreign-born population - Barbados (%)
Place of birth for the foreign-born population - Cuba (%)
Place of birth for the foreign-born population - Dominica (%)
Place of birth for the foreign-born population - Dominican Republic (%)
Place of birth for the foreign-born population - Grenada (%)
Place of birth for the foreign-born population - Haiti (%)
Place of birth for the foreign-born population - Jamaica (%)
Place of birth for the foreign-born population - St. Vincent and the Grenadines (%)
Place of birth for the foreign-born population - Trinidad and Tobago (%)
Place of birth for the foreign-born population - West Indies (%)
Place of birth for the foreign-born population - Other Caribbean (%)
Place of birth for the foreign-born population - Belize (%)
Place of birth for the foreign-born population - Costa Rica (%)
Place of birth for the foreign-born population - El Salvador (%)
Place of birth for the foreign-born population - Guatemala (%)
Place of birth for the foreign-born population - Honduras (%)
Place of birth for the foreign-born population - Mexico (%)
Place of birth for the foreign-born population - Nicaragua (%)
Place of birth for the foreign-born population - Panama (%)
Place of birth for the foreign-born population - Other Central America (%)
Place of birth for the foreign-born population - Argentina (%)
Place of birth for the foreign-born population - Bolivia (%)
Place of birth for the foreign-born population - Brazil (%)
Place of birth for the foreign-born population - Chile (%)
Place of birth for the foreign-born population - Colombia (%)
Place of birth for the foreign-born population - Ecuador (%)
Place of birth for the foreign-born population - Guyana (%)
Place of birth for the foreign-born population - Peru (%)
Place of birth for the foreign-born population - Uruguay (%)
Place of birth for the foreign-born population - Venezuela (%)
Place of birth for the foreign-born population - Other South America (%)
Place of birth for the foreign-born population - Canada (%)
Place of birth for the foreign-born population - Other Northern America (%)
Place of birth for the foreign-born population - Other (%)
Latest news about races in Wilson, NC collected exclusively by city-data.com from local newspapers, TV, and radio stations
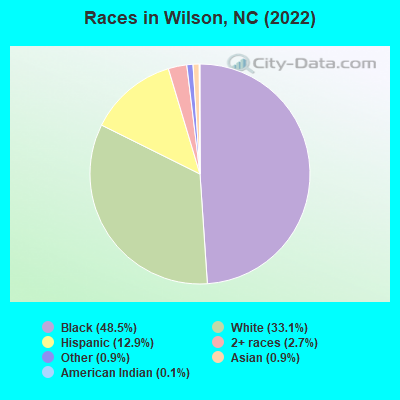
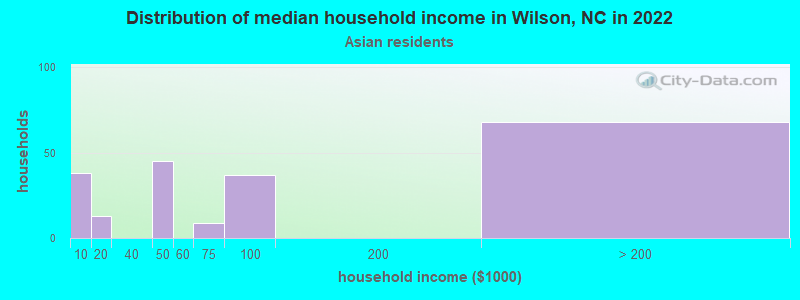
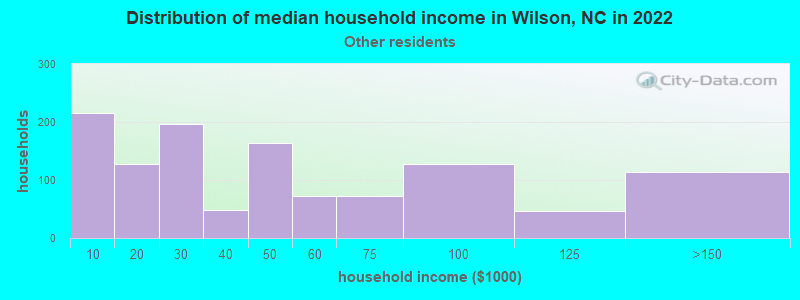
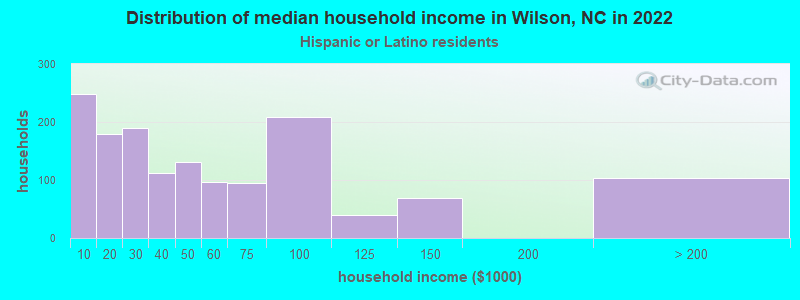
According to 2022 data, the most numerous races in Wilson, NC are White alone (15,783 residents), Black alone (23,119 residents), and Hispanic (6,166 residents). 86.7% of Wilson residents speak English at home. 6.5% of Wilson, NC residents are foreign-born (3.6% born in Latin America, 1.6% born in Asia), which is 22.4% less than the foreign-born rate of 8.0% across the entire state of North Carolina.
Race distribution in Wilson
2000 2022
5,647,155 70.2% White alone 1,723,301 21.4% Black alone 378,963 4.7% Hispanic 112,416 1.4% Asian alone 95,333 1.2% American Indian alone 79,965 1.0% Two or more races 9,015 0.1% Other race alone 3,165 0.04% Native Hawaiian and Other
6,497,519 60.7% White alone 2,155,650 20.1% Black alone 1,114,799 10.4% Hispanic 438,061 4.1% Two or more races 341,052 3.2% Asian alone 91,758 0.9% American Indian alone 50,180 0.5% Other race alone 9,954 0.09% Native Hawaiian and Other
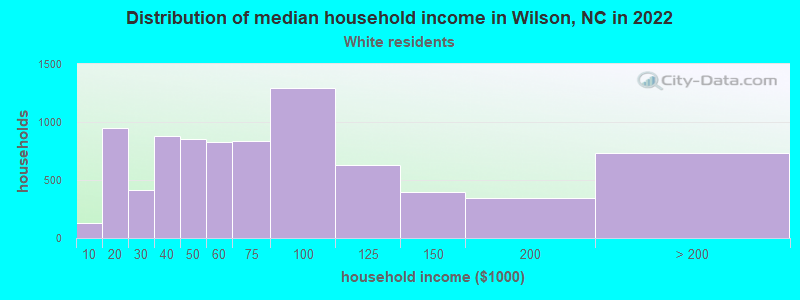
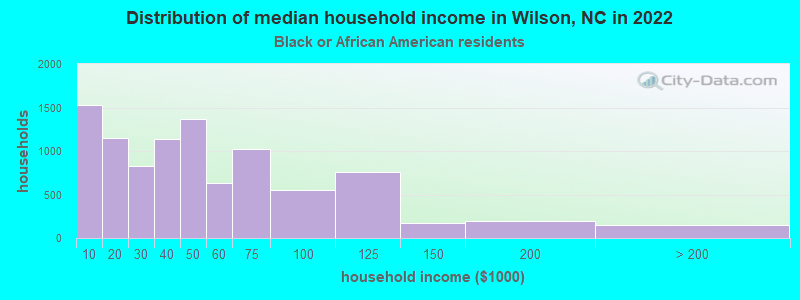
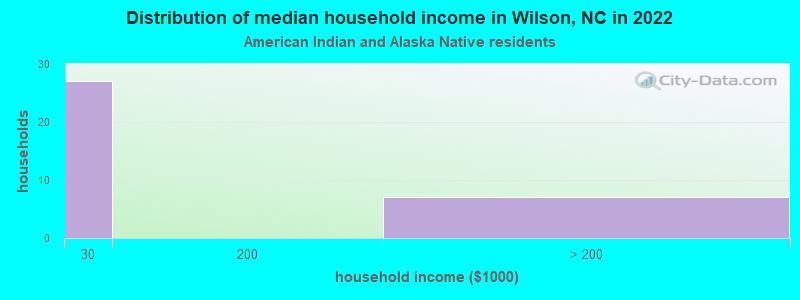
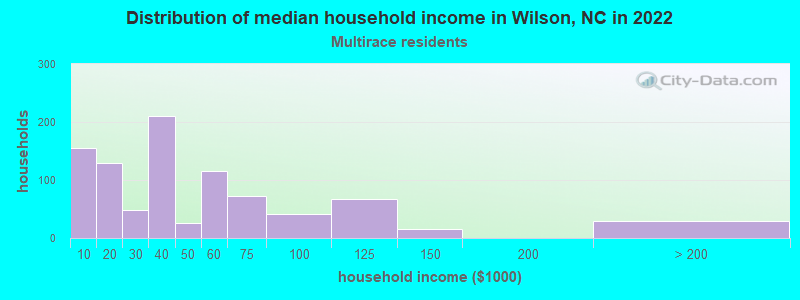
Income and house value in Wilson Median household income in 2022 $69,144 White non-Hispanic householders$37,096 Black householders$25,076 American Indian and Alaska Native householders$49,964 Some other race householders$45,400 Two or more races householders$45,292 Hispanic or Latino race householdersMedian 2022 house value $241,702 White Non-Hispanic householders$153,197 Black or African American householders$123,546 American Indian or Alaska Native householders $438,028 Asian householders$153,871 Some other race householders$415,565 Two or more races householders$203,290 Hispanic or Latino householders
Median age by race in Wilson
50.0 Median age for White residents45.4 51.5 36.8 Median age for Black or African American residents34.8 40.1 52.1 Median age for American Indian / Alaska Native residents50.5 20.3 62.4 Median age for Asian residents83.8 46.6 -666,666,666.0 Median age for Native Hawaiian / Pacific Islander residents-666,666,666.0 -666,666,666.0 22.6 Median age for Other race residents23.5 17.3 33.6 Median age for Two or more races residents38.1 36.4 50.4 Median age for White alone residents46.5 51.5 25.2 Median age for Hispanic or Latino residents29.1 23.2
Owner/renter occupied households by race in Wilson
House owners and renters - White residents 5,941 77.7% Owner occupied1,706 22.3% Renter occupiedHouse owners and renters - Black or African American residents 3,460 33.2% Owner occupied6,954 66.8% Renter occupiedHouse owners and renters - American Indian / Alaska Native residents 12 34.4% Owner occupied23 65.6% Renter occupiedHouse owners and renters - Asian residents 132 66.7% Owner occupied66 33.3% Renter occupiedHouse owners and renters - Other race residents 453 46.2% Owner occupied527 53.8% Renter occupiedHouse owners and renters - Two or more races residents 695 77.8% Owner occupied198 22.2% Renter occupiedHouse owners and renters - White alone residents 5,822 77.5% Owner occupied1,692 22.5% Renter occupiedHouse owners and renters - Hispanic or Latino residents 780 53.8% Owner occupied670 46.2% Renter occupied
Language usage in Wilson
English speakers - Total 86.7% of residents of Wilson speak English at home.
10.8% of residents speak Spanish at home 3,674 73.9% Speak English very well1,300 26.1% Speak English less than very well2.4% of residents speak other language at home 629 56.9% Speak English very well477 43.1% Speak English less than very well
English speakers - Born in the United States 88.8% of residents of Wilson speak English at home.
10.2% of residents speak Spanish at home 793 71.6% Speak English very well315 28.4% Speak English less than very well1.3% of residents speak other language at home 94 64.8% Speak English very well51 35.2% Speak English less than very well
English speakers - Native, born elsewhere 62.7% of residents of Wilson speak English at home.
36.0% of residents speak Spanish at home 61 71.8% Speak English very well24 28.2% Speak English less than very well
English speakers - Foreign-born 15.8% of residents of Wilson speak English at home.
55.2% of residents speak Spanish at home 850 49.5% Speak English very well867 50.5% Speak English less than very well27.9% of residents speak other language at home 465 53.4% Speak English very well405 46.6% Speak English less than very well
White (Caucasian) - Speak only English Native:
97.7% (15,694)Foreign-born:
29.4% (112)
White (Caucasian) - Speak another language Native:
2.3% (375)Foreign-born:
66.2% (254)
Black or African American - Speak only English Native:
98.9% (21,453)Foreign-born:
5.4% (20)
Black or African American - Speak another language Native:
1.1% (241)Foreign-born:
93.9% (349)
American Indian / Alaska Native - Speak another language Native:
91.1% (116)Foreign-born:
100.0% (27)
Asian - Speak only English Native:
99.5% (40)Foreign-born:
31.8% (163)
Other race - Speak only English Native:
40.1% (1,310)Foreign-born:
11.0% (149)
Other race - Speak another language Native:
58.8% (1,922)Foreign-born:
88.5% (1,203)
Two or more races - Speak only English Native:
67.1% (1,134)Foreign-born:
9.8% (112)
Two or more races - Speak another language Native:
34.9% (589)Foreign-born:
93.8% (1,069)
White alone - Speak only English Native:
98.5% (15,659)Foreign-born:
46.7% (117)
White alone - Speak another language Native:
1.5% (237)Foreign-born:
53.3% (134)
Hispanic or Latino - Speak only English Native:
28.8% (986)Foreign-born:
2.0% (44)
Hispanic or Latino - Speak another language Native:
69.5% (2,375)Foreign-born:
96.2% (2,124)
Foreign-born residents in Wilson 3,113 residents are foreign born (3.6% Latin America , 1.6% Asia ).
This city:
6.5%North Carolina:
8.3%
Marital status for residents in Wilson Marital status - White (Caucasian) population 15 years and over
Males 29.7% Never married57.6% Now married0.4% Separated3.6% Widowed8.6% DivorcedFemales 24.3% Never married47.6% Now married2.4% Separated11.8% Widowed13.8% DivorcedWomen who gave birth in the past 12 months Now married:
65.4% (49)Unmarried:
34.6% (26)
Women who did not give birth in the past 12 months Now married:
44.7% (1,525)Unmarried:
55.3% (1,890)
Marital status - Black or African American population 15 years and over
Males 43.6% Never married36.9% Now married3.7% Separated5.3% Widowed10.5% DivorcedFemales 43.2% Never married26.9% Now married3.8% Separated8.6% Widowed17.6% DivorcedWomen who gave birth in the past 12 months Now married:
29.6% (101)Unmarried:
70.4% (240)
Women who did not give birth in the past 12 months Now married:
29.3% (1,521)Unmarried:
70.7% (3,677)
Marital status - American Indian / Alaska Native population 15 years and over
Males 60.9% Never married23.9% Now married0.0% Separated0.0% Widowed15.2% DivorcedFemales 84.6% Never married15.4% Now married0.0% Separated0.0% Widowed0.0% DivorcedWomen who did not give birth in the past 12 months Now married:
0.0% (0)Unmarried:
100.0% (58)
Marital status - Asian population 15 years and over
Males 43.4% Never married47.4% Now married0.0% Separated0.0% Widowed9.2% DivorcedFemales 7.2% Never married44.4% Now married20.6% Separated25.0% Widowed2.8% DivorcedWomen who did not give birth in the past 12 months Now married:
63.7% (90)Unmarried:
36.3% (51)
Marital status - Other race population 15 years and over
Males 63.7% Never married27.6% Now married3.7% Separated2.5% Widowed2.6% DivorcedFemales 53.5% Never married35.4% Now married3.9% Separated0.7% Widowed6.5% DivorcedWomen who gave birth in the past 12 months Now married:
43.7% (35)Unmarried:
56.3% (45)
Women who did not give birth in the past 12 months Now married:
37.9% (454)Unmarried:
62.1% (742)
Marital status - Two or more races population 15 years and over
Males 40.0% Never married48.2% Now married0.0% Separated4.5% Widowed7.3% DivorcedFemales 42.7% Never married37.4% Now married0.0% Separated2.7% Widowed17.1% DivorcedWomen who gave birth in the past 12 months Now married:
100.0% (30)Unmarried:
0.0% (0)
Women who did not give birth in the past 12 months Now married:
38.4% (233)Unmarried:
61.6% (374)
Marital status - White alone, not Hispanic / Latino population 15 years and over
Males 28.3% Never married58.6% Now married0.4% Separated3.8% Widowed8.9% DivorcedFemales 24.0% Never married47.7% Now married2.1% Separated12.0% Widowed14.1% DivorcedWomen who gave birth in the past 12 months Now married:
70.7% (50)Unmarried:
29.3% (21)
Women who did not give birth in the past 12 months Now married:
44.0% (1,451)Unmarried:
56.0% (1,844)
Marital status - Hispanic or Latino population 15 years and over
Males 61.1% Never married30.2% Now married2.7% Separated3.6% Widowed2.4% DivorcedFemales 48.9% Never married34.9% Now married3.3% Separated1.4% Widowed11.5% DivorcedWomen who gave birth in the past 12 months Now married:
51.2% (46)Unmarried:
48.8% (44)
Women who did not give birth in the past 12 months Now married:
36.5% (489)Unmarried:
63.5% (851)
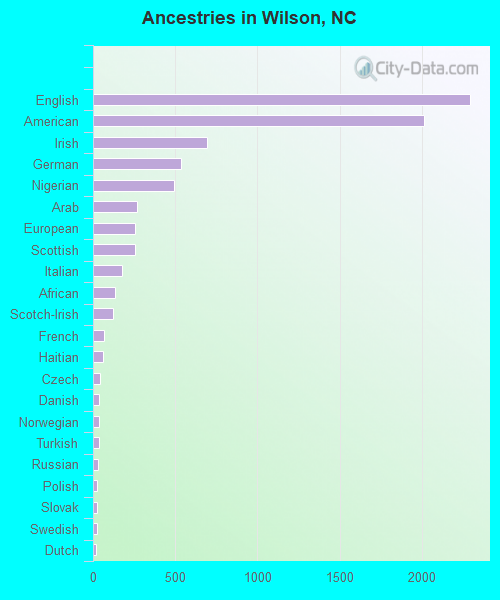
Ancestries in Wilson
2,293 7.5% English2,010 6.6% American695 2.3% Irish532 1.7% German491 1.6% Nigerian270 0.9% Arab257 0.8% European255 0.8% Scottish179 0.6% Italian134 0.4% African119 0.4% Scotch-Irish69 0.2% French58 0.2% Haitian41 0.1% Czech36 0.1% Danish35 0.1% Norwegian35 0.1% Turkish29 0.10% Russian26 0.09% Polish25 0.08% Slovak25 0.08% Swedish21 0.07% Dutch18 0.06% Greek16 0.05% Eastern European15 0.05% Brazilian10 0.03% Armenian9 0.03% Welsh8 0.03% British7 0.02% Lebanese6 0.02% Hungarian5 0.02% Northern European
Geographical mobility in Wilson Same house 1 year ago 14,164 87.2% White (Caucasian)17,899 78.0% Black or African American115 76.0% American Indian / Alaska Native442 76.5% Asian4,534 88.0% Other race2,141 84.9% Two or more races13,842 87.6% White alone, not Hispanic / Latino5,310 88.4% Hispanic or LatinoMoved within same county 702 4.3% White / Caucasian2,161 9.4% Black or African American12 8.2% American Indian / Alaska Native104 2.0% Other race267 10.6% Two or more races614 3.9% White alone, not Hispanic / Latino229 3.8% Hispanic or LatinoMoved within same state 1,330 8.2% White / Caucasian2,830 12.3% Black or African American15 9.7% American Indian / Alaska Native32 5.6% Asian573 11.1% Other race3 0.1% Two or more races1,272 8.1% White alone, not Hispanic / Latino522 8.7% Hispanic or LatinoMoved from different state 147 0.9% White / Caucasian127 0.6% Black or African American33 5.8% Asian3 0.0% Other race44 1.8% Two or more races147 0.9% White alone, not Hispanic / Latino10 0.2% Hispanic or LatinoMoved from abroad 68 0.4% White16 0.1% Black or African American80 13.9% Asian32 1.3% Two or more races56 0.4% White alone, not Hispanic / Latino19 0.3% Hispanic or Latino
Children Nativity (place of birth) in Wilson
Children under 6 years - Living with two parents Both parents native 1,030 100.0% NativeBoth parents foreign-born 236 100.0% NativeOne native, one foreign-born parent 36 100.0% NativeChildren under 6 years - Living with one parent Native parent 1,663 100.0% NativeForeign-born parent 211 100.0% NativeChildren 6 to 17 years - Living with two parents Both parents native 3,170 100.0% NativeBoth parents foreign-born 400 73.6% Native143 26.4% Foreign-bornOne native, one foreign-born parent 403 97.8% Native9 2.2% Foreign-bornChildren 6 to 17 years - Living with one parent Native parent 2,597 100.0% NativeForeign-born parent 507 51.0% Native487 49.0% Foreign-born
Grandparents responsible for own grandchildren in Wilson
Grandparents (30 to 59 years) White / Caucasian 32 34.5% Responsible for grandchildren60 65.5% Not responsible for grandchildrenBlack or African American 195 55.7% Responsible for grandchildren155 44.3% Not responsible for grandchildrenOther race 7 100.0% Responsible for grandchildrenWhite alone, not Hispanic / Latino 34 38.7% Responsible for grandchildren53 61.3% Not responsible for grandchildrenHispanic or Latino 5 29.2% Responsible for grandchildren13 70.8% Not responsible for grandchildrenGrandparents (60 years and over) White / Caucasian 29 34.9% Responsible for grandchildren53 65.1% Not responsible for grandchildrenBlack or African American 177 35.9% Responsible for grandchildren316 64.1% Not responsible for grandchildrenOther race 5 100.0% Not responsible for grandchildrenWhite alone, not Hispanic / Latino 29 35.0% Responsible for grandchildren54 65.0% Not responsible for grandchildrenHispanic or Latino 12 62.6% Responsible for grandchildren7 37.4% Not responsible for grandchildren