Races in Wilmette, Illinois (IL) Detailed Stats
Data:
Races - White alone (%)
Races - White alone (% change since 2000)
Races - Black alone (%)
Races - Black alone (% change since 2000)
Races - American Indian alone (%)
Races - American Indian alone (% change since 2000)
Races - Asian alone (%)
Races - Asian alone (% change since 2000)
Races - Hispanic (%)
Races - Hispanic (% change since 2000)
Races - Native Hawaiian and Other Pacific Islander alone (%)
Races - Native Hawaiian and Other Pacific Islander alone (% change since 2000)
Races - Two or more races(%)
Races - Two or more races(% change since 2000)
Races - Other race alone (%)
Races - Other race alone (% change since 2000)
Racial diversity
Place of birth - Born in state of residence (%)
Place of birth - Born in state of residence (%) - White
Place of birth - Born in state of residence (%) - Black or African American
Place of birth - Born in state of residence (%) - Asian
Place of birth - Born in state of residence (%) - Hispanic or Latino
Place of birth - Born in state of residence (%) - American Indian and Alaska Native
Place of birth - Born in state of residence (%) - Multirace
Place of birth - Born in state of residence (%) - Other Race
Place of birth - Born in other state (%)
Place of birth - Born in other state (%) - White
Place of birth - Born in other state (%) - Black or African American
Place of birth - Born in other state (%) - Asian
Place of birth - Born in other state (%) - Hispanic or Latino
Place of birth - Born in other state (%) - American Indian and Alaska Native
Place of birth - Born in other state (%) - Multirace
Place of birth - Born in other state (%) - Other Race
Place of birth - Native, outside of US (%)
Place of birth - Native, outside of US (%) - White
Place of birth - Native, outside of US (%) - Black or African American
Place of birth - Native, outside of US (%) - Asian
Place of birth - Native, outside of US (%) - Hispanic or Latino
Place of birth - Native, outside of US (%) - American Indian and Alaska Native
Place of birth - Native, outside of US (%) - Multirace
Place of birth - Native, outside of US (%) - Other Race
Place of birth - Foreign born (%)
Place of birth - Foreign born (%) - White
Place of birth - Foreign born (%) - Black or African American
Place of birth - Foreign born (%) - Asian
Place of birth - Foreign born (%) - Hispanic or Latino
Place of birth - Foreign born (%) - American Indian and Alaska Native
Place of birth - Foreign born (%) - Multirace
Place of birth - Foreign born (%) - Other Race
Residents speaking English at home (%)
Residents speaking English at home - Born in the United States (%)
Residents speaking English at home - Native, born elsewhere (%)
Residents speaking English at home - Foreign born (%)
Residents speaking Spanish at home (%)
Residents speaking Spanish at home - Born in the United States (%)
Residents speaking Spanish at home - Native, born elsewhere (%)
Residents speaking Spanish at home - Foreign born (%)
Residents speaking other language at home (%)
Residents speaking other language at home - Born in the United States (%)
Residents speaking other language at home - Native, born elsewhere (%)
Residents speaking other language at home - Foreign born (%)
Marital status - Never married (%)
Marital status - Now married (%)
Marital status - Separated (%)
Marital status - Widowed (%)
Marital status - Divorced (%)
Ancestries Reported - Arab (%)
Ancestries Reported - Czech (%)
Ancestries Reported - Danish (%)
Ancestries Reported - Dutch (%)
Ancestries Reported - English (%)
Ancestries Reported - French (%)
Ancestries Reported - French Canadian (%)
Ancestries Reported - German (%)
Ancestries Reported - Greek (%)
Ancestries Reported - Hungarian (%)
Ancestries Reported - Irish (%)
Ancestries Reported - Italian (%)
Ancestries Reported - Lithuanian (%)
Ancestries Reported - Norwegian (%)
Ancestries Reported - Polish (%)
Ancestries Reported - Portuguese (%)
Ancestries Reported - Russian (%)
Ancestries Reported - Scotch-Irish (%)
Ancestries Reported - Scottish (%)
Ancestries Reported - Slovak (%)
Ancestries Reported - Subsaharan African (%)
Ancestries Reported - Swedish (%)
Ancestries Reported - Swiss (%)
Ancestries Reported - Ukrainian (%)
Ancestries Reported - United States (%)
Ancestries Reported - Welsh (%)
Ancestries Reported - West Indian (%)
Ancestries Reported - Other (%)
Geographical mobility - Same house 1 year ago (%)
Geographical mobility - Same house 1 year ago (%) - White
Geographical mobility - Same house 1 year ago (%) - Black or African American
Geographical mobility - Same house 1 year ago (%) - Asian
Geographical mobility - Same house 1 year ago (%) - Hispanic or Latino
Geographical mobility - Same house 1 year ago (%) - American Indian and Alaska Native
Geographical mobility - Same house 1 year ago (%) - Multirace
Geographical mobility - Same house 1 year ago (%) - Other Race
Geographical mobility - Moved within same county (%)
Geographical mobility - Moved within same county (%) - White
Geographical mobility - Moved within same county (%) - Black or African American
Geographical mobility - Moved within same county (%) - Asian
Geographical mobility - Moved within same county (%) - Hispanic or Latino
Geographical mobility - Moved within same county (%) - American Indian and Alaska Native
Geographical mobility - Moved within same county (%) - Multirace
Geographical mobility - Moved within same county (%) - Other Race
Geographical mobility - Moved from different county within same state (%)
Geographical mobility - Moved from different county within same state (%) - White
Geographical mobility - Moved from different county within same state (%) - Black or African American
Geographical mobility - Moved from different county within same state (%) - Asian
Geographical mobility - Moved from different county within same state (%) - Hispanic or Latino
Geographical mobility - Moved from different county within same state (%) - American Indian and Alaska Native
Geographical mobility - Moved from different county within same state (%) - Multirace
Geographical mobility - Moved from different county within same state (%) - Other Race
Geographical mobility - Moved from different state (%)
Geographical mobility - Moved from different state (%) - White
Geographical mobility - Moved from different state (%) - Black or African American
Geographical mobility - Moved from different state (%) - Asian
Geographical mobility - Moved from different state (%) - Hispanic or Latino
Geographical mobility - Moved from different state (%) - American Indian and Alaska Native
Geographical mobility - Moved from different state (%) - Multirace
Geographical mobility - Moved from different state (%) - Other Race
Geographical mobility - Moved from abroad (%)
Geographical mobility - Moved from abroad (%) - White
Geographical mobility - Moved from abroad (%) - Black or African American
Geographical mobility - Moved from abroad (%) - Asian
Geographical mobility - Moved from abroad (%) - Hispanic or Latino
Geographical mobility - Moved from abroad (%) - American Indian and Alaska Native
Geographical mobility - Moved from abroad (%) - Multirace
Geographical mobility - Moved from abroad (%) - Other Race
Place of birth for the foreign-born population - Ireland (%)
Place of birth for the foreign-born population - Denmark (%)
Place of birth for the foreign-born population - Norway (%)
Place of birth for the foreign-born population - Sweden (%)
Place of birth for the foreign-born population - United Kingdom (%)
Place of birth for the foreign-born population - England (%)
Place of birth for the foreign-born population - Scotland (%)
Place of birth for the foreign-born population - Other Northern Europe (%)
Place of birth for the foreign-born population - Austria (%)
Place of birth for the foreign-born population - Belgium (%)
Place of birth for the foreign-born population - France (%)
Place of birth for the foreign-born population - Germany (%)
Place of birth for the foreign-born population - Netherlands (%)
Place of birth for the foreign-born population - Switzerland (%)
Place of birth for the foreign-born population - Other Western Europe (%)
Place of birth for the foreign-born population - Greece (%)
Place of birth for the foreign-born population - Italy (%)
Place of birth for the foreign-born population - Portugal (%)
Place of birth for the foreign-born population - Spain (%)
Place of birth for the foreign-born population - Other Southern Europe (%)
Place of birth for the foreign-born population - Albania (%)
Place of birth for the foreign-born population - Belarus (%)
Place of birth for the foreign-born population - Bosnia and Herzegovina (%)
Place of birth for the foreign-born population - Bulgaria (%)
Place of birth for the foreign-born population - Croatia (%)
Place of birth for the foreign-born population - Czechoslovakia (%)
Place of birth for the foreign-born population - Hungary (%)
Place of birth for the foreign-born population - Latvia (%)
Place of birth for the foreign-born population - Lithuania (%)
Place of birth for the foreign-born population - North Macedonia (Macedonia) (%)
Place of birth for the foreign-born population - Moldova (%)
Place of birth for the foreign-born population - Poland (%)
Place of birth for the foreign-born population - Romania (%)
Place of birth for the foreign-born population - Russia (%)
Place of birth for the foreign-born population - Serbia (%)
Place of birth for the foreign-born population - Ukraine (%)
Place of birth for the foreign-born population - Other Eastern Europe (%)
Place of birth for the foreign-born population - China (%)
Place of birth for the foreign-born population - Hong Kong (%)
Place of birth for the foreign-born population - Taiwan (%)
Place of birth for the foreign-born population - Japan (%)
Place of birth for the foreign-born population - Korea (%)
Place of birth for the foreign-born population - Other Eastern Asia (%)
Place of birth for the foreign-born population - Afghanistan (%)
Place of birth for the foreign-born population - Bangladesh (%)
Place of birth for the foreign-born population - India (%)
Place of birth for the foreign-born population - Iran (%)
Place of birth for the foreign-born population - Kazakhstan (%)
Place of birth for the foreign-born population - Nepal (%)
Place of birth for the foreign-born population - Pakistan (%)
Place of birth for the foreign-born population - Sri Lanka (%)
Place of birth for the foreign-born population - Uzbekistan (%)
Place of birth for the foreign-born population - Other South Central Asia (%)
Place of birth for the foreign-born population - Burma (%)
Place of birth for the foreign-born population - Cambodia (%)
Place of birth for the foreign-born population - Indonesia (%)
Place of birth for the foreign-born population - Laos (%)
Place of birth for the foreign-born population - Malaysia (%)
Place of birth for the foreign-born population - Philippines (%)
Place of birth for the foreign-born population - Singapore (%)
Place of birth for the foreign-born population - Thailand (%)
Place of birth for the foreign-born population - Vietnam (%)
Place of birth for the foreign-born population - Other South Eastern Asia (%)
Place of birth for the foreign-born population - Armenia (%)
Place of birth for the foreign-born population - Iraq (%)
Place of birth for the foreign-born population - Israel (%)
Place of birth for the foreign-born population - Jordan (%)
Place of birth for the foreign-born population - Kuwait (%)
Place of birth for the foreign-born population - Lebanon (%)
Place of birth for the foreign-born population - Saudi Arabia (%)
Place of birth for the foreign-born population - Syria (%)
Place of birth for the foreign-born population - Turkey (%)
Place of birth for the foreign-born population - Yemen (%)
Place of birth for the foreign-born population - Other Western Asia (%)
Place of birth for the foreign-born population - Eritrea (%)
Place of birth for the foreign-born population - Ethiopia (%)
Place of birth for the foreign-born population - Kenya (%)
Place of birth for the foreign-born population - Somalia (%)
Place of birth for the foreign-born population - Uganda (%)
Place of birth for the foreign-born population - Zimbabwe (%)
Place of birth for the foreign-born population - Other Eastern Africa (%)
Place of birth for the foreign-born population - Cameroon (%)
Place of birth for the foreign-born population - Congo (%)
Place of birth for the foreign-born population - Democratic Republic of Congo (Zaire) (%)
Place of birth for the foreign-born population - Other Middle Africa (%)
Place of birth for the foreign-born population - Egypt (%)
Place of birth for the foreign-born population - Morocco (%)
Place of birth for the foreign-born population - Sudan (%)
Place of birth for the foreign-born population - Other Northern Africa (%)
Place of birth for the foreign-born population - South Africa (%)
Place of birth for the foreign-born population - Other Southern Africa (%)
Place of birth for the foreign-born population - Cabo Verde (%)
Place of birth for the foreign-born population - Ghana (%)
Place of birth for the foreign-born population - Liberia (%)
Place of birth for the foreign-born population - Nigeria (%)
Place of birth for the foreign-born population - Senegal (%)
Place of birth for the foreign-born population - Sierra Leone (%)
Place of birth for the foreign-born population - Other Western Africa (%)
Place of birth for the foreign-born population - Australia (%)
Place of birth for the foreign-born population - New Zealand (%)
Place of birth for the foreign-born population - Fiji (%)
Place of birth for the foreign-born population - Micronesia (%)
Place of birth for the foreign-born population - Bahamas (%)
Place of birth for the foreign-born population - Barbados (%)
Place of birth for the foreign-born population - Cuba (%)
Place of birth for the foreign-born population - Dominica (%)
Place of birth for the foreign-born population - Dominican Republic (%)
Place of birth for the foreign-born population - Grenada (%)
Place of birth for the foreign-born population - Haiti (%)
Place of birth for the foreign-born population - Jamaica (%)
Place of birth for the foreign-born population - St. Vincent and the Grenadines (%)
Place of birth for the foreign-born population - Trinidad and Tobago (%)
Place of birth for the foreign-born population - West Indies (%)
Place of birth for the foreign-born population - Other Caribbean (%)
Place of birth for the foreign-born population - Belize (%)
Place of birth for the foreign-born population - Costa Rica (%)
Place of birth for the foreign-born population - El Salvador (%)
Place of birth for the foreign-born population - Guatemala (%)
Place of birth for the foreign-born population - Honduras (%)
Place of birth for the foreign-born population - Mexico (%)
Place of birth for the foreign-born population - Nicaragua (%)
Place of birth for the foreign-born population - Panama (%)
Place of birth for the foreign-born population - Other Central America (%)
Place of birth for the foreign-born population - Argentina (%)
Place of birth for the foreign-born population - Bolivia (%)
Place of birth for the foreign-born population - Brazil (%)
Place of birth for the foreign-born population - Chile (%)
Place of birth for the foreign-born population - Colombia (%)
Place of birth for the foreign-born population - Ecuador (%)
Place of birth for the foreign-born population - Guyana (%)
Place of birth for the foreign-born population - Peru (%)
Place of birth for the foreign-born population - Uruguay (%)
Place of birth for the foreign-born population - Venezuela (%)
Place of birth for the foreign-born population - Other South America (%)
Place of birth for the foreign-born population - Canada (%)
Place of birth for the foreign-born population - Other Northern America (%)
Place of birth for the foreign-born population - Other (%)
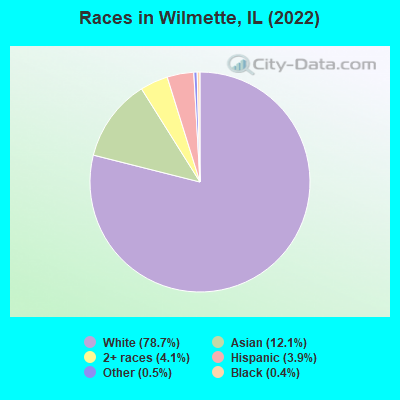
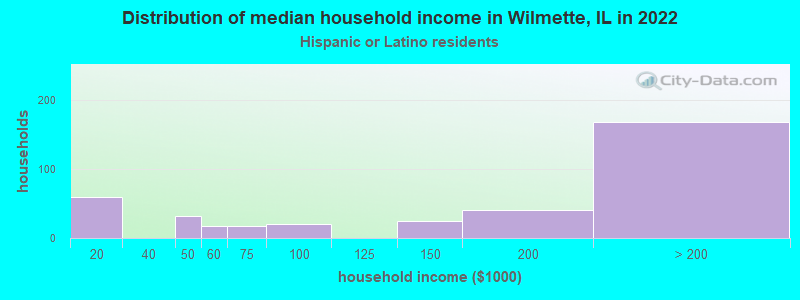
According to 2022 data, the most numerous races in Wilmette, IL are White alone (21,397 residents), Hispanic (1,066 residents), and Black alone (101 residents). 80.4% of Wilmette residents speak English at home. 15.5% of Wilmette, IL residents are foreign-born (8.0% born in Asia, 5.6% born in Europe), which is 9.8% greater than the foreign-born rate of 14.0% across the entire state of Illinois.
Race distribution in Wilmette
2000 2022
8,424,140 67.8% White alone 1,856,152 14.9% Black alone 1,530,262 12.3% Hispanic 419,916 3.4% Asian alone 153,996 1.2% Two or more races 13,479 0.1% Other race alone 18,232 0.1% American Indian alone 3,116 0.03% Native Hawaiian and Other
7,356,301 58.5% White alone 2,299,726 18.3% Hispanic 1,660,423 13.2% Black alone 747,296 5.9% Asian alone 458,599 3.6% Two or more races 45,386 0.4% Other race alone 10,405 0.08% American Indian alone 3,896 0.03% Native Hawaiian and Other
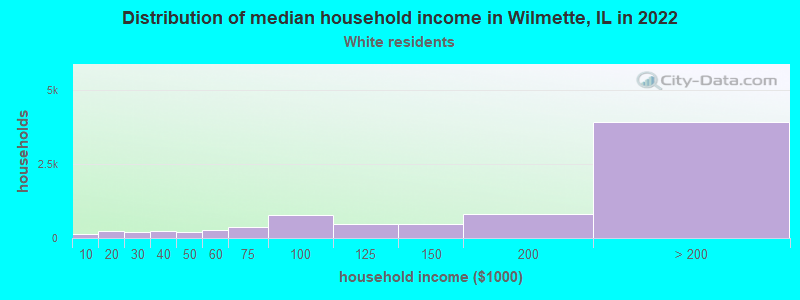
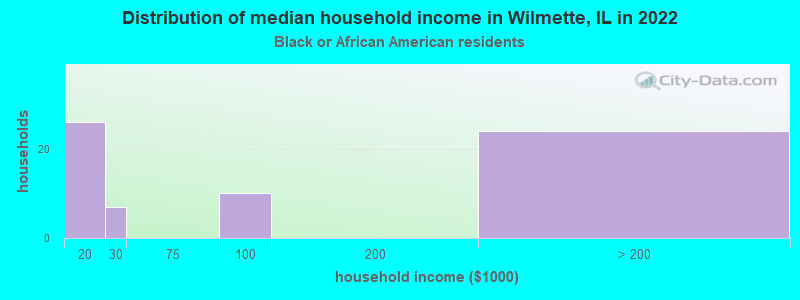
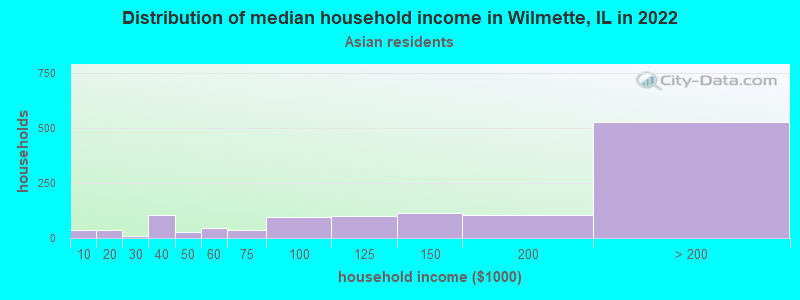
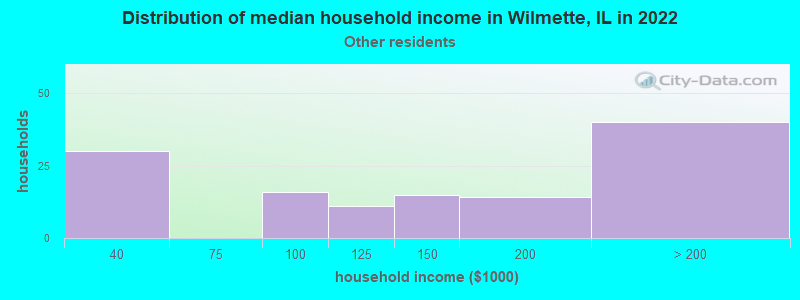
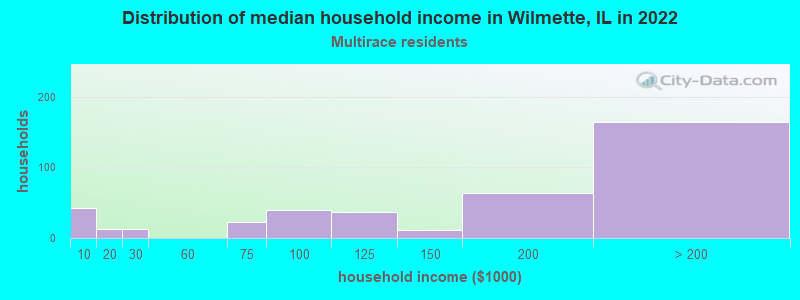
Income and house value in Wilmette Median household income in 2022 $185,251 White non-Hispanic householders$139,013 Asian householders$131,460 Some other race householders$166,877 Two or more races householders$196,057 Hispanic or Latino race householdersMedian 2022 house value $851,739 White Non-Hispanic householders$585,780 Black or African American householders$102,506 American Indian or Alaska Native householders $553,910 Asian householders$652,317 Native Hawaiian and other Pacific Islander householders$483,832 Some other race householders$306,775 Two or more races householders$615,973 Hispanic or Latino householders
Median age by race in Wilmette
48.9 Median age for White residents47.5 50.3 48.7 Median age for Black or African American residents61.9 35.5 42.2 Median age for American Indian / Alaska Native residents-736,736,736.0 39.7 46.1 Median age for Asian residents45.5 46.4 -687,999,999.3 Median age for Native Hawaiian / Pacific Islander residents-918,721,460.3 -610,229,276.3 43.6 Median age for Other race residents48.1 39.5 18.6 Median age for Two or more races residents17.4 20.0 47.5 Median age for White alone residents46.7 48.6 35.6 Median age for Hispanic or Latino residents41.5 23.3
Owner/renter occupied households by race in Wilmette
House owners and renters - White residents 7,175 88.2% Owner occupied965 11.8% Renter occupiedHouse owners and renters - Black or African American residents 25 37.2% Owner occupied43 62.8% Renter occupiedHouse owners and renters - American Indian / Alaska Native residents 13 100.0% Owner occupiedHouse owners and renters - Asian residents 1,084 84.9% Owner occupied193 15.1% Renter occupiedHouse owners and renters - Other race residents 116 84.2% Owner occupied22 15.8% Renter occupiedHouse owners and renters - Two or more races residents 385 91.3% Owner occupied37 8.7% Renter occupiedHouse owners and renters - White alone residents 7,413 87.7% Owner occupied1,037 12.3% Renter occupiedHouse owners and renters - Hispanic or Latino residents 350 93.0% Owner occupied26 7.0% Renter occupied
Language usage in Wilmette
English speakers - Total 80.4% of residents of Wilmette speak English at home.
3.5% of residents speak Spanish at home 855 95.0% Speak English very well45 5.0% Speak English less than very well15.8% of residents speak other language at home 2,858 70.8% Speak English very well1,178 29.2% Speak English less than very well
English speakers - Born in the United States 93.0% of residents of Wilmette speak English at home.
1.8% of residents speak Spanish at home 136 100.0% Speak English very well5.3% of residents speak other language at home 330 83.3% Speak English very well66 16.7% Speak English less than very well
English speakers - Native, born elsewhere 89.8% of residents of Wilmette speak English at home.
2.9% of residents speak Spanish at home 11 100.0% Speak English very well8.7% of residents speak other language at home 33 100.0% Speak English very well
English speakers - Foreign-born 25.7% of residents of Wilmette speak English at home.
3.2% of residents speak Spanish at home 136 100.0% Speak English very well69.5% of residents speak other language at home 1,895 64.6% Speak English very well1,040 35.4% Speak English less than very well
White (Caucasian) - Speak only English Native:
98.6% (16,969)Foreign-born:
35.0% (534)
White (Caucasian) - Speak another language Native:
4.2% (729)Foreign-born:
66.6% (1,016)
Asian - Speak only English Native:
68.9% (778)Foreign-born:
18.7% (378)
Asian - Speak another language Native:
31.2% (353)Foreign-born:
80.2% (1,616)
Other race - Speak only English Native:
56.3% (163)Foreign-born:
16.5% (10)
Other race - Speak another language Native:
46.4% (135)Foreign-born:
82.0% (52)
Two or more races - Speak only English Native:
69.0% (944)Foreign-born:
43.6% (102)
Two or more races - Speak another language Native:
29.5% (403)Foreign-born:
56.4% (133)
White alone - Speak only English Native:
93.8% (17,080)Foreign-born:
30.6% (583)
White alone - Speak another language Native:
6.0% (1,084)Foreign-born:
67.7% (1,289)
Hispanic or Latino - Speak only English Native:
66.1% (522)Foreign-born:
28.7% (58)
Hispanic or Latino - Speak another language Native:
36.0% (284)Foreign-born:
68.4% (137)
Foreign-born residents in Wilmette 4,221 residents are foreign born (8.0% Asia , 5.6% Europe ).
This city:
15.5%Illinois:
14.1%
Marital status for residents in Wilmette Marital status - White (Caucasian) population 15 years and over
Males 20.8% Never married69.6% Now married0.2% Separated3.5% Widowed5.8% DivorcedFemales 17.7% Never married61.2% Now married0.5% Separated9.9% Widowed10.6% DivorcedWomen who gave birth in the past 12 months Now married:
100.0% (233)Unmarried:
0.0% (0)
Women who did not give birth in the past 12 months Now married:
58.7% (1,819)Unmarried:
41.3% (1,279)
Marital status - Black or African American population 15 years and over
Males 76.9% Never married23.1% Now married0.0% Separated0.0% Widowed0.0% DivorcedFemales 58.6% Never married0.0% Now married0.0% Separated6.9% Widowed34.5% DivorcedWomen who did not give birth in the past 12 months Now married:
0.0% (0)Unmarried:
100.0% (85)
Marital status - Asian population 15 years and over
Males 19.8% Never married66.8% Now married0.9% Separated1.9% Widowed10.7% DivorcedFemales 14.4% Never married72.5% Now married0.9% Separated5.1% Widowed7.0% DivorcedWomen who gave birth in the past 12 months Now married:
100.0% (33)Unmarried:
0.0% (0)
Women who did not give birth in the past 12 months Now married:
64.0% (463)Unmarried:
36.0% (261)
Marital status - Other race population 15 years and over
Males 15.2% Never married84.8% Now married0.0% Separated0.0% Widowed0.0% DivorcedFemales 27.0% Never married73.0% Now married0.0% Separated0.0% Widowed0.0% DivorcedWomen who did not give birth in the past 12 months Now married:
50.0% (38)Unmarried:
50.0% (38)
Marital status - Two or more races population 15 years and over
Males 38.9% Never married58.3% Now married0.0% Separated2.9% Widowed0.0% DivorcedFemales 33.8% Never married57.1% Now married0.0% Separated2.7% Widowed6.4% DivorcedWomen who did not give birth in the past 12 months Now married:
44.1% (135)Unmarried:
55.9% (171)
Marital status - White alone, not Hispanic / Latino population 15 years and over
Males 20.6% Never married69.7% Now married0.2% Separated3.6% Widowed5.9% DivorcedFemales 17.9% Never married61.8% Now married0.6% Separated9.7% Widowed10.1% DivorcedWomen who gave birth in the past 12 months Now married:
100.0% (262)Unmarried:
0.0% (0)
Women who did not give birth in the past 12 months Now married:
58.6% (2,018)Unmarried:
41.4% (1,426)
Marital status - Hispanic or Latino population 15 years and over
Males 28.3% Never married71.7% Now married0.0% Separated0.0% Widowed0.0% DivorcedFemales 37.4% Never married38.0% Now married0.0% Separated6.9% Widowed17.7% DivorcedWomen who did not give birth in the past 12 months Now married:
28.4% (71)Unmarried:
71.6% (179)
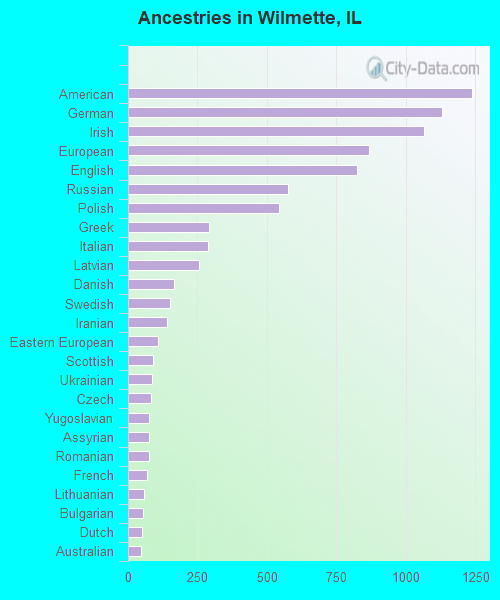
Ancestries in Wilmette
1,237 9.8% American1,130 9.0% German1,065 8.5% Irish866 6.9% European825 6.5% English574 4.6% Russian542 4.3% Polish293 2.3% Greek288 2.3% Italian256 2.0% Latvian164 1.3% Danish152 1.2% Swedish141 1.1% Iranian107 0.8% Eastern European91 0.7% Scottish87 0.7% Ukrainian84 0.7% Czech76 0.6% Yugoslavian75 0.6% Assyrian74 0.6% Romanian67 0.5% French59 0.5% Lithuanian55 0.4% Bulgarian50 0.4% Dutch45 0.4% Australian42 0.3% Serbian39 0.3% Syrian39 0.3% Welsh38 0.3% Canadian38 0.3% Turkish36 0.3% British31 0.2% Afghan30 0.2% French Canadian29 0.2% Northern European24 0.2% Croatian22 0.2% Hungarian22 0.2% Slovak20 0.2% Belgian19 0.2% Swiss19 0.2% Scotch-Irish18 0.1% Lebanese13 0.1% Scandinavian12 0.10% Albanian12 0.10% Armenian12 0.10% Israeli11 0.09% Haitian10 0.08% Slovene8 0.06% Iraqi8 0.06% Austrian7 0.06% Norwegian7 0.06% Slavic6 0.05% Finnish5 0.04% Egyptian1 0.01% Macedonian
Geographical mobility in Wilmette Same house 1 year ago 17,594 90.4% White (Caucasian)185 91.3% Black or African American2,670 82.6% Asian264 69.0% Other race1,496 86.7% Two or more races19,324 91.1% White alone, not Hispanic / Latino840 80.1% Hispanic or LatinoMoved within same county 1,094 5.6% White / Caucasian17 8.2% Black or African American50 100.0% American Indian / Alaska Native368 11.4% Asian12 3.0% Other race70 4.1% Two or more races1,160 5.5% White alone, not Hispanic / Latino87 8.3% Hispanic or LatinoMoved within same state 227 1.2% White / Caucasian33 1.9% Two or more races176 0.8% White alone, not Hispanic / Latino105 10.0% Hispanic or LatinoMoved from different state 305 1.6% White / Caucasian20 0.6% Asian89 23.2% Other race4 0.2% Two or more races314 1.5% White alone, not Hispanic / Latino21 2.0% Hispanic or LatinoMoved from abroad 178 0.9% White177 5.5% Asian9 2.4% Other race162 9.4% Two or more races194 0.9% White alone, not Hispanic / Latino11 1.0% Hispanic or Latino
Children Nativity (place of birth) in Wilmette
Children under 6 years - Living with two parents Both parents native 1,340 100.0% NativeBoth parents foreign-born 123 100.0% NativeOne native, one foreign-born parent 295 100.0% NativeChildren under 6 years - Living with one parent Native parent 37 100.0% NativeChildren 6 to 17 years - Living with two parents Both parents native 3,682 100.0% NativeBoth parents foreign-born 539 78.8% Native145 21.2% Foreign-bornOne native, one foreign-born parent 667 97.4% Native18 2.6% Foreign-bornChildren 6 to 17 years - Living with one parent Native parent 585 100.0% NativeForeign-born parent 78 50.1% Native78 49.9% Foreign-born