Races in Willow Grove, Pennsylvania (PA) Detailed Stats
Data:
Races - White alone (%)
Races - White alone (% change since 2000)
Races - Black alone (%)
Races - Black alone (% change since 2000)
Races - American Indian alone (%)
Races - American Indian alone (% change since 2000)
Races - Asian alone (%)
Races - Asian alone (% change since 2000)
Races - Hispanic (%)
Races - Hispanic (% change since 2000)
Races - Native Hawaiian and Other Pacific Islander alone (%)
Races - Native Hawaiian and Other Pacific Islander alone (% change since 2000)
Races - Two or more races(%)
Races - Two or more races(% change since 2000)
Races - Other race alone (%)
Races - Other race alone (% change since 2000)
Racial diversity
Place of birth - Born in state of residence (%)
Place of birth - Born in state of residence (%) - White
Place of birth - Born in state of residence (%) - Black or African American
Place of birth - Born in state of residence (%) - Asian
Place of birth - Born in state of residence (%) - Hispanic or Latino
Place of birth - Born in state of residence (%) - American Indian and Alaska Native
Place of birth - Born in state of residence (%) - Multirace
Place of birth - Born in state of residence (%) - Other Race
Place of birth - Born in other state (%)
Place of birth - Born in other state (%) - White
Place of birth - Born in other state (%) - Black or African American
Place of birth - Born in other state (%) - Asian
Place of birth - Born in other state (%) - Hispanic or Latino
Place of birth - Born in other state (%) - American Indian and Alaska Native
Place of birth - Born in other state (%) - Multirace
Place of birth - Born in other state (%) - Other Race
Place of birth - Native, outside of US (%)
Place of birth - Native, outside of US (%) - White
Place of birth - Native, outside of US (%) - Black or African American
Place of birth - Native, outside of US (%) - Asian
Place of birth - Native, outside of US (%) - Hispanic or Latino
Place of birth - Native, outside of US (%) - American Indian and Alaska Native
Place of birth - Native, outside of US (%) - Multirace
Place of birth - Native, outside of US (%) - Other Race
Place of birth - Foreign born (%)
Place of birth - Foreign born (%) - White
Place of birth - Foreign born (%) - Black or African American
Place of birth - Foreign born (%) - Asian
Place of birth - Foreign born (%) - Hispanic or Latino
Place of birth - Foreign born (%) - American Indian and Alaska Native
Place of birth - Foreign born (%) - Multirace
Place of birth - Foreign born (%) - Other Race
Residents speaking English at home (%)
Residents speaking English at home - Born in the United States (%)
Residents speaking English at home - Native, born elsewhere (%)
Residents speaking English at home - Foreign born (%)
Residents speaking Spanish at home (%)
Residents speaking Spanish at home - Born in the United States (%)
Residents speaking Spanish at home - Native, born elsewhere (%)
Residents speaking Spanish at home - Foreign born (%)
Residents speaking other language at home (%)
Residents speaking other language at home - Born in the United States (%)
Residents speaking other language at home - Native, born elsewhere (%)
Residents speaking other language at home - Foreign born (%)
Marital status - Never married (%)
Marital status - Now married (%)
Marital status - Separated (%)
Marital status - Widowed (%)
Marital status - Divorced (%)
Ancestries Reported - Arab (%)
Ancestries Reported - Czech (%)
Ancestries Reported - Danish (%)
Ancestries Reported - Dutch (%)
Ancestries Reported - English (%)
Ancestries Reported - French (%)
Ancestries Reported - French Canadian (%)
Ancestries Reported - German (%)
Ancestries Reported - Greek (%)
Ancestries Reported - Hungarian (%)
Ancestries Reported - Irish (%)
Ancestries Reported - Italian (%)
Ancestries Reported - Lithuanian (%)
Ancestries Reported - Norwegian (%)
Ancestries Reported - Polish (%)
Ancestries Reported - Portuguese (%)
Ancestries Reported - Russian (%)
Ancestries Reported - Scotch-Irish (%)
Ancestries Reported - Scottish (%)
Ancestries Reported - Slovak (%)
Ancestries Reported - Subsaharan African (%)
Ancestries Reported - Swedish (%)
Ancestries Reported - Swiss (%)
Ancestries Reported - Ukrainian (%)
Ancestries Reported - United States (%)
Ancestries Reported - Welsh (%)
Ancestries Reported - West Indian (%)
Ancestries Reported - Other (%)
Geographical mobility - Same house 1 year ago (%)
Geographical mobility - Same house 1 year ago (%) - White
Geographical mobility - Same house 1 year ago (%) - Black or African American
Geographical mobility - Same house 1 year ago (%) - Asian
Geographical mobility - Same house 1 year ago (%) - Hispanic or Latino
Geographical mobility - Same house 1 year ago (%) - American Indian and Alaska Native
Geographical mobility - Same house 1 year ago (%) - Multirace
Geographical mobility - Same house 1 year ago (%) - Other Race
Geographical mobility - Moved within same county (%)
Geographical mobility - Moved within same county (%) - White
Geographical mobility - Moved within same county (%) - Black or African American
Geographical mobility - Moved within same county (%) - Asian
Geographical mobility - Moved within same county (%) - Hispanic or Latino
Geographical mobility - Moved within same county (%) - American Indian and Alaska Native
Geographical mobility - Moved within same county (%) - Multirace
Geographical mobility - Moved within same county (%) - Other Race
Geographical mobility - Moved from different county within same state (%)
Geographical mobility - Moved from different county within same state (%) - White
Geographical mobility - Moved from different county within same state (%) - Black or African American
Geographical mobility - Moved from different county within same state (%) - Asian
Geographical mobility - Moved from different county within same state (%) - Hispanic or Latino
Geographical mobility - Moved from different county within same state (%) - American Indian and Alaska Native
Geographical mobility - Moved from different county within same state (%) - Multirace
Geographical mobility - Moved from different county within same state (%) - Other Race
Geographical mobility - Moved from different state (%)
Geographical mobility - Moved from different state (%) - White
Geographical mobility - Moved from different state (%) - Black or African American
Geographical mobility - Moved from different state (%) - Asian
Geographical mobility - Moved from different state (%) - Hispanic or Latino
Geographical mobility - Moved from different state (%) - American Indian and Alaska Native
Geographical mobility - Moved from different state (%) - Multirace
Geographical mobility - Moved from different state (%) - Other Race
Geographical mobility - Moved from abroad (%)
Geographical mobility - Moved from abroad (%) - White
Geographical mobility - Moved from abroad (%) - Black or African American
Geographical mobility - Moved from abroad (%) - Asian
Geographical mobility - Moved from abroad (%) - Hispanic or Latino
Geographical mobility - Moved from abroad (%) - American Indian and Alaska Native
Geographical mobility - Moved from abroad (%) - Multirace
Geographical mobility - Moved from abroad (%) - Other Race
Place of birth for the foreign-born population - Ireland (%)
Place of birth for the foreign-born population - Denmark (%)
Place of birth for the foreign-born population - Norway (%)
Place of birth for the foreign-born population - Sweden (%)
Place of birth for the foreign-born population - United Kingdom (%)
Place of birth for the foreign-born population - England (%)
Place of birth for the foreign-born population - Scotland (%)
Place of birth for the foreign-born population - Other Northern Europe (%)
Place of birth for the foreign-born population - Austria (%)
Place of birth for the foreign-born population - Belgium (%)
Place of birth for the foreign-born population - France (%)
Place of birth for the foreign-born population - Germany (%)
Place of birth for the foreign-born population - Netherlands (%)
Place of birth for the foreign-born population - Switzerland (%)
Place of birth for the foreign-born population - Other Western Europe (%)
Place of birth for the foreign-born population - Greece (%)
Place of birth for the foreign-born population - Italy (%)
Place of birth for the foreign-born population - Portugal (%)
Place of birth for the foreign-born population - Spain (%)
Place of birth for the foreign-born population - Other Southern Europe (%)
Place of birth for the foreign-born population - Albania (%)
Place of birth for the foreign-born population - Belarus (%)
Place of birth for the foreign-born population - Bosnia and Herzegovina (%)
Place of birth for the foreign-born population - Bulgaria (%)
Place of birth for the foreign-born population - Croatia (%)
Place of birth for the foreign-born population - Czechoslovakia (%)
Place of birth for the foreign-born population - Hungary (%)
Place of birth for the foreign-born population - Latvia (%)
Place of birth for the foreign-born population - Lithuania (%)
Place of birth for the foreign-born population - North Macedonia (Macedonia) (%)
Place of birth for the foreign-born population - Moldova (%)
Place of birth for the foreign-born population - Poland (%)
Place of birth for the foreign-born population - Romania (%)
Place of birth for the foreign-born population - Russia (%)
Place of birth for the foreign-born population - Serbia (%)
Place of birth for the foreign-born population - Ukraine (%)
Place of birth for the foreign-born population - Other Eastern Europe (%)
Place of birth for the foreign-born population - China (%)
Place of birth for the foreign-born population - Hong Kong (%)
Place of birth for the foreign-born population - Taiwan (%)
Place of birth for the foreign-born population - Japan (%)
Place of birth for the foreign-born population - Korea (%)
Place of birth for the foreign-born population - Other Eastern Asia (%)
Place of birth for the foreign-born population - Afghanistan (%)
Place of birth for the foreign-born population - Bangladesh (%)
Place of birth for the foreign-born population - India (%)
Place of birth for the foreign-born population - Iran (%)
Place of birth for the foreign-born population - Kazakhstan (%)
Place of birth for the foreign-born population - Nepal (%)
Place of birth for the foreign-born population - Pakistan (%)
Place of birth for the foreign-born population - Sri Lanka (%)
Place of birth for the foreign-born population - Uzbekistan (%)
Place of birth for the foreign-born population - Other South Central Asia (%)
Place of birth for the foreign-born population - Burma (%)
Place of birth for the foreign-born population - Cambodia (%)
Place of birth for the foreign-born population - Indonesia (%)
Place of birth for the foreign-born population - Laos (%)
Place of birth for the foreign-born population - Malaysia (%)
Place of birth for the foreign-born population - Philippines (%)
Place of birth for the foreign-born population - Singapore (%)
Place of birth for the foreign-born population - Thailand (%)
Place of birth for the foreign-born population - Vietnam (%)
Place of birth for the foreign-born population - Other South Eastern Asia (%)
Place of birth for the foreign-born population - Armenia (%)
Place of birth for the foreign-born population - Iraq (%)
Place of birth for the foreign-born population - Israel (%)
Place of birth for the foreign-born population - Jordan (%)
Place of birth for the foreign-born population - Kuwait (%)
Place of birth for the foreign-born population - Lebanon (%)
Place of birth for the foreign-born population - Saudi Arabia (%)
Place of birth for the foreign-born population - Syria (%)
Place of birth for the foreign-born population - Turkey (%)
Place of birth for the foreign-born population - Yemen (%)
Place of birth for the foreign-born population - Other Western Asia (%)
Place of birth for the foreign-born population - Eritrea (%)
Place of birth for the foreign-born population - Ethiopia (%)
Place of birth for the foreign-born population - Kenya (%)
Place of birth for the foreign-born population - Somalia (%)
Place of birth for the foreign-born population - Uganda (%)
Place of birth for the foreign-born population - Zimbabwe (%)
Place of birth for the foreign-born population - Other Eastern Africa (%)
Place of birth for the foreign-born population - Cameroon (%)
Place of birth for the foreign-born population - Congo (%)
Place of birth for the foreign-born population - Democratic Republic of Congo (Zaire) (%)
Place of birth for the foreign-born population - Other Middle Africa (%)
Place of birth for the foreign-born population - Egypt (%)
Place of birth for the foreign-born population - Morocco (%)
Place of birth for the foreign-born population - Sudan (%)
Place of birth for the foreign-born population - Other Northern Africa (%)
Place of birth for the foreign-born population - South Africa (%)
Place of birth for the foreign-born population - Other Southern Africa (%)
Place of birth for the foreign-born population - Cabo Verde (%)
Place of birth for the foreign-born population - Ghana (%)
Place of birth for the foreign-born population - Liberia (%)
Place of birth for the foreign-born population - Nigeria (%)
Place of birth for the foreign-born population - Senegal (%)
Place of birth for the foreign-born population - Sierra Leone (%)
Place of birth for the foreign-born population - Other Western Africa (%)
Place of birth for the foreign-born population - Australia (%)
Place of birth for the foreign-born population - New Zealand (%)
Place of birth for the foreign-born population - Fiji (%)
Place of birth for the foreign-born population - Micronesia (%)
Place of birth for the foreign-born population - Bahamas (%)
Place of birth for the foreign-born population - Barbados (%)
Place of birth for the foreign-born population - Cuba (%)
Place of birth for the foreign-born population - Dominica (%)
Place of birth for the foreign-born population - Dominican Republic (%)
Place of birth for the foreign-born population - Grenada (%)
Place of birth for the foreign-born population - Haiti (%)
Place of birth for the foreign-born population - Jamaica (%)
Place of birth for the foreign-born population - St. Vincent and the Grenadines (%)
Place of birth for the foreign-born population - Trinidad and Tobago (%)
Place of birth for the foreign-born population - West Indies (%)
Place of birth for the foreign-born population - Other Caribbean (%)
Place of birth for the foreign-born population - Belize (%)
Place of birth for the foreign-born population - Costa Rica (%)
Place of birth for the foreign-born population - El Salvador (%)
Place of birth for the foreign-born population - Guatemala (%)
Place of birth for the foreign-born population - Honduras (%)
Place of birth for the foreign-born population - Mexico (%)
Place of birth for the foreign-born population - Nicaragua (%)
Place of birth for the foreign-born population - Panama (%)
Place of birth for the foreign-born population - Other Central America (%)
Place of birth for the foreign-born population - Argentina (%)
Place of birth for the foreign-born population - Bolivia (%)
Place of birth for the foreign-born population - Brazil (%)
Place of birth for the foreign-born population - Chile (%)
Place of birth for the foreign-born population - Colombia (%)
Place of birth for the foreign-born population - Ecuador (%)
Place of birth for the foreign-born population - Guyana (%)
Place of birth for the foreign-born population - Peru (%)
Place of birth for the foreign-born population - Uruguay (%)
Place of birth for the foreign-born population - Venezuela (%)
Place of birth for the foreign-born population - Other South America (%)
Place of birth for the foreign-born population - Canada (%)
Place of birth for the foreign-born population - Other Northern America (%)
Place of birth for the foreign-born population - Other (%)
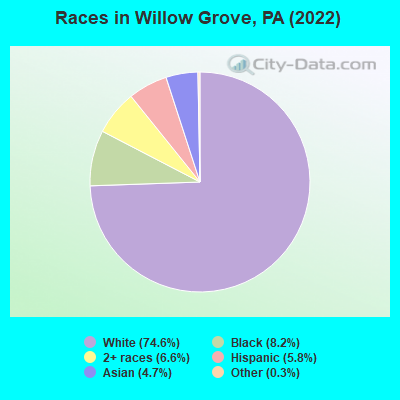
According to 2022 data, the most numerous races in Willow Grove, PA are White alone (10,362 residents), Black alone (1,136 residents), and Hispanic (799 residents). 89.0% of Willow Grove residents speak English at home. 8.4% of Willow Grove, PA residents are foreign-born (3.6% born in Asia, 2.3% born in Latin America, 1.6% born in Europe), which is 16.8% greater than the foreign-born rate of 7.0% across the entire state of Pennsylvania.
Race distribution in Willow Grove
2000 2022
10,322,455 84.1% White alone 1,202,437 9.8% Black alone 394,088 3.2% Hispanic 218,296 1.8% Asian alone 113,097 0.9% Two or more races 13,086 0.1% Other race alone 14,904 0.1% American Indian alone 2,691 0.02% Native Hawaiian and Other
9,487,228 73.1% White alone 1,311,581 10.1% Black alone 1,115,997 8.6% Hispanic 493,942 3.8% Two or more races 487,124 3.8% Asian alone 63,582 0.5% Other race alone 10,130 0.08% American Indian alone 2,424 0.02% Native Hawaiian and Other
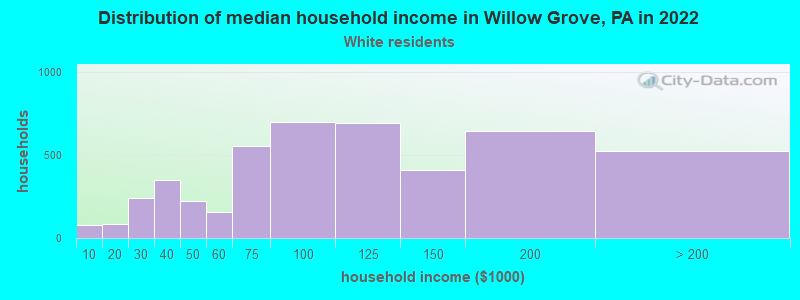
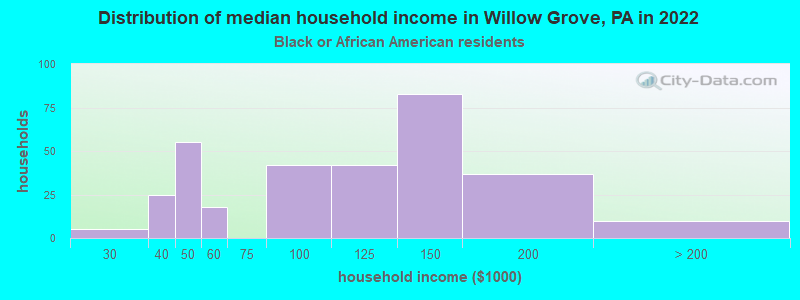
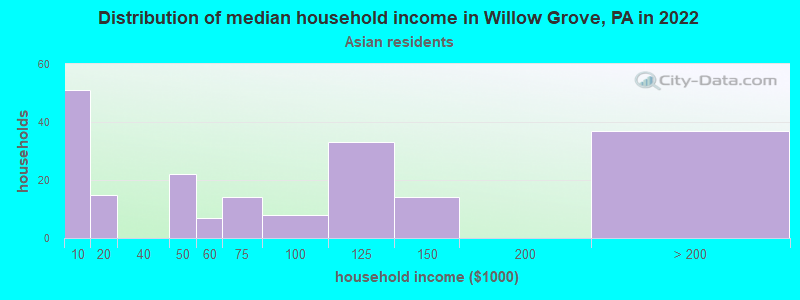
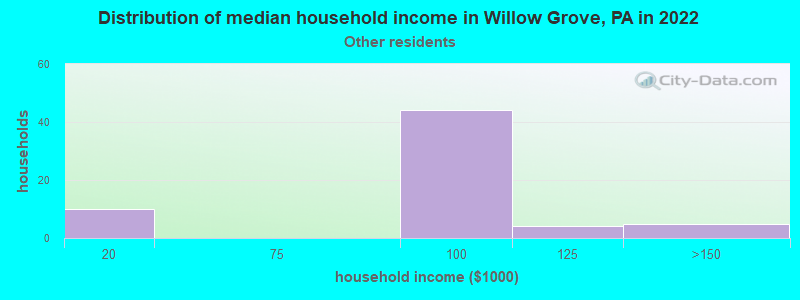
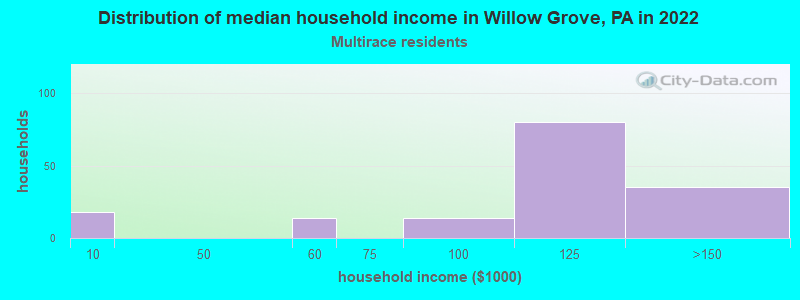
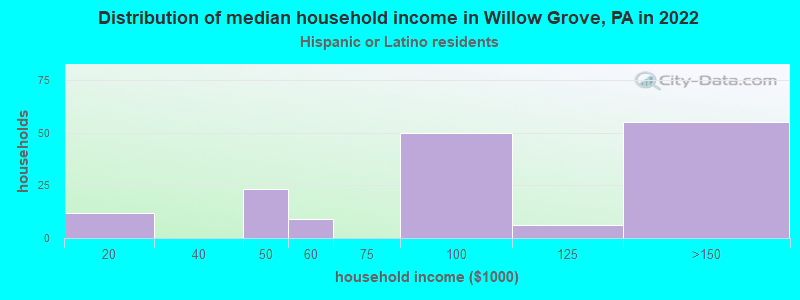
Income and house value in Willow Grove Median household income in 2022 $95,078 White non-Hispanic householders$94,670 Black householders$75,673 Asian householders$114,558 Some other race householders$115,759 Two or more races householders$80,841 Hispanic or Latino race householdersMedian 2022 house value $327,674 White Non-Hispanic householders$316,168 Black or African American householders$269,666 American Indian or Alaska Native householders $424,754 Asian householders$329,592 Two or more races householders$449,443 Hispanic or Latino householders
Median age by race in Willow Grove
41.3 Median age for White residents40.2 43.3 41.1 Median age for Black or African American residents34.3 48.8 -626,180,836.1 Median age for American Indian / Alaska Native residents-1,098,934,549.9 -577,519,379.3 40.0 Median age for Asian residents21.0 48.3 -680,432,644.4 Median age for Native Hawaiian / Pacific Islander residents-649,523,808.9 -747,474,746.7 33.7 Median age for Other race residents40.1 41.6 17.0 Median age for Two or more races residents24.2 15.0 41.9 Median age for White alone residents40.8 42.9 28.1 Median age for Hispanic or Latino residents27.4 34.6
Owner/renter occupied households by race in Willow Grove
House owners and renters - White residents 3,241 69.4% Owner occupied1,428 30.6% Renter occupiedHouse owners and renters - Black or African American residents 188 54.6% Owner occupied156 45.4% Renter occupiedHouse owners and renters - Asian residents 146 75.2% Owner occupied48 24.8% Renter occupiedHouse owners and renters - Other race residents 37 64.4% Owner occupied21 35.6% Renter occupiedHouse owners and renters - Two or more races residents 158 85.6% Owner occupied27 14.4% Renter occupiedHouse owners and renters - White alone residents 3,241 69.3% Owner occupied1,436 30.7% Renter occupiedHouse owners and renters - Hispanic or Latino residents 75 51.0% Owner occupied72 49.0% Renter occupied
Language usage in Willow Grove
English speakers - Total 89.0% of residents of Willow Grove speak English at home.
1.3% of residents speak Spanish at home 155 95.1% Speak English very well8 4.9% Speak English less than very well9.5% of residents speak other language at home 782 63.9% Speak English very well442 36.1% Speak English less than very well
English speakers - Born in the United States 94.0% of residents of Willow Grove speak English at home.
2.0% of residents speak Spanish at home 40 100.0% Speak English very well3.9% of residents speak other language at home 68 86.1% Speak English very well11 13.9% Speak English less than very well
English speakers - Native, born elsewhere 15.5% of residents of Willow Grove speak English at home.
28.7% of residents speak Spanish at home 52 100.0% Speak English very well72.9% of residents speak other language at home 132 100.0% Speak English very well
English speakers - Foreign-born 26.3% of residents of Willow Grove speak English at home.
4.4% of residents speak Spanish at home 41 83.7% Speak English very well8 16.3% Speak English less than very well67.7% of residents speak other language at home 388 51.1% Speak English very well371 48.9% Speak English less than very well
White (Caucasian) - Speak only English Native:
97.2% (9,249)Foreign-born:
35.1% (131)
White (Caucasian) - Speak another language Native:
2.8% (265)Foreign-born:
65.1% (243)
Black or African American - Speak only English Native:
97.6% (1,007)Foreign-born:
82.8% (76)
Black or African American - Speak another language Native:
2.3% (24)Foreign-born:
21.6% (20)
Asian - Speak only English Native:
53.4% (93)Foreign-born:
2.5% (12)
Asian - Speak another language Native:
44.9% (78)Foreign-born:
96.6% (462)
Other race - Speak only English Native:
33.5% (45)Foreign-born:
24.5% (14)
Other race - Speak another language Native:
70.5% (96)Foreign-born:
91.5% (50)
Two or more races - Speak only English Native:
87.0% (886)Foreign-born:
83.2% (94)
Two or more races - Speak another language Native:
12.6% (129)Foreign-born:
15.0% (17)
White alone - Speak only English Native:
96.7% (9,205)Foreign-born:
17.5% (56)
White alone - Speak another language Native:
3.4% (321)Foreign-born:
83.2% (266)
Hispanic or Latino - Speak only English Native:
83.0% (424)Foreign-born:
46.1% (79)
Hispanic or Latino - Speak another language Native:
17.7% (91)Foreign-born:
45.8% (79)
Foreign-born residents in Willow Grove 1,169 residents are foreign born (3.6% Asia , 2.3% Latin America , 1.6% Europe ).
This city:
8.4%Pennsylvania:
7.3%
Marital status for residents in Willow Grove Marital status - White (Caucasian) population 15 years and over
Males 31.5% Never married52.7% Now married0.3% Separated3.2% Widowed12.3% DivorcedFemales 28.0% Never married47.0% Now married2.7% Separated9.3% Widowed13.1% DivorcedWomen who gave birth in the past 12 months Now married:
100.0% (78)Unmarried:
0.0% (0)
Women who did not give birth in the past 12 months Now married:
50.1% (1,183)Unmarried:
49.9% (1,178)
Marital status - Black or African American population 15 years and over
Males 41.8% Never married48.2% Now married0.0% Separated0.0% Widowed10.1% DivorcedFemales 17.2% Never married49.6% Now married0.0% Separated5.7% Widowed27.5% DivorcedWomen who gave birth in the past 12 months Now married:
100.0% (19)Unmarried:
0.0% (0)
Women who did not give birth in the past 12 months Now married:
64.0% (129)Unmarried:
36.0% (73)
Marital status - Asian population 15 years and over
Males 59.5% Never married40.5% Now married0.0% Separated0.0% Widowed0.0% DivorcedFemales 11.9% Never married71.9% Now married0.0% Separated16.2% Widowed0.0% DivorcedWomen who gave birth in the past 12 months Now married:
100.0% (16)Unmarried:
0.0% (0)
Women who did not give birth in the past 12 months Now married:
75.2% (112)Unmarried:
24.8% (37)
Marital status - Other race population 15 years and over
Males 58.7% Never married15.2% Now married0.0% Separated0.0% Widowed26.1% DivorcedFemales 17.9% Never married62.7% Now married0.0% Separated0.0% Widowed19.4% DivorcedWomen who did not give birth in the past 12 months Now married:
59.7% (47)Unmarried:
40.3% (32)
Marital status - Two or more races population 15 years and over
Males 25.1% Never married71.9% Now married0.0% Separated0.0% Widowed3.0% DivorcedFemales 52.9% Never married47.1% Now married0.0% Separated0.0% Widowed0.0% DivorcedWomen who did not give birth in the past 12 months Now married:
48.8% (141)Unmarried:
51.2% (148)
Marital status - White alone, not Hispanic / Latino population 15 years and over
Males 30.4% Never married53.4% Now married0.4% Separated3.3% Widowed12.7% DivorcedFemales 28.0% Never married46.7% Now married2.7% Separated9.4% Widowed13.2% DivorcedWomen who gave birth in the past 12 months Now married:
100.0% (79)Unmarried:
0.0% (0)
Women who did not give birth in the past 12 months Now married:
50.0% (1,181)Unmarried:
50.0% (1,181)
Marital status - Hispanic or Latino population 15 years and over
Males 31.9% Never married61.6% Now married0.0% Separated0.0% Widowed6.4% DivorcedFemales 39.2% Never married55.0% Now married0.0% Separated0.0% Widowed5.9% DivorcedWomen who gave birth in the past 12 months Now married:
100.0% (19)Unmarried:
0.0% (0)
Women who did not give birth in the past 12 months Now married:
50.9% (91)Unmarried:
49.1% (88)
Ancestries in Willow Grove
949 17.6% Irish519 9.6% American490 9.1% Italian410 7.6% German243 4.5% Polish190 3.5% English141 2.6% Russian137 2.5% Trinidadian and Tobagonian112 2.1% European104 1.9% African71 1.3% Greek64 1.2% Ukrainian61 1.1% Scottish41 0.8% Eastern European39 0.7% Cypriot32 0.6% Romanian31 0.6% Lithuanian30 0.6% Portuguese28 0.5% Pennsylvania German27 0.5% Jamaican23 0.4% Yugoslavian22 0.4% Welsh19 0.4% Norwegian18 0.3% South African17 0.3% British16 0.3% Slovak13 0.2% Latvian12 0.2% Hungarian12 0.2% French10 0.2% Dutch9 0.2% Scotch-Irish9 0.2% Lebanese8 0.1% Swiss7 0.1% French Canadian7 0.1% Austrian6 0.1% Albanian4 0.07% Canadian3 0.06% Scandinavian
Children Nativity (place of birth) in Willow Grove
Children under 6 years - Living with two parents Both parents native 794 100.0% NativeBoth parents foreign-born 58 100.0% NativeOne native, one foreign-born parent 75 100.0% NativeChildren under 6 years - Living with one parent Native parent 109 100.0% NativeChildren 6 to 17 years - Living with two parents Both parents native 1,120 100.0% NativeBoth parents foreign-born 135 95.5% Native6 4.5% Foreign-bornOne native, one foreign-born parent 179 100.0% NativeChildren 6 to 17 years - Living with one parent Native parent 568 100.0% NativeForeign-born parent 12 56.2% Native9 43.8% Foreign-born
Grandparents responsible for own grandchildren in Willow Grove
Grandparents (30 to 59 years) White / Caucasian 12 94.1% Responsible for grandchildren1 5.9% Not responsible for grandchildrenWhite alone, not Hispanic / Latino 13 94.2% Responsible for grandchildren1 5.8% Not responsible for grandchildrenGrandparents (60 years and over) White / Caucasian 37 52.8% Responsible for grandchildren33 47.2% Not responsible for grandchildrenWhite alone, not Hispanic / Latino 37 52.4% Responsible for grandchildren34 47.6% Not responsible for grandchildren