Races in Willimantic, Connecticut (CT) Detailed Stats
Data:
Races - White alone (%)
Races - White alone (% change since 2000)
Races - Black alone (%)
Races - Black alone (% change since 2000)
Races - American Indian alone (%)
Races - American Indian alone (% change since 2000)
Races - Asian alone (%)
Races - Asian alone (% change since 2000)
Races - Hispanic (%)
Races - Hispanic (% change since 2000)
Races - Native Hawaiian and Other Pacific Islander alone (%)
Races - Native Hawaiian and Other Pacific Islander alone (% change since 2000)
Races - Two or more races(%)
Races - Two or more races(% change since 2000)
Races - Other race alone (%)
Races - Other race alone (% change since 2000)
Racial diversity
Place of birth - Born in state of residence (%)
Place of birth - Born in state of residence (%) - White
Place of birth - Born in state of residence (%) - Black or African American
Place of birth - Born in state of residence (%) - Asian
Place of birth - Born in state of residence (%) - Hispanic or Latino
Place of birth - Born in state of residence (%) - American Indian and Alaska Native
Place of birth - Born in state of residence (%) - Multirace
Place of birth - Born in state of residence (%) - Other Race
Place of birth - Born in other state (%)
Place of birth - Born in other state (%) - White
Place of birth - Born in other state (%) - Black or African American
Place of birth - Born in other state (%) - Asian
Place of birth - Born in other state (%) - Hispanic or Latino
Place of birth - Born in other state (%) - American Indian and Alaska Native
Place of birth - Born in other state (%) - Multirace
Place of birth - Born in other state (%) - Other Race
Place of birth - Native, outside of US (%)
Place of birth - Native, outside of US (%) - White
Place of birth - Native, outside of US (%) - Black or African American
Place of birth - Native, outside of US (%) - Asian
Place of birth - Native, outside of US (%) - Hispanic or Latino
Place of birth - Native, outside of US (%) - American Indian and Alaska Native
Place of birth - Native, outside of US (%) - Multirace
Place of birth - Native, outside of US (%) - Other Race
Place of birth - Foreign born (%)
Place of birth - Foreign born (%) - White
Place of birth - Foreign born (%) - Black or African American
Place of birth - Foreign born (%) - Asian
Place of birth - Foreign born (%) - Hispanic or Latino
Place of birth - Foreign born (%) - American Indian and Alaska Native
Place of birth - Foreign born (%) - Multirace
Place of birth - Foreign born (%) - Other Race
Residents speaking English at home (%)
Residents speaking English at home - Born in the United States (%)
Residents speaking English at home - Native, born elsewhere (%)
Residents speaking English at home - Foreign born (%)
Residents speaking Spanish at home (%)
Residents speaking Spanish at home - Born in the United States (%)
Residents speaking Spanish at home - Native, born elsewhere (%)
Residents speaking Spanish at home - Foreign born (%)
Residents speaking other language at home (%)
Residents speaking other language at home - Born in the United States (%)
Residents speaking other language at home - Native, born elsewhere (%)
Residents speaking other language at home - Foreign born (%)
Marital status - Never married (%)
Marital status - Now married (%)
Marital status - Separated (%)
Marital status - Widowed (%)
Marital status - Divorced (%)
Ancestries Reported - Arab (%)
Ancestries Reported - Czech (%)
Ancestries Reported - Danish (%)
Ancestries Reported - Dutch (%)
Ancestries Reported - English (%)
Ancestries Reported - French (%)
Ancestries Reported - French Canadian (%)
Ancestries Reported - German (%)
Ancestries Reported - Greek (%)
Ancestries Reported - Hungarian (%)
Ancestries Reported - Irish (%)
Ancestries Reported - Italian (%)
Ancestries Reported - Lithuanian (%)
Ancestries Reported - Norwegian (%)
Ancestries Reported - Polish (%)
Ancestries Reported - Portuguese (%)
Ancestries Reported - Russian (%)
Ancestries Reported - Scotch-Irish (%)
Ancestries Reported - Scottish (%)
Ancestries Reported - Slovak (%)
Ancestries Reported - Subsaharan African (%)
Ancestries Reported - Swedish (%)
Ancestries Reported - Swiss (%)
Ancestries Reported - Ukrainian (%)
Ancestries Reported - United States (%)
Ancestries Reported - Welsh (%)
Ancestries Reported - West Indian (%)
Ancestries Reported - Other (%)
Geographical mobility - Same house 1 year ago (%)
Geographical mobility - Same house 1 year ago (%) - White
Geographical mobility - Same house 1 year ago (%) - Black or African American
Geographical mobility - Same house 1 year ago (%) - Asian
Geographical mobility - Same house 1 year ago (%) - Hispanic or Latino
Geographical mobility - Same house 1 year ago (%) - American Indian and Alaska Native
Geographical mobility - Same house 1 year ago (%) - Multirace
Geographical mobility - Same house 1 year ago (%) - Other Race
Geographical mobility - Moved within same county (%)
Geographical mobility - Moved within same county (%) - White
Geographical mobility - Moved within same county (%) - Black or African American
Geographical mobility - Moved within same county (%) - Asian
Geographical mobility - Moved within same county (%) - Hispanic or Latino
Geographical mobility - Moved within same county (%) - American Indian and Alaska Native
Geographical mobility - Moved within same county (%) - Multirace
Geographical mobility - Moved within same county (%) - Other Race
Geographical mobility - Moved from different county within same state (%)
Geographical mobility - Moved from different county within same state (%) - White
Geographical mobility - Moved from different county within same state (%) - Black or African American
Geographical mobility - Moved from different county within same state (%) - Asian
Geographical mobility - Moved from different county within same state (%) - Hispanic or Latino
Geographical mobility - Moved from different county within same state (%) - American Indian and Alaska Native
Geographical mobility - Moved from different county within same state (%) - Multirace
Geographical mobility - Moved from different county within same state (%) - Other Race
Geographical mobility - Moved from different state (%)
Geographical mobility - Moved from different state (%) - White
Geographical mobility - Moved from different state (%) - Black or African American
Geographical mobility - Moved from different state (%) - Asian
Geographical mobility - Moved from different state (%) - Hispanic or Latino
Geographical mobility - Moved from different state (%) - American Indian and Alaska Native
Geographical mobility - Moved from different state (%) - Multirace
Geographical mobility - Moved from different state (%) - Other Race
Geographical mobility - Moved from abroad (%)
Geographical mobility - Moved from abroad (%) - White
Geographical mobility - Moved from abroad (%) - Black or African American
Geographical mobility - Moved from abroad (%) - Asian
Geographical mobility - Moved from abroad (%) - Hispanic or Latino
Geographical mobility - Moved from abroad (%) - American Indian and Alaska Native
Geographical mobility - Moved from abroad (%) - Multirace
Geographical mobility - Moved from abroad (%) - Other Race
Place of birth for the foreign-born population - Ireland (%)
Place of birth for the foreign-born population - Denmark (%)
Place of birth for the foreign-born population - Norway (%)
Place of birth for the foreign-born population - Sweden (%)
Place of birth for the foreign-born population - United Kingdom (%)
Place of birth for the foreign-born population - England (%)
Place of birth for the foreign-born population - Scotland (%)
Place of birth for the foreign-born population - Other Northern Europe (%)
Place of birth for the foreign-born population - Austria (%)
Place of birth for the foreign-born population - Belgium (%)
Place of birth for the foreign-born population - France (%)
Place of birth for the foreign-born population - Germany (%)
Place of birth for the foreign-born population - Netherlands (%)
Place of birth for the foreign-born population - Switzerland (%)
Place of birth for the foreign-born population - Other Western Europe (%)
Place of birth for the foreign-born population - Greece (%)
Place of birth for the foreign-born population - Italy (%)
Place of birth for the foreign-born population - Portugal (%)
Place of birth for the foreign-born population - Spain (%)
Place of birth for the foreign-born population - Other Southern Europe (%)
Place of birth for the foreign-born population - Albania (%)
Place of birth for the foreign-born population - Belarus (%)
Place of birth for the foreign-born population - Bosnia and Herzegovina (%)
Place of birth for the foreign-born population - Bulgaria (%)
Place of birth for the foreign-born population - Croatia (%)
Place of birth for the foreign-born population - Czechoslovakia (%)
Place of birth for the foreign-born population - Hungary (%)
Place of birth for the foreign-born population - Latvia (%)
Place of birth for the foreign-born population - Lithuania (%)
Place of birth for the foreign-born population - North Macedonia (Macedonia) (%)
Place of birth for the foreign-born population - Moldova (%)
Place of birth for the foreign-born population - Poland (%)
Place of birth for the foreign-born population - Romania (%)
Place of birth for the foreign-born population - Russia (%)
Place of birth for the foreign-born population - Serbia (%)
Place of birth for the foreign-born population - Ukraine (%)
Place of birth for the foreign-born population - Other Eastern Europe (%)
Place of birth for the foreign-born population - China (%)
Place of birth for the foreign-born population - Hong Kong (%)
Place of birth for the foreign-born population - Taiwan (%)
Place of birth for the foreign-born population - Japan (%)
Place of birth for the foreign-born population - Korea (%)
Place of birth for the foreign-born population - Other Eastern Asia (%)
Place of birth for the foreign-born population - Afghanistan (%)
Place of birth for the foreign-born population - Bangladesh (%)
Place of birth for the foreign-born population - India (%)
Place of birth for the foreign-born population - Iran (%)
Place of birth for the foreign-born population - Kazakhstan (%)
Place of birth for the foreign-born population - Nepal (%)
Place of birth for the foreign-born population - Pakistan (%)
Place of birth for the foreign-born population - Sri Lanka (%)
Place of birth for the foreign-born population - Uzbekistan (%)
Place of birth for the foreign-born population - Other South Central Asia (%)
Place of birth for the foreign-born population - Burma (%)
Place of birth for the foreign-born population - Cambodia (%)
Place of birth for the foreign-born population - Indonesia (%)
Place of birth for the foreign-born population - Laos (%)
Place of birth for the foreign-born population - Malaysia (%)
Place of birth for the foreign-born population - Philippines (%)
Place of birth for the foreign-born population - Singapore (%)
Place of birth for the foreign-born population - Thailand (%)
Place of birth for the foreign-born population - Vietnam (%)
Place of birth for the foreign-born population - Other South Eastern Asia (%)
Place of birth for the foreign-born population - Armenia (%)
Place of birth for the foreign-born population - Iraq (%)
Place of birth for the foreign-born population - Israel (%)
Place of birth for the foreign-born population - Jordan (%)
Place of birth for the foreign-born population - Kuwait (%)
Place of birth for the foreign-born population - Lebanon (%)
Place of birth for the foreign-born population - Saudi Arabia (%)
Place of birth for the foreign-born population - Syria (%)
Place of birth for the foreign-born population - Turkey (%)
Place of birth for the foreign-born population - Yemen (%)
Place of birth for the foreign-born population - Other Western Asia (%)
Place of birth for the foreign-born population - Eritrea (%)
Place of birth for the foreign-born population - Ethiopia (%)
Place of birth for the foreign-born population - Kenya (%)
Place of birth for the foreign-born population - Somalia (%)
Place of birth for the foreign-born population - Uganda (%)
Place of birth for the foreign-born population - Zimbabwe (%)
Place of birth for the foreign-born population - Other Eastern Africa (%)
Place of birth for the foreign-born population - Cameroon (%)
Place of birth for the foreign-born population - Congo (%)
Place of birth for the foreign-born population - Democratic Republic of Congo (Zaire) (%)
Place of birth for the foreign-born population - Other Middle Africa (%)
Place of birth for the foreign-born population - Egypt (%)
Place of birth for the foreign-born population - Morocco (%)
Place of birth for the foreign-born population - Sudan (%)
Place of birth for the foreign-born population - Other Northern Africa (%)
Place of birth for the foreign-born population - South Africa (%)
Place of birth for the foreign-born population - Other Southern Africa (%)
Place of birth for the foreign-born population - Cabo Verde (%)
Place of birth for the foreign-born population - Ghana (%)
Place of birth for the foreign-born population - Liberia (%)
Place of birth for the foreign-born population - Nigeria (%)
Place of birth for the foreign-born population - Senegal (%)
Place of birth for the foreign-born population - Sierra Leone (%)
Place of birth for the foreign-born population - Other Western Africa (%)
Place of birth for the foreign-born population - Australia (%)
Place of birth for the foreign-born population - New Zealand (%)
Place of birth for the foreign-born population - Fiji (%)
Place of birth for the foreign-born population - Micronesia (%)
Place of birth for the foreign-born population - Bahamas (%)
Place of birth for the foreign-born population - Barbados (%)
Place of birth for the foreign-born population - Cuba (%)
Place of birth for the foreign-born population - Dominica (%)
Place of birth for the foreign-born population - Dominican Republic (%)
Place of birth for the foreign-born population - Grenada (%)
Place of birth for the foreign-born population - Haiti (%)
Place of birth for the foreign-born population - Jamaica (%)
Place of birth for the foreign-born population - St. Vincent and the Grenadines (%)
Place of birth for the foreign-born population - Trinidad and Tobago (%)
Place of birth for the foreign-born population - West Indies (%)
Place of birth for the foreign-born population - Other Caribbean (%)
Place of birth for the foreign-born population - Belize (%)
Place of birth for the foreign-born population - Costa Rica (%)
Place of birth for the foreign-born population - El Salvador (%)
Place of birth for the foreign-born population - Guatemala (%)
Place of birth for the foreign-born population - Honduras (%)
Place of birth for the foreign-born population - Mexico (%)
Place of birth for the foreign-born population - Nicaragua (%)
Place of birth for the foreign-born population - Panama (%)
Place of birth for the foreign-born population - Other Central America (%)
Place of birth for the foreign-born population - Argentina (%)
Place of birth for the foreign-born population - Bolivia (%)
Place of birth for the foreign-born population - Brazil (%)
Place of birth for the foreign-born population - Chile (%)
Place of birth for the foreign-born population - Colombia (%)
Place of birth for the foreign-born population - Ecuador (%)
Place of birth for the foreign-born population - Guyana (%)
Place of birth for the foreign-born population - Peru (%)
Place of birth for the foreign-born population - Uruguay (%)
Place of birth for the foreign-born population - Venezuela (%)
Place of birth for the foreign-born population - Other South America (%)
Place of birth for the foreign-born population - Canada (%)
Place of birth for the foreign-born population - Other Northern America (%)
Place of birth for the foreign-born population - Other (%)
Latest news about races in Willimantic, CT collected exclusively by city-data.com from local newspapers, TV, and radio stations
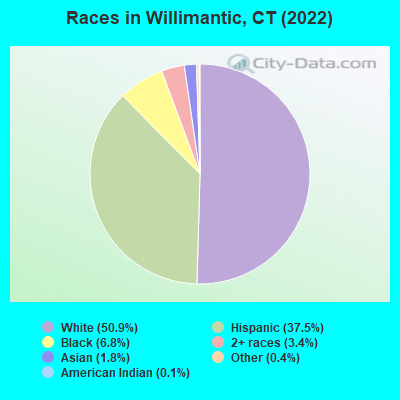
According to 2022 data, the most numerous races in Willimantic, CT are White alone (9,071 residents), Hispanic (6,687 residents), and Black alone (1,207 residents). 67.9% of Willimantic residents speak English at home. 9.6% of Willimantic, CT residents are foreign-born (5.6% born in Latin America, 2.1% born in Asia, 1.1% born in Europe), which is 55.7% less than the foreign-born rate of 15.0% across the entire state of Connecticut.
Race distribution in Willimantic
2000 2022
2,638,845 77.5% White alone 320,323 9.4% Hispanic 295,571 8.7% Black alone 81,564 2.4% Asian alone 52,896 1.6% Two or more races 8,141 0.2% Other race alone 7,267 0.2% American Indian alone 958 0.03% Native Hawaiian and Other
2,246,913 62.0% White alone 658,978 18.2% Hispanic 353,973 9.8% Black alone 172,929 4.8% Asian alone 159,631 4.4% Two or more races 29,761 0.8% Other race alone 3,428 0.09% American Indian alone 592 0.02% Native Hawaiian and Other
Income and house value in Willimantic Median household income in 2022 $51,854 White non-Hispanic householders$57,072 Black householders$34,217 Some other race householders$37,636 Two or more races householders$34,397 Hispanic or Latino race householdersMedian 2022 house value $183,736 White Non-Hispanic householders$178,332 Black or African American householders$313,626 American Indian or Alaska Native householders $140,890 Asian householders$868,503 Native Hawaiian and other Pacific Islander householders$173,700 Some other race householders$109,431 Two or more races householders$185,280 Hispanic or Latino householders
Median age by race in Willimantic
33.5 Median age for White residents31.2 37.3 22.4 Median age for Black or African American residents23.4 21.9 24.2 Median age for American Indian / Alaska Native residents32.3 19.8 24.6 Median age for Asian residents22.5 27.0 -641,269,840.6 Median age for Native Hawaiian / Pacific Islander residents-414,239,481.8 -691,588,784.4 35.0 Median age for Other race residents34.8 34.2 27.8 Median age for Two or more races residents24.2 37.7 39.1 Median age for White alone residents34.4 41.9 26.0 Median age for Hispanic or Latino residents23.2 27.4
Owner/renter occupied households by race in Willimantic
House owners and renters - White residents 1,836 42.1% Owner occupied2,531 57.9% Renter occupiedHouse owners and renters - Black or African American residents 226 70.7% Owner occupied94 29.3% Renter occupiedHouse owners and renters - Asian residents 33 28.8% Owner occupied82 71.2% Renter occupiedHouse owners and renters - Other race residents 136 24.4% Owner occupied421 75.6% Renter occupiedHouse owners and renters - Two or more races residents 424 30.3% Owner occupied975 69.7% Renter occupiedHouse owners and renters - White alone residents 1,761 46.0% Owner occupied2,069 54.0% Renter occupiedHouse owners and renters - Hispanic or Latino residents 534 24.6% Owner occupied1,635 75.4% Renter occupied
Language usage in Willimantic
English speakers - Total 67.9% of residents of Willimantic speak English at home.
27.1% of residents speak Spanish at home 3,223 67.8% Speak English very well1,531 32.2% Speak English less than very well5.6% of residents speak other language at home 771 78.7% Speak English very well209 21.3% Speak English less than very well
English speakers - Born in the United States 77.5% of residents of Willimantic speak English at home.
19.1% of residents speak Spanish at home 704 94.5% Speak English very well41 5.5% Speak English less than very well5.0% of residents speak other language at home 195 100.0% Speak English very well
English speakers - Native, born elsewhere 25.4% of residents of Willimantic speak English at home.
71.2% of residents speak Spanish at home 607 41.8% Speak English very well844 58.2% Speak English less than very well1.7% of residents speak other language at home 35 100.0% Speak English very well
English speakers - Foreign-born 18.9% of residents of Willimantic speak English at home.
50.9% of residents speak Spanish at home 403 46.1% Speak English very well471 53.9% Speak English less than very well31.5% of residents speak other language at home 369 68.3% Speak English very well171 31.7% Speak English less than very well
White (Caucasian) - Speak only English Native:
83.2% (9,077)Foreign-born:
37.8% (145)
White (Caucasian) - Speak another language Native:
13.9% (1,522)Foreign-born:
63.4% (243)
Black or African American - Speak only English Native:
87.4% (1,092)Foreign-born:
16.6% (17)
Black or African American - Speak another language Native:
13.1% (163)Foreign-born:
71.2% (74)
American Indian / Alaska Native - Speak another language Native:
58.8% (21)Foreign-born:
92.6% (20)
Asian - Speak only English Native:
58.4% (50)Foreign-born:
14.7% (35)
Asian - Speak another language Native:
41.8% (36)Foreign-born:
85.4% (205)
Other race - Speak only English Native:
29.3% (284)Foreign-born:
13.9% (82)
Other race - Speak another language Native:
69.9% (677)Foreign-born:
84.7% (501)
Two or more races - Speak only English Native:
37.6% (1,117)Foreign-born:
3.9% (21)
Two or more races - Speak another language Native:
66.9% (1,989)Foreign-born:
99.5% (544)
White alone - Speak only English Native:
92.7% (8,092)Foreign-born:
50.8% (150)
White alone - Speak another language Native:
7.4% (643)Foreign-born:
49.8% (147)
Hispanic or Latino - Speak only English Native:
36.6% (2,028)Foreign-born:
7.5% (71)
Hispanic or Latino - Speak another language Native:
63.0% (3,487)Foreign-born:
92.2% (871)
Foreign-born residents in Willimantic 1,718 residents are foreign born (5.6% Latin America , 2.1% Asia , 1.1% Europe ).
This city:
9.6%Connecticut:
15.0%
Marital status for residents in Willimantic Marital status - White (Caucasian) population 15 years and over
Males 65.2% Never married23.2% Now married1.3% Separated2.4% Widowed7.9% DivorcedFemales 56.1% Never married24.5% Now married1.2% Separated7.0% Widowed11.3% DivorcedWomen who gave birth in the past 12 months Now married:
100.0% (62)Unmarried:
0.0% (0)
Women who did not give birth in the past 12 months Now married:
14.1% (463)Unmarried:
85.9% (2,820)
Marital status - Black or African American population 15 years and over
Males 58.1% Never married32.6% Now married0.0% Separated0.0% Widowed9.4% DivorcedFemales 76.0% Never married18.9% Now married0.3% Separated0.0% Widowed4.8% DivorcedWomen who gave birth in the past 12 months Now married:
100.0% (20)Unmarried:
0.0% (0)
Women who did not give birth in the past 12 months Now married:
7.4% (44)Unmarried:
92.6% (549)
Marital status - American Indian / Alaska Native population 15 years and over
Males 58.3% Never married41.7% Now married0.0% Separated0.0% Widowed0.0% DivorcedFemales 100.0% Never married0.0% Now married0.0% Separated0.0% Widowed0.0% DivorcedWomen who did not give birth in the past 12 months Now married:
0.0% (0)Unmarried:
100.0% (27)
Marital status - Asian population 15 years and over
Males 93.8% Never married6.2% Now married0.0% Separated0.0% Widowed0.0% DivorcedFemales 79.3% Never married9.6% Now married0.0% Separated11.1% Widowed0.0% DivorcedWomen who did not give birth in the past 12 months Now married:
10.8% (13)Unmarried:
89.2% (105)
Marital status - Other race population 15 years and over
Males 59.0% Never married34.2% Now married2.2% Separated0.0% Widowed4.6% DivorcedFemales 63.0% Never married15.9% Now married11.8% Separated1.5% Widowed7.8% DivorcedWomen who did not give birth in the past 12 months Now married:
19.8% (108)Unmarried:
80.2% (436)
Marital status - Two or more races population 15 years and over
Males 58.0% Never married31.7% Now married0.0% Separated0.9% Widowed9.4% DivorcedFemales 63.4% Never married26.3% Now married0.9% Separated3.8% Widowed5.7% DivorcedWomen who did not give birth in the past 12 months Now married:
26.9% (307)Unmarried:
73.1% (836)
Marital status - White alone, not Hispanic / Latino population 15 years and over
Males 66.1% Never married22.6% Now married1.1% Separated2.9% Widowed7.3% DivorcedFemales 55.3% Never married24.3% Now married1.0% Separated8.5% Widowed11.1% DivorcedWomen who gave birth in the past 12 months Now married:
100.0% (56)Unmarried:
0.0% (0)
Women who did not give birth in the past 12 months Now married:
12.2% (315)Unmarried:
87.8% (2,279)
Marital status - Hispanic or Latino population 15 years and over
Males 57.3% Never married31.7% Now married1.5% Separated0.4% Widowed9.2% DivorcedFemales 63.3% Never married23.3% Now married3.6% Separated0.8% Widowed9.1% DivorcedWomen who gave birth in the past 12 months Now married:
100.0% (11)Unmarried:
0.0% (0)
Women who did not give birth in the past 12 months Now married:
23.0% (507)Unmarried:
77.0% (1,699)
Ancestries in Willimantic
829 8.9% Italian426 4.6% Irish277 3.0% Polish268 2.9% French Canadian262 2.8% French242 2.6% American232 2.5% English232 2.5% German193 2.1% European125 1.3% Portuguese120 1.3% Egyptian110 1.2% Canadian95 1.0% Jamaican92 1.0% Ukrainian74 0.8% Greek68 0.7% Russian62 0.7% Iraqi56 0.6% African48 0.5% Haitian39 0.4% Scottish37 0.4% Norwegian35 0.4% Latvian23 0.2% Trinidadian and Tobagonian20 0.2% Northern European19 0.2% Welsh15 0.2% Scotch-Irish15 0.2% Ghanaian15 0.2% Turkish12 0.1% Eastern European6 0.06% Danish5 0.05% Czech4 0.04% Dutch3 0.03% Cape Verdean
Geographical mobility in Willimantic Same house 1 year ago 9,610 85.2% White (Caucasian)1,240 88.9% Black or African American33 57.6% American Indian / Alaska Native144 44.6% Asian1,487 95.5% Other race3,410 92.3% Two or more races7,618 84.4% White alone, not Hispanic / Latino6,130 92.1% Hispanic or LatinoMoved within same county 516 4.6% White / Caucasian30 2.1% Black or African American65 20.3% Asian39 2.5% Other race150 4.1% Two or more races397 4.4% White alone, not Hispanic / Latino275 4.1% Hispanic or LatinoMoved within same state 697 6.2% White / Caucasian52 3.7% Black or African American22 38.2% American Indian / Alaska Native47 14.5% Asian2 0.1% Other race108 2.9% Two or more races599 6.6% White alone, not Hispanic / Latino161 2.4% Hispanic or LatinoMoved from different state 398 3.5% White / Caucasian69 5.0% Black or African American5 1.6% Asian9 0.6% Other race35 0.9% Two or more races396 4.4% White alone, not Hispanic / Latino61 0.9% Hispanic or LatinoMoved from abroad 4 0.0% White15 1.1% Black or African American58 18.1% Asian48 3.1% Other race5 0.1% White alone, not Hispanic / Latino43 0.7% Hispanic or Latino
Children Nativity (place of birth) in Willimantic
Children under 6 years - Living with two parents Both parents native 196 100.0% NativeBoth parents foreign-born 10 100.0% NativeChildren under 6 years - Living with one parent Native parent 179 100.0% NativeForeign-born parent 79 100.0% NativeChildren 6 to 17 years - Living with two parents Both parents native 478 88.2% Native64 11.8% Foreign-bornBoth parents foreign-born 79 82.9% Native16 17.1% Foreign-bornOne native, one foreign-born parent 96 100.0% NativeChildren 6 to 17 years - Living with one parent Native parent 1,229 100.0% NativeForeign-born parent 178 50.8% Native173 49.2% Foreign-born
Grandparents responsible for own grandchildren in Willimantic
Grandparents (30 to 59 years) White / Caucasian 38 87.2% Responsible for grandchildren6 12.8% Not responsible for grandchildrenBlack or African American 30 100.0% Not responsible for grandchildrenOther race 5 16.8% Responsible for grandchildren23 83.2% Not responsible for grandchildrenTwo or more races 10 100.0% Responsible for grandchildrenHispanic or Latino 60 72.6% Responsible for grandchildren23 27.4% Not responsible for grandchildrenGrandparents (60 years and over) White / Caucasian 11 30.7% Responsible for grandchildren26 69.3% Not responsible for grandchildrenOther race 9 100.0% Responsible for grandchildrenHispanic or Latino 5 15.2% Responsible for grandchildren30 84.8% Not responsible for grandchildren