Races in Williamstown, New Jersey (NJ) Detailed Stats
Ancestries, Foreign-born residents, place of birth
Settings
X


Recent posts about races in Williamstown, New Jersey on our local forum with over 2,400,000 registered users:
 | Is it good time to buy a house in south jersey? (18 replies) |
| House hunting in South Jersey (2 replies) |
| Currently in Williamstown, looking for childrens future. (6 replies) |
| Williamstown, NJ Good or Bad? (35 replies) |
| Gloucester Township and Deptford- opinions? (25 replies) |
| Lost black dog, one BLUE EYE one BROWN EYE; possibly Millville from Williamstown (1 reply) |
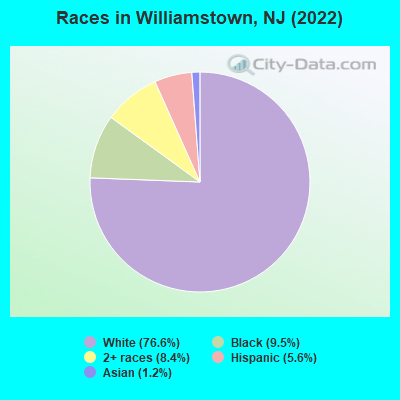
According to 2022 data, the most numerous races in Williamstown, NJ are White alone (11,467 residents), Hispanic (836 residents), and Black alone (1,420 residents). 93.3% of Williamstown residents speak English at home. 3.7% of Williamstown, NJ residents are foreign-born (1.3% born in Latin America, 1.2% born in Asia, 1.1% born in Europe), which is 526.9% less than the foreign-born rate of 23.0% across the entire state of New Jersey.
Race distribution in Williamstown
2000
2022

- 9,95484.3%White alone
- 1,19310.1%Black alone
- 3392.9%Hispanic
- 1671.4%Two or more races
- 1080.9%Asian alone
- 310.3%American Indian alone
- 130.1%Other race alone
- 70.06%Native Hawaiian and Other
Pacific Islander alone

-
- 11,46776.6%White alone
- 1,4209.5%Black alone
- 1,2608.4%Two or more races
- 8365.6%Hispanic
- 1761.2%Asian alone
- 40.03%American Indian alone
2000
2022
-
- 5,557,20966.0%White alone
- 1,117,19113.3%Hispanic
- 1,096,17113.0%Black alone
- 477,0125.7%Asian alone
- 133,6891.6%Two or more races
- 19,5650.2%Other race alone
- 11,3380.1%American Indian alone
- 2,1750.03%Native Hawaiian and Other
Pacific Islander alone

-
- 4,766,47651.5%White alone
- 2,028,47021.9%Hispanic
- 1,111,63212.0%Black alone
- 923,54610.0%Asian alone
- 332,2373.6%Two or more races
- 89,8471.0%Other race alone
- 8,5570.09%American Indian alone
- 9340.01%Native Hawaiian and Other
Pacific Islander alone

Income and house value in Williamstown
- Median household income in 2022
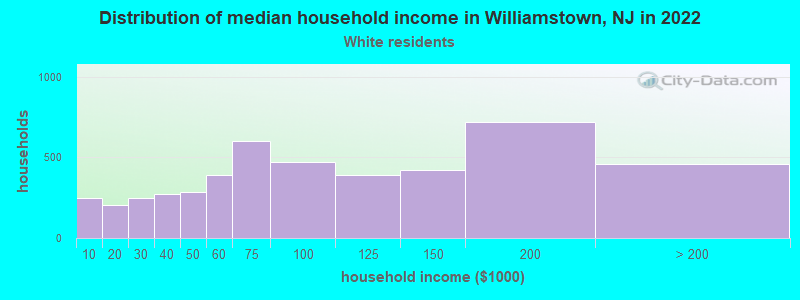
- $82,204White non-Hispanic householders
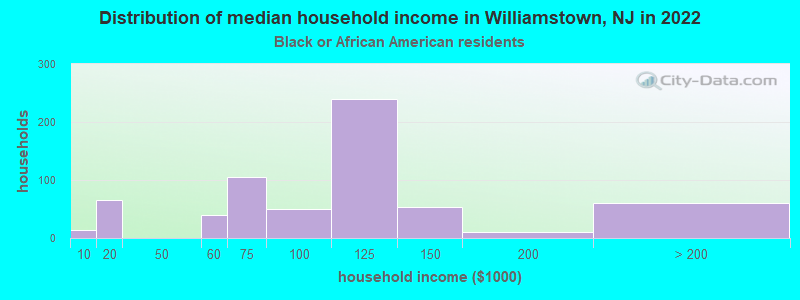
- $123,541Black householders
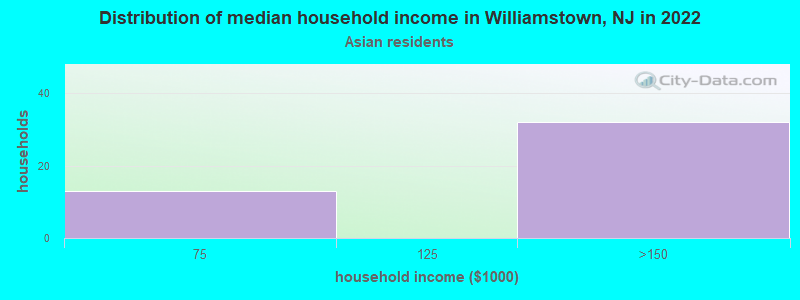
- $136,681Asian householders
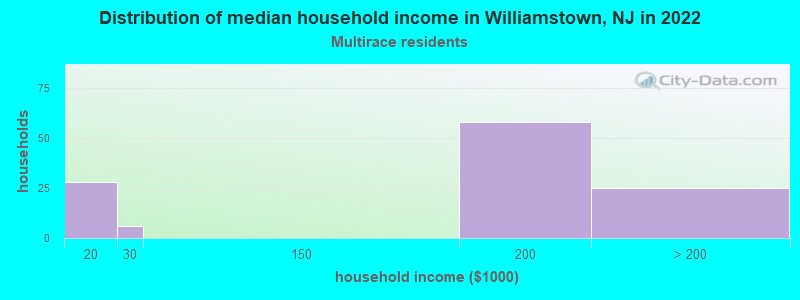
- $173,111Two or more races householders
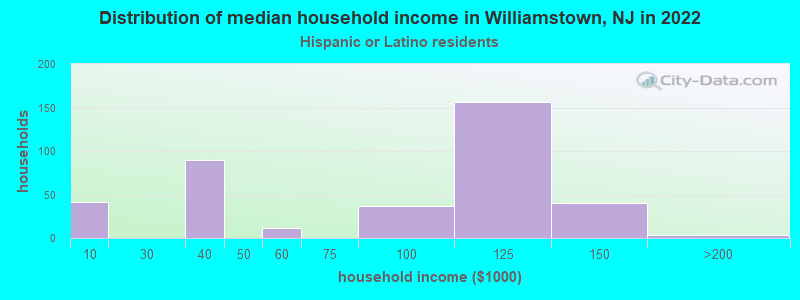
- $90,216Hispanic or Latino race householders
- Median 2022 house value
- $260,033White Non-Hispanic householders
- $263,073Black or African American householders
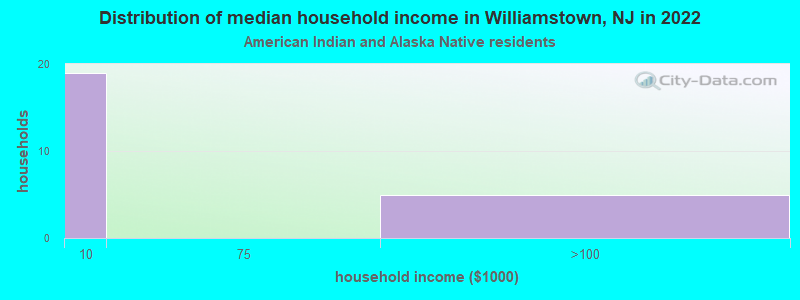
- $321,533American Indian or Alaska Native householders
- $222,150Native Hawaiian and other Pacific Islander householders
- $321,533Some other race householders
- $314,284Two or more races householders
- $300,721Hispanic or Latino householders
Household income for White non-Hispanic householders
Household income for Black householders
Household income for American Indian and Alaska Native householders
Household income for Asian householders
Household income for Two or more races householders
Household income for Hispanic or Latino race householders
Median age by race in Williamstown
- 42.1Median age for White residents
- 42.4Males
- 40.4Females
- 41.5Median age for Black or African American residents
- 49.7Males
- 39.2Females
- -676,272,813.9Median age for American Indian / Alaska Native residents
- -670,465,336.5Males
- -688,298,917.7Females
- 57.7Median age for Asian residents
- 53.3Males
- 63.6Females
- -804,177,544.9Median age for Native Hawaiian / Pacific Islander residents
- -666,666,666.0Males
- -666,666,666.0Females
- -757,575,756.8Median age for Other race residents
- -812,121,211.3Males
- -424,796,747.5Females
- 20.2Median age for Two or more races residents
- 17.4Males
- 23.5Females
- 42.1Median age for White alone residents
- 42.4Males
- 41.8Females
- 30.7Median age for Hispanic or Latino residents
- 34.8Males
- 28.2Females
Owner/renter occupied households by race in Williamstown
- House owners and renters - White residents
- 3,91183.7%Owner occupied
- 76116.3%Renter occupied
- House owners and renters - Black or African American residents
- 48883.0%Owner occupied
- 10017.0%Renter occupied
- House owners and renters - American Indian / Alaska Native residents
- 22100.0%Owner occupied
- House owners and renters - Asian residents
- 3777.1%Owner occupied
- 1122.9%Renter occupied
- House owners and renters - Other race residents
- 31100.0%Owner occupied
- House owners and renters - Two or more races residents
- 10692.8%Owner occupied
- 87.2%Renter occupied
- House owners and renters - White alone residents
- 3,84083.9%Owner occupied
- 73916.1%Renter occupied
- House owners and renters - Hispanic or Latino residents
- 27385.8%Owner occupied
- 4514.2%Renter occupied
Language usage in Williamstown
- English speakers - Total
- 93.3% of residents of Williamstown speak English at home.
- 2.4% of residents speak Spanish at home
- 31090.1%Speak English very well
- 349.9%Speak English less than very well
- 4.0% of residents speak other language at home
- 39668.8%Speak English very well
- 18031.2%Speak English less than very well
- English speakers - Born in the United States
- 94.9% of residents of Williamstown speak English at home.
- 1.2% of residents speak Spanish at home
- 52100.0%Speak English very well
- 4.3% of residents speak other language at home
- 17596.7%Speak English very well
- 63.3%Speak English less than very well
- English speakers - Native, born elsewhere
- 55.7% of residents of Williamstown speak English at home.
- 27.8% of residents speak Spanish at home
- 4175.9%Speak English very well
- 1324.1%Speak English less than very well
- 2.1% of residents speak other language at home
- 4100.0%Speak English less than very well
- English speakers - Foreign-born
- 42.2% of residents of Williamstown speak English at home.
- 11.6% of residents speak Spanish at home
- 5275.4%Speak English very well
- 1724.6%Speak English less than very well
- 46.9% of residents speak other language at home
- 12243.7%Speak English very well
- 15756.3%Speak English less than very well
White (Caucasian) - Speak only English
| Native: | 98.0% (10,817) |
| Foreign-born: | 22.5% (64) |
White (Caucasian) - Speak another language
| Native: | 2.1% (232) |
| Foreign-born: | 75.7% (215) |
Black or African American - Speak only English
| Native: | 93.6% (1,215) |
| Foreign-born: | 100.0% (153) |
American Indian / Alaska Native - Speak only English
| Native: | 74.7% (13) |
| Foreign-born: | 100.0% (6) |
Asian - Speak only English
| Native: | 100.0% (44) |
| Foreign-born: | 14.8% (15) |
Two or more races - Speak another language
| Native: | 6.3% (76) |
| Foreign-born: | 96.4% (10) |
White alone - Speak only English
| Native: | 97.4% (10,575) |
| Foreign-born: | 23.8% (65) |
White alone - Speak another language
| Native: | 2.6% (277) |
| Foreign-born: | 75.9% (209) |
Hispanic or Latino - Speak another language
| Native: | 41.8% (258) |
| Foreign-born: | 99.5% (63) |
Foreign-born residents in Williamstown
549 residents are foreign born (1.3% Latin America, 1.2% Asia, 1.1% Europe).
| This city: | 3.7% |
| New Jersey: | 23.2% |


Marital status for residents in Williamstown
Marital status - White (Caucasian) population 15 years and over
- Males
- 29.6%Never married
- 60.1%Now married
- 1.7%Separated
- 3.5%Widowed
- 5.1%Divorced
- Females
- 28.9%Never married
- 45.7%Now married
- 1.1%Separated
- 11.9%Widowed
- 12.3%Divorced
Women who gave birth in the past 12 months
| Now married: | 41.6% (40) |
| Unmarried: | 58.4% (57) |
Women who did not give birth in the past 12 months
| Now married: | 45.5% (1,216) |
| Unmarried: | 54.5% (1,455) |
Marital status - Black or African American population 15 years and over
- Males
- 22.9%Never married
- 69.8%Now married
- 0.0%Separated
- 1.0%Widowed
- 6.3%Divorced
- Females
- 36.1%Never married
- 44.9%Now married
- 4.4%Separated
- 1.8%Widowed
- 12.8%Divorced
Women who did not give birth in the past 12 months
| Now married: | 44.7% (193) |
| Unmarried: | 55.3% (238) |
Marital status - Asian population 15 years and over
- Males
- 0.0%Never married
- 36.4%Now married
- 0.0%Separated
- 0.0%Widowed
- 63.6%Divorced
- Females
- 15.2%Never married
- 53.3%Now married
- 0.0%Separated
- 31.4%Widowed
- 0.0%Divorced
Women who did not give birth in the past 12 months
| Now married: | 69.6% (16) |
| Unmarried: | 30.4% (7) |
Marital status - Other race population 15 years and over
- Males
- 0.0%Never married
- 100.0%Now married
- 0.0%Separated
- 0.0%Widowed
- 0.0%Divorced
- Females
- 0.0%Never married
- 0.0%Now married
- 0.0%Separated
- 0.0%Widowed
- 100.0%Divorced
Marital status - Two or more races population 15 years and over
- Males
- 3.8%Never married
- 5.2%Now married
- 0.0%Separated
- 0.0%Widowed
- 91.1%Divorced
- Females
- 70.9%Never married
- 20.4%Now married
- 3.5%Separated
- 5.2%Widowed
- 0.0%Divorced
Women who did not give birth in the past 12 months
| Now married: | 22.8% (82) |
| Unmarried: | 77.2% (279) |
Marital status - White alone, not Hispanic / Latino population 15 years and over
- Males
- 28.7%Never married
- 60.8%Now married
- 1.7%Separated
- 3.6%Widowed
- 5.1%Divorced
- Females
- 29.2%Never married
- 45.5%Now married
- 1.1%Separated
- 11.7%Widowed
- 12.5%Divorced
Women who gave birth in the past 12 months
| Now married: | 35.2% (31) |
| Unmarried: | 64.8% (57) |
Women who did not give birth in the past 12 months
| Now married: | 45.3% (1,197) |
| Unmarried: | 54.7% (1,447) |
Marital status - Hispanic or Latino population 15 years and over
- Males
- 52.1%Never married
- 41.1%Now married
- 0.0%Separated
- 0.0%Widowed
- 6.7%Divorced
- Females
- 36.6%Never married
- 41.7%Now married
- 0.0%Separated
- 7.6%Widowed
- 14.1%Divorced
Women who gave birth in the past 12 months
| Now married: | 100.0% (12) |
| Unmarried: | 0.0% (0) |
Women who did not give birth in the past 12 months
| Now married: | 44.4% (123) |
| Unmarried: | 55.6% (154) |
Ancestries in Williamstown

- 1,06920.9%Italian
- 67113.1%Irish
- 3787.4%German
- 2735.3%American
- 2003.9%English
- 1372.7%Polish
- 951.9%Turkish
- 821.6%Haitian
- 811.6%European
- 571.1%Ukrainian
- 541.1%Hungarian
- 521.0%Swedish
- 511.0%African
- 370.7%Russian
- 250.5%French
- 180.4%Scotch-Irish
- 170.3%Lebanese
- 170.3%Romanian
- 160.3%Guyanese
- 140.3%Slovene
- 90.2%Australian
- 80.2%Northern European

Geographical mobility in Williamstown

- Same house 1 year ago
- 10,89093.4%White (Caucasian)
- 1,31388.4%Black or African American
- 2396.6%American Indian / Alaska Native
- 192100.0%Asian
- 45100.0%Other race
- 1,06385.7%Two or more races
- 10,70593.8%White alone, not Hispanic / Latino
- 70985.9%Hispanic or Latino

-
- Moved within same county
- 6415.5%White / Caucasian
- 785.3%Black or African American
- 16713.4%Two or more races
- 5875.1%White alone, not Hispanic / Latino
- 11714.2%Hispanic or Latino

-
- Moved within same state
- 660.6%White / Caucasian
- 241.6%Black or African American
- 550.5%White alone, not Hispanic / Latino
- 172.1%Hispanic or Latino

-
- Moved from different state
- 90.1%White / Caucasian
- 463.1%Black or African American
- 90.1%White alone, not Hispanic / Latino

Children Nativity (place of birth) in Williamstown
Place of birth for residents in Williamstown
![Place of birth for the foreign-born population - Regions]()
- 202Americas
- 192Latin America
- 178Asia
- 158Europe
- 114South America
- 77Caribbean
- 72South Eastern Asia
- 67Southern Europe
- 54Eastern Asia
- 51Western Asia
- 46Western Europe
- 31Eastern Europe
- 13Northern Europe
- 10Northern America
- 9Oceania
- 9Australia and New Zealand Subregion

![Place of birth for the foreign-born population - Countries]()
- 96Guyana
- 72Philippines
- 67Italy
- 46Germany
- 43Turkey
- 43Haiti
- 33Cuba
- 28Korea
- 26Japan
- 25Russia
- 18Ecuador
- 13United Kingdom
- 10Canada
- 9Australia
- 8Georgia
- 6Romania

Grandparents responsible for own grandchildren in Williamstown
Zip codes: 08094.