Races in Wilkinsburg, Pennsylvania (PA) Detailed Stats
Data:
Races - White alone (%)
Races - White alone (% change since 2000)
Races - Black alone (%)
Races - Black alone (% change since 2000)
Races - American Indian alone (%)
Races - American Indian alone (% change since 2000)
Races - Asian alone (%)
Races - Asian alone (% change since 2000)
Races - Hispanic (%)
Races - Hispanic (% change since 2000)
Races - Native Hawaiian and Other Pacific Islander alone (%)
Races - Native Hawaiian and Other Pacific Islander alone (% change since 2000)
Races - Two or more races(%)
Races - Two or more races(% change since 2000)
Races - Other race alone (%)
Races - Other race alone (% change since 2000)
Racial diversity
Place of birth - Born in state of residence (%)
Place of birth - Born in state of residence (%) - White
Place of birth - Born in state of residence (%) - Black or African American
Place of birth - Born in state of residence (%) - Asian
Place of birth - Born in state of residence (%) - Hispanic or Latino
Place of birth - Born in state of residence (%) - American Indian and Alaska Native
Place of birth - Born in state of residence (%) - Multirace
Place of birth - Born in state of residence (%) - Other Race
Place of birth - Born in other state (%)
Place of birth - Born in other state (%) - White
Place of birth - Born in other state (%) - Black or African American
Place of birth - Born in other state (%) - Asian
Place of birth - Born in other state (%) - Hispanic or Latino
Place of birth - Born in other state (%) - American Indian and Alaska Native
Place of birth - Born in other state (%) - Multirace
Place of birth - Born in other state (%) - Other Race
Place of birth - Native, outside of US (%)
Place of birth - Native, outside of US (%) - White
Place of birth - Native, outside of US (%) - Black or African American
Place of birth - Native, outside of US (%) - Asian
Place of birth - Native, outside of US (%) - Hispanic or Latino
Place of birth - Native, outside of US (%) - American Indian and Alaska Native
Place of birth - Native, outside of US (%) - Multirace
Place of birth - Native, outside of US (%) - Other Race
Place of birth - Foreign born (%)
Place of birth - Foreign born (%) - White
Place of birth - Foreign born (%) - Black or African American
Place of birth - Foreign born (%) - Asian
Place of birth - Foreign born (%) - Hispanic or Latino
Place of birth - Foreign born (%) - American Indian and Alaska Native
Place of birth - Foreign born (%) - Multirace
Place of birth - Foreign born (%) - Other Race
Residents speaking English at home (%)
Residents speaking English at home - Born in the United States (%)
Residents speaking English at home - Native, born elsewhere (%)
Residents speaking English at home - Foreign born (%)
Residents speaking Spanish at home (%)
Residents speaking Spanish at home - Born in the United States (%)
Residents speaking Spanish at home - Native, born elsewhere (%)
Residents speaking Spanish at home - Foreign born (%)
Residents speaking other language at home (%)
Residents speaking other language at home - Born in the United States (%)
Residents speaking other language at home - Native, born elsewhere (%)
Residents speaking other language at home - Foreign born (%)
Marital status - Never married (%)
Marital status - Now married (%)
Marital status - Separated (%)
Marital status - Widowed (%)
Marital status - Divorced (%)
Ancestries Reported - Arab (%)
Ancestries Reported - Czech (%)
Ancestries Reported - Danish (%)
Ancestries Reported - Dutch (%)
Ancestries Reported - English (%)
Ancestries Reported - French (%)
Ancestries Reported - French Canadian (%)
Ancestries Reported - German (%)
Ancestries Reported - Greek (%)
Ancestries Reported - Hungarian (%)
Ancestries Reported - Irish (%)
Ancestries Reported - Italian (%)
Ancestries Reported - Lithuanian (%)
Ancestries Reported - Norwegian (%)
Ancestries Reported - Polish (%)
Ancestries Reported - Portuguese (%)
Ancestries Reported - Russian (%)
Ancestries Reported - Scotch-Irish (%)
Ancestries Reported - Scottish (%)
Ancestries Reported - Slovak (%)
Ancestries Reported - Subsaharan African (%)
Ancestries Reported - Swedish (%)
Ancestries Reported - Swiss (%)
Ancestries Reported - Ukrainian (%)
Ancestries Reported - United States (%)
Ancestries Reported - Welsh (%)
Ancestries Reported - West Indian (%)
Ancestries Reported - Other (%)
Geographical mobility - Same house 1 year ago (%)
Geographical mobility - Same house 1 year ago (%) - White
Geographical mobility - Same house 1 year ago (%) - Black or African American
Geographical mobility - Same house 1 year ago (%) - Asian
Geographical mobility - Same house 1 year ago (%) - Hispanic or Latino
Geographical mobility - Same house 1 year ago (%) - American Indian and Alaska Native
Geographical mobility - Same house 1 year ago (%) - Multirace
Geographical mobility - Same house 1 year ago (%) - Other Race
Geographical mobility - Moved within same county (%)
Geographical mobility - Moved within same county (%) - White
Geographical mobility - Moved within same county (%) - Black or African American
Geographical mobility - Moved within same county (%) - Asian
Geographical mobility - Moved within same county (%) - Hispanic or Latino
Geographical mobility - Moved within same county (%) - American Indian and Alaska Native
Geographical mobility - Moved within same county (%) - Multirace
Geographical mobility - Moved within same county (%) - Other Race
Geographical mobility - Moved from different county within same state (%)
Geographical mobility - Moved from different county within same state (%) - White
Geographical mobility - Moved from different county within same state (%) - Black or African American
Geographical mobility - Moved from different county within same state (%) - Asian
Geographical mobility - Moved from different county within same state (%) - Hispanic or Latino
Geographical mobility - Moved from different county within same state (%) - American Indian and Alaska Native
Geographical mobility - Moved from different county within same state (%) - Multirace
Geographical mobility - Moved from different county within same state (%) - Other Race
Geographical mobility - Moved from different state (%)
Geographical mobility - Moved from different state (%) - White
Geographical mobility - Moved from different state (%) - Black or African American
Geographical mobility - Moved from different state (%) - Asian
Geographical mobility - Moved from different state (%) - Hispanic or Latino
Geographical mobility - Moved from different state (%) - American Indian and Alaska Native
Geographical mobility - Moved from different state (%) - Multirace
Geographical mobility - Moved from different state (%) - Other Race
Geographical mobility - Moved from abroad (%)
Geographical mobility - Moved from abroad (%) - White
Geographical mobility - Moved from abroad (%) - Black or African American
Geographical mobility - Moved from abroad (%) - Asian
Geographical mobility - Moved from abroad (%) - Hispanic or Latino
Geographical mobility - Moved from abroad (%) - American Indian and Alaska Native
Geographical mobility - Moved from abroad (%) - Multirace
Geographical mobility - Moved from abroad (%) - Other Race
Place of birth for the foreign-born population - Ireland (%)
Place of birth for the foreign-born population - Denmark (%)
Place of birth for the foreign-born population - Norway (%)
Place of birth for the foreign-born population - Sweden (%)
Place of birth for the foreign-born population - United Kingdom (%)
Place of birth for the foreign-born population - England (%)
Place of birth for the foreign-born population - Scotland (%)
Place of birth for the foreign-born population - Other Northern Europe (%)
Place of birth for the foreign-born population - Austria (%)
Place of birth for the foreign-born population - Belgium (%)
Place of birth for the foreign-born population - France (%)
Place of birth for the foreign-born population - Germany (%)
Place of birth for the foreign-born population - Netherlands (%)
Place of birth for the foreign-born population - Switzerland (%)
Place of birth for the foreign-born population - Other Western Europe (%)
Place of birth for the foreign-born population - Greece (%)
Place of birth for the foreign-born population - Italy (%)
Place of birth for the foreign-born population - Portugal (%)
Place of birth for the foreign-born population - Spain (%)
Place of birth for the foreign-born population - Other Southern Europe (%)
Place of birth for the foreign-born population - Albania (%)
Place of birth for the foreign-born population - Belarus (%)
Place of birth for the foreign-born population - Bosnia and Herzegovina (%)
Place of birth for the foreign-born population - Bulgaria (%)
Place of birth for the foreign-born population - Croatia (%)
Place of birth for the foreign-born population - Czechoslovakia (%)
Place of birth for the foreign-born population - Hungary (%)
Place of birth for the foreign-born population - Latvia (%)
Place of birth for the foreign-born population - Lithuania (%)
Place of birth for the foreign-born population - North Macedonia (Macedonia) (%)
Place of birth for the foreign-born population - Moldova (%)
Place of birth for the foreign-born population - Poland (%)
Place of birth for the foreign-born population - Romania (%)
Place of birth for the foreign-born population - Russia (%)
Place of birth for the foreign-born population - Serbia (%)
Place of birth for the foreign-born population - Ukraine (%)
Place of birth for the foreign-born population - Other Eastern Europe (%)
Place of birth for the foreign-born population - China (%)
Place of birth for the foreign-born population - Hong Kong (%)
Place of birth for the foreign-born population - Taiwan (%)
Place of birth for the foreign-born population - Japan (%)
Place of birth for the foreign-born population - Korea (%)
Place of birth for the foreign-born population - Other Eastern Asia (%)
Place of birth for the foreign-born population - Afghanistan (%)
Place of birth for the foreign-born population - Bangladesh (%)
Place of birth for the foreign-born population - India (%)
Place of birth for the foreign-born population - Iran (%)
Place of birth for the foreign-born population - Kazakhstan (%)
Place of birth for the foreign-born population - Nepal (%)
Place of birth for the foreign-born population - Pakistan (%)
Place of birth for the foreign-born population - Sri Lanka (%)
Place of birth for the foreign-born population - Uzbekistan (%)
Place of birth for the foreign-born population - Other South Central Asia (%)
Place of birth for the foreign-born population - Burma (%)
Place of birth for the foreign-born population - Cambodia (%)
Place of birth for the foreign-born population - Indonesia (%)
Place of birth for the foreign-born population - Laos (%)
Place of birth for the foreign-born population - Malaysia (%)
Place of birth for the foreign-born population - Philippines (%)
Place of birth for the foreign-born population - Singapore (%)
Place of birth for the foreign-born population - Thailand (%)
Place of birth for the foreign-born population - Vietnam (%)
Place of birth for the foreign-born population - Other South Eastern Asia (%)
Place of birth for the foreign-born population - Armenia (%)
Place of birth for the foreign-born population - Iraq (%)
Place of birth for the foreign-born population - Israel (%)
Place of birth for the foreign-born population - Jordan (%)
Place of birth for the foreign-born population - Kuwait (%)
Place of birth for the foreign-born population - Lebanon (%)
Place of birth for the foreign-born population - Saudi Arabia (%)
Place of birth for the foreign-born population - Syria (%)
Place of birth for the foreign-born population - Turkey (%)
Place of birth for the foreign-born population - Yemen (%)
Place of birth for the foreign-born population - Other Western Asia (%)
Place of birth for the foreign-born population - Eritrea (%)
Place of birth for the foreign-born population - Ethiopia (%)
Place of birth for the foreign-born population - Kenya (%)
Place of birth for the foreign-born population - Somalia (%)
Place of birth for the foreign-born population - Uganda (%)
Place of birth for the foreign-born population - Zimbabwe (%)
Place of birth for the foreign-born population - Other Eastern Africa (%)
Place of birth for the foreign-born population - Cameroon (%)
Place of birth for the foreign-born population - Congo (%)
Place of birth for the foreign-born population - Democratic Republic of Congo (Zaire) (%)
Place of birth for the foreign-born population - Other Middle Africa (%)
Place of birth for the foreign-born population - Egypt (%)
Place of birth for the foreign-born population - Morocco (%)
Place of birth for the foreign-born population - Sudan (%)
Place of birth for the foreign-born population - Other Northern Africa (%)
Place of birth for the foreign-born population - South Africa (%)
Place of birth for the foreign-born population - Other Southern Africa (%)
Place of birth for the foreign-born population - Cabo Verde (%)
Place of birth for the foreign-born population - Ghana (%)
Place of birth for the foreign-born population - Liberia (%)
Place of birth for the foreign-born population - Nigeria (%)
Place of birth for the foreign-born population - Senegal (%)
Place of birth for the foreign-born population - Sierra Leone (%)
Place of birth for the foreign-born population - Other Western Africa (%)
Place of birth for the foreign-born population - Australia (%)
Place of birth for the foreign-born population - New Zealand (%)
Place of birth for the foreign-born population - Fiji (%)
Place of birth for the foreign-born population - Micronesia (%)
Place of birth for the foreign-born population - Bahamas (%)
Place of birth for the foreign-born population - Barbados (%)
Place of birth for the foreign-born population - Cuba (%)
Place of birth for the foreign-born population - Dominica (%)
Place of birth for the foreign-born population - Dominican Republic (%)
Place of birth for the foreign-born population - Grenada (%)
Place of birth for the foreign-born population - Haiti (%)
Place of birth for the foreign-born population - Jamaica (%)
Place of birth for the foreign-born population - St. Vincent and the Grenadines (%)
Place of birth for the foreign-born population - Trinidad and Tobago (%)
Place of birth for the foreign-born population - West Indies (%)
Place of birth for the foreign-born population - Other Caribbean (%)
Place of birth for the foreign-born population - Belize (%)
Place of birth for the foreign-born population - Costa Rica (%)
Place of birth for the foreign-born population - El Salvador (%)
Place of birth for the foreign-born population - Guatemala (%)
Place of birth for the foreign-born population - Honduras (%)
Place of birth for the foreign-born population - Mexico (%)
Place of birth for the foreign-born population - Nicaragua (%)
Place of birth for the foreign-born population - Panama (%)
Place of birth for the foreign-born population - Other Central America (%)
Place of birth for the foreign-born population - Argentina (%)
Place of birth for the foreign-born population - Bolivia (%)
Place of birth for the foreign-born population - Brazil (%)
Place of birth for the foreign-born population - Chile (%)
Place of birth for the foreign-born population - Colombia (%)
Place of birth for the foreign-born population - Ecuador (%)
Place of birth for the foreign-born population - Guyana (%)
Place of birth for the foreign-born population - Peru (%)
Place of birth for the foreign-born population - Uruguay (%)
Place of birth for the foreign-born population - Venezuela (%)
Place of birth for the foreign-born population - Other South America (%)
Place of birth for the foreign-born population - Canada (%)
Place of birth for the foreign-born population - Other Northern America (%)
Place of birth for the foreign-born population - Other (%)
Latest news about races in Wilkinsburg, PA collected exclusively by city-data.com from local newspapers, TV, and radio stations
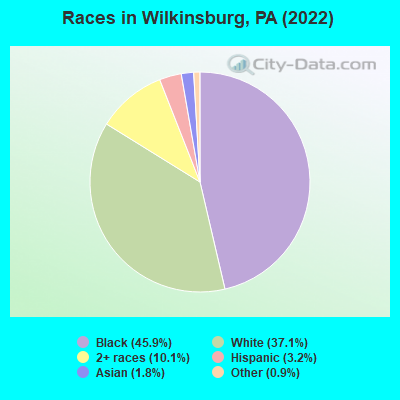
According to 2022 data, the most numerous races in Wilkinsburg, PA are White alone (5,264 residents), Black alone (6,524 residents), and Hispanic (450 residents). 92.7% of Wilkinsburg residents speak English at home. 4.3% of Wilkinsburg, PA residents are foreign-born (1.8% born in Asia, 1.0% born in Latin America, 0.7% born in Europe, 0.6% born in Africa), which is 63.0% less than the foreign-born rate of 7.0% across the entire state of Pennsylvania.
Race distribution in Wilkinsburg
2000 2022
10,322,455 84.1% White alone 1,202,437 9.8% Black alone 394,088 3.2% Hispanic 218,296 1.8% Asian alone 113,097 0.9% Two or more races 13,086 0.1% Other race alone 14,904 0.1% American Indian alone 2,691 0.02% Native Hawaiian and Other
9,487,228 73.1% White alone 1,311,581 10.1% Black alone 1,115,997 8.6% Hispanic 493,942 3.8% Two or more races 487,124 3.8% Asian alone 63,582 0.5% Other race alone 10,130 0.08% American Indian alone 2,424 0.02% Native Hawaiian and Other
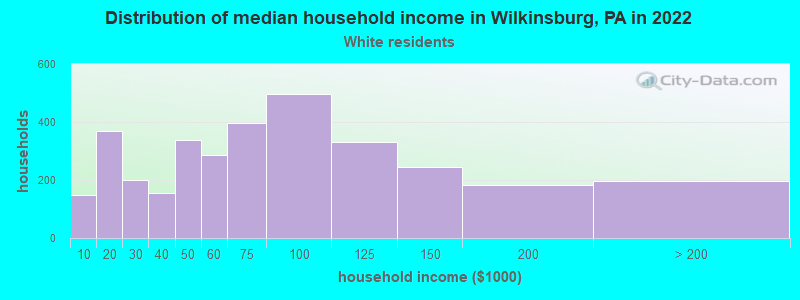
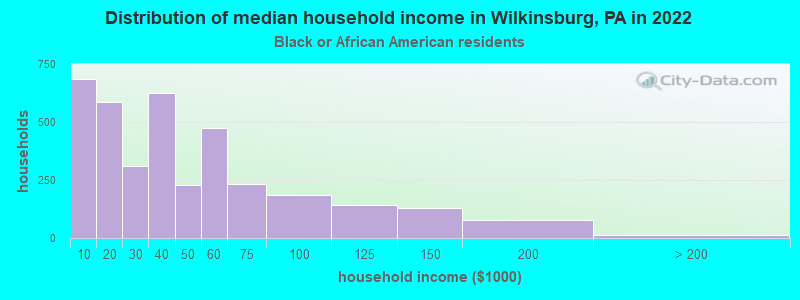
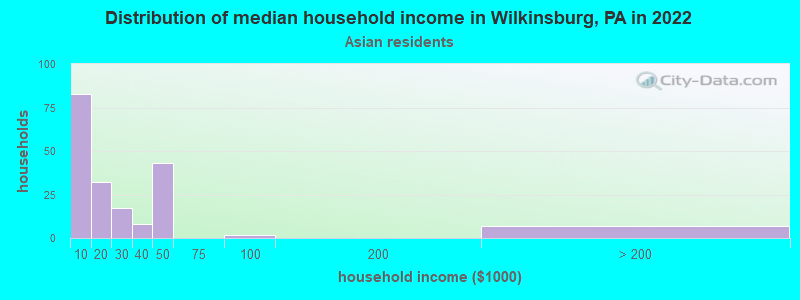
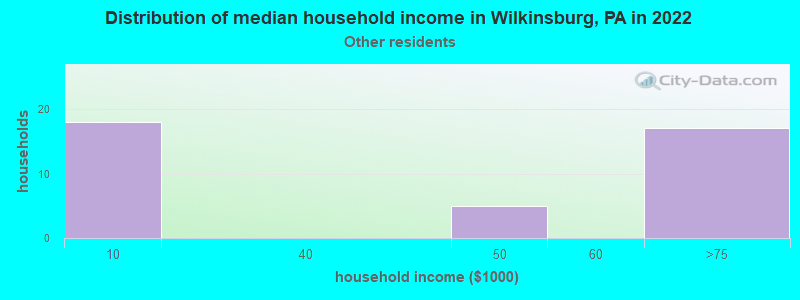
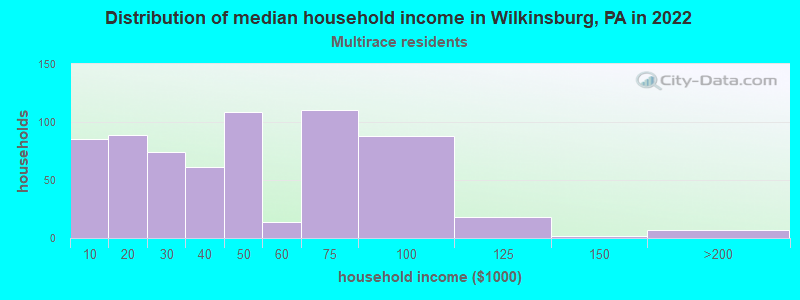
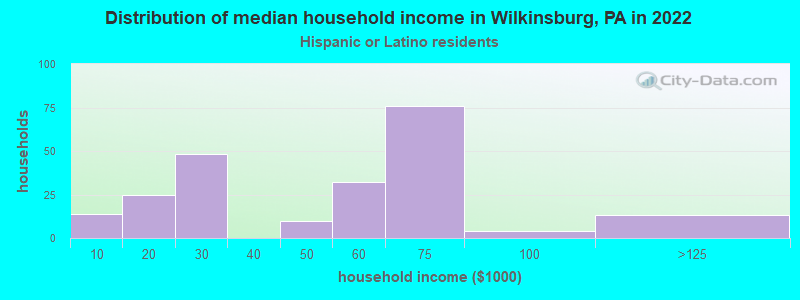
Income and house value in Wilkinsburg Median household income in 2022 $64,445 White non-Hispanic householders$35,934 Black householders$34,782 Two or more races householders$56,229 Hispanic or Latino race householdersMedian 2022 house value $156,698 White Non-Hispanic householders$132,611 Black or African American householders$59,556 American Indian or Alaska Native householders $141,081 Asian householders$215,725 Some other race householders$122,553 Two or more races householders$278,987 Hispanic or Latino householders
Median age by race in Wilkinsburg
48.2 Median age for White residents44.7 52.7 46.2 Median age for Black or African American residents45.1 44.9 -642,857,142.2 Median age for American Indian / Alaska Native residents-714,583,332.6 -577,519,379.3 41.6 Median age for Asian residents40.5 42.2 -656,534,953.8 Median age for Native Hawaiian / Pacific Islander residents-919,148,935.3 -747,474,746.7 78.8 Median age for Other race residents77.9 50.2 29.7 Median age for Two or more races residents31.4 29.6 48.3 Median age for White alone residents44.5 53.1 32.2 Median age for Hispanic or Latino residents33.6 31.6
Owner/renter occupied households by race in Wilkinsburg
House owners and renters - White residents 1,457 43.6% Owner occupied1,887 56.4% Renter occupiedHouse owners and renters - Black or African American residents 707 20.3% Owner occupied2,780 79.7% Renter occupiedHouse owners and renters - American Indian / Alaska Native residents 23 100.0% Renter occupiedHouse owners and renters - Asian residents 62 31.8% Owner occupied133 68.2% Renter occupiedHouse owners and renters - Other race residents 24 100.0% Renter occupiedHouse owners and renters - Two or more races residents 150 23.9% Owner occupied476 76.1% Renter occupiedHouse owners and renters - White alone residents 1,458 44.3% Owner occupied1,831 55.7% Renter occupiedHouse owners and renters - Hispanic or Latino residents 188 100.0% Renter occupied
Language usage in Wilkinsburg
English speakers - Total 92.7% of residents of Wilkinsburg speak English at home.
2.4% of residents speak Spanish at home 225 69.7% Speak English very well98 30.3% Speak English less than very well5.0% of residents speak other language at home 433 63.6% Speak English very well248 36.4% Speak English less than very well
English speakers - Born in the United States 93.3% of residents of Wilkinsburg speak English at home.
1.3% of residents speak Spanish at home 27 60.0% Speak English very well18 40.0% Speak English less than very well4.7% of residents speak other language at home 148 93.1% Speak English very well11 6.9% Speak English less than very well
English speakers - Native, born elsewhere 64.6% of residents of Wilkinsburg speak English at home.
28.6% of residents speak other language at home 42 100.0% Speak English very well
English speakers - Foreign-born 40.0% of residents of Wilkinsburg speak English at home.
3.9% of residents speak Spanish at home 21 100.0% Speak English very well56.9% of residents speak other language at home 101 32.7% Speak English very well208 67.3% Speak English less than very well
White (Caucasian) - Speak only English Native:
94.8% (4,867)Foreign-born:
28.7% (28)
White (Caucasian) - Speak another language Native:
5.3% (272)Foreign-born:
70.7% (69)
Black or African American - Speak only English Native:
96.5% (5,879)Foreign-born:
83.4% (133)
Black or African American - Speak another language Native:
3.5% (215)Foreign-born:
28.8% (46)
Asian - Speak only English Native:
54.1% (88)Foreign-born:
10.7% (16)
Asian - Speak another language Native:
28.2% (46)Foreign-born:
89.3% (132)
Two or more races - Speak only English Native:
90.6% (1,483)Foreign-born:
36.9% (56)
Two or more races - Speak another language Native:
9.2% (151)Foreign-born:
50.8% (77)
White alone - Speak only English Native:
95.1% (4,826)Foreign-born:
24.0% (24)
White alone - Speak another language Native:
5.2% (262)Foreign-born:
76.2% (77)
Hispanic or Latino - Speak only English Native:
78.4% (301)Foreign-born:
17.2% (4)
Hispanic or Latino - Speak another language Native:
18.7% (72)Foreign-born:
79.7% (20)
Foreign-born residents in Wilkinsburg 610 residents are foreign born (1.8% Asia , 1.0% Latin America , 0.7% Europe , 0.6% Africa ).
This city:
4.3%Pennsylvania:
7.3%
Marital status for residents in Wilkinsburg Marital status - White (Caucasian) population 15 years and over
Males 54.3% Never married28.0% Now married1.1% Separated2.6% Widowed13.9% DivorcedFemales 42.9% Never married28.6% Now married5.4% Separated9.9% Widowed13.3% DivorcedWomen who gave birth in the past 12 months Now married:
100.0% (37)Unmarried:
0.0% (0)
Women who did not give birth in the past 12 months Now married:
23.9% (271)Unmarried:
76.1% (860)
Marital status - Black or African American population 15 years and over
Males 47.8% Never married29.1% Now married4.9% Separated3.2% Widowed15.0% DivorcedFemales 57.9% Never married14.0% Now married4.4% Separated10.9% Widowed12.8% DivorcedWomen who gave birth in the past 12 months Now married:
32.1% (62)Unmarried:
67.9% (131)
Women who did not give birth in the past 12 months Now married:
16.2% (240)Unmarried:
83.8% (1,241)
Marital status - Asian population 15 years and over
Males 30.1% Never married50.6% Now married0.0% Separated0.0% Widowed19.3% DivorcedFemales 78.1% Never married21.9% Now married0.0% Separated0.0% Widowed0.0% DivorcedWomen who did not give birth in the past 12 months Now married:
19.5% (33)Unmarried:
80.5% (138)
Marital status - Other race population 15 years and over
Males 17.3% Never married0.0% Now married0.0% Separated0.0% Widowed82.7% DivorcedFemales 55.6% Never married18.5% Now married0.0% Separated0.0% Widowed25.9% DivorcedWomen who did not give birth in the past 12 months Now married:
25.0% (12)Unmarried:
75.0% (37)
Marital status - Two or more races population 15 years and over
Males 77.9% Never married17.7% Now married0.0% Separated0.0% Widowed4.4% DivorcedFemales 52.8% Never married19.0% Now married0.0% Separated8.6% Widowed19.6% DivorcedWomen who gave birth in the past 12 months Now married:
0.0% (0)Unmarried:
100.0% (14)
Women who did not give birth in the past 12 months Now married:
25.6% (126)Unmarried:
74.4% (365)
Marital status - White alone, not Hispanic / Latino population 15 years and over
Males 55.2% Never married28.5% Now married1.1% Separated2.7% Widowed12.6% DivorcedFemales 42.7% Never married28.8% Now married5.4% Separated9.9% Widowed13.1% DivorcedWomen who gave birth in the past 12 months Now married:
100.0% (37)Unmarried:
0.0% (0)
Women who did not give birth in the past 12 months Now married:
24.3% (270)Unmarried:
75.7% (841)
Marital status - Hispanic or Latino population 15 years and over
Males 77.1% Never married0.0% Now married0.0% Separated0.0% Widowed22.9% DivorcedFemales 58.8% Never married33.6% Now married0.0% Separated0.0% Widowed7.6% DivorcedWomen who did not give birth in the past 12 months Now married:
35.1% (43)Unmarried:
64.9% (79)
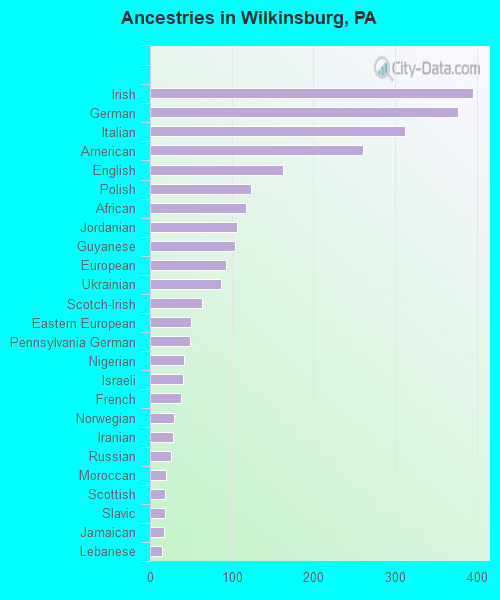
Ancestries in Wilkinsburg
395 5.3% Irish377 5.0% German312 4.2% Italian261 3.5% American163 2.2% English123 1.6% Polish118 1.6% African106 1.4% Jordanian104 1.4% Guyanese93 1.2% European87 1.2% Ukrainian64 0.9% Scotch-Irish50 0.7% Eastern European49 0.7% Pennsylvania German42 0.6% Nigerian40 0.5% Israeli38 0.5% French29 0.4% Norwegian28 0.4% Iranian26 0.3% Russian20 0.3% Moroccan18 0.2% Scottish18 0.2% Slavic17 0.2% Jamaican15 0.2% Lebanese13 0.2% Carpatho Rusyn12 0.2% Serbian11 0.1% Slovak11 0.1% Croatian11 0.1% West Indian9 0.1% Austrian9 0.1% Cape Verdean7 0.09% French Canadian7 0.09% Portuguese7 0.09% Swedish6 0.08% Hungarian5 0.07% Celtic5 0.07% Czech4 0.05% Haitian1 0.01% Dutch
Children Nativity (place of birth) in Wilkinsburg
Children under 6 years - Living with two parents Both parents native 118 100.0% NativeBoth parents foreign-born 5 100.0% NativeOne native, one foreign-born parent 45 100.0% NativeChildren under 6 years - Living with one parent Native parent 334 100.0% NativeChildren 6 to 17 years - Living with two parents Both parents native 140 77.4% Native41 22.6% Foreign-bornBoth parents foreign-born 9 21.7% Native34 78.3% Foreign-bornOne native, one foreign-born parent 27 100.0% NativeChildren 6 to 17 years - Living with one parent Native parent 1,266 99.0% Native13 1.0% Foreign-born
Grandparents responsible for own grandchildren in Wilkinsburg
Grandparents (30 to 59 years) Black or African American 8 26.0% Responsible for grandchildren23 74.0% Not responsible for grandchildrenOther race 4 100.0% Responsible for grandchildren
Grandparents (60 years and over) Black or African American 1 100.0% Not responsible for grandchildren