Races in Wildwood, Missouri (MO) Detailed Stats
Data:
Races - White alone (%)
Races - White alone (% change since 2000)
Races - Black alone (%)
Races - Black alone (% change since 2000)
Races - American Indian alone (%)
Races - American Indian alone (% change since 2000)
Races - Asian alone (%)
Races - Asian alone (% change since 2000)
Races - Hispanic (%)
Races - Hispanic (% change since 2000)
Races - Native Hawaiian and Other Pacific Islander alone (%)
Races - Native Hawaiian and Other Pacific Islander alone (% change since 2000)
Races - Two or more races(%)
Races - Two or more races(% change since 2000)
Races - Other race alone (%)
Races - Other race alone (% change since 2000)
Racial diversity
Place of birth - Born in state of residence (%)
Place of birth - Born in state of residence (%) - White
Place of birth - Born in state of residence (%) - Black or African American
Place of birth - Born in state of residence (%) - Asian
Place of birth - Born in state of residence (%) - Hispanic or Latino
Place of birth - Born in state of residence (%) - American Indian and Alaska Native
Place of birth - Born in state of residence (%) - Multirace
Place of birth - Born in state of residence (%) - Other Race
Place of birth - Born in other state (%)
Place of birth - Born in other state (%) - White
Place of birth - Born in other state (%) - Black or African American
Place of birth - Born in other state (%) - Asian
Place of birth - Born in other state (%) - Hispanic or Latino
Place of birth - Born in other state (%) - American Indian and Alaska Native
Place of birth - Born in other state (%) - Multirace
Place of birth - Born in other state (%) - Other Race
Place of birth - Native, outside of US (%)
Place of birth - Native, outside of US (%) - White
Place of birth - Native, outside of US (%) - Black or African American
Place of birth - Native, outside of US (%) - Asian
Place of birth - Native, outside of US (%) - Hispanic or Latino
Place of birth - Native, outside of US (%) - American Indian and Alaska Native
Place of birth - Native, outside of US (%) - Multirace
Place of birth - Native, outside of US (%) - Other Race
Place of birth - Foreign born (%)
Place of birth - Foreign born (%) - White
Place of birth - Foreign born (%) - Black or African American
Place of birth - Foreign born (%) - Asian
Place of birth - Foreign born (%) - Hispanic or Latino
Place of birth - Foreign born (%) - American Indian and Alaska Native
Place of birth - Foreign born (%) - Multirace
Place of birth - Foreign born (%) - Other Race
Residents speaking English at home (%)
Residents speaking English at home - Born in the United States (%)
Residents speaking English at home - Native, born elsewhere (%)
Residents speaking English at home - Foreign born (%)
Residents speaking Spanish at home (%)
Residents speaking Spanish at home - Born in the United States (%)
Residents speaking Spanish at home - Native, born elsewhere (%)
Residents speaking Spanish at home - Foreign born (%)
Residents speaking other language at home (%)
Residents speaking other language at home - Born in the United States (%)
Residents speaking other language at home - Native, born elsewhere (%)
Residents speaking other language at home - Foreign born (%)
Marital status - Never married (%)
Marital status - Now married (%)
Marital status - Separated (%)
Marital status - Widowed (%)
Marital status - Divorced (%)
Ancestries Reported - Arab (%)
Ancestries Reported - Czech (%)
Ancestries Reported - Danish (%)
Ancestries Reported - Dutch (%)
Ancestries Reported - English (%)
Ancestries Reported - French (%)
Ancestries Reported - French Canadian (%)
Ancestries Reported - German (%)
Ancestries Reported - Greek (%)
Ancestries Reported - Hungarian (%)
Ancestries Reported - Irish (%)
Ancestries Reported - Italian (%)
Ancestries Reported - Lithuanian (%)
Ancestries Reported - Norwegian (%)
Ancestries Reported - Polish (%)
Ancestries Reported - Portuguese (%)
Ancestries Reported - Russian (%)
Ancestries Reported - Scotch-Irish (%)
Ancestries Reported - Scottish (%)
Ancestries Reported - Slovak (%)
Ancestries Reported - Subsaharan African (%)
Ancestries Reported - Swedish (%)
Ancestries Reported - Swiss (%)
Ancestries Reported - Ukrainian (%)
Ancestries Reported - United States (%)
Ancestries Reported - Welsh (%)
Ancestries Reported - West Indian (%)
Ancestries Reported - Other (%)
Geographical mobility - Same house 1 year ago (%)
Geographical mobility - Same house 1 year ago (%) - White
Geographical mobility - Same house 1 year ago (%) - Black or African American
Geographical mobility - Same house 1 year ago (%) - Asian
Geographical mobility - Same house 1 year ago (%) - Hispanic or Latino
Geographical mobility - Same house 1 year ago (%) - American Indian and Alaska Native
Geographical mobility - Same house 1 year ago (%) - Multirace
Geographical mobility - Same house 1 year ago (%) - Other Race
Geographical mobility - Moved within same county (%)
Geographical mobility - Moved within same county (%) - White
Geographical mobility - Moved within same county (%) - Black or African American
Geographical mobility - Moved within same county (%) - Asian
Geographical mobility - Moved within same county (%) - Hispanic or Latino
Geographical mobility - Moved within same county (%) - American Indian and Alaska Native
Geographical mobility - Moved within same county (%) - Multirace
Geographical mobility - Moved within same county (%) - Other Race
Geographical mobility - Moved from different county within same state (%)
Geographical mobility - Moved from different county within same state (%) - White
Geographical mobility - Moved from different county within same state (%) - Black or African American
Geographical mobility - Moved from different county within same state (%) - Asian
Geographical mobility - Moved from different county within same state (%) - Hispanic or Latino
Geographical mobility - Moved from different county within same state (%) - American Indian and Alaska Native
Geographical mobility - Moved from different county within same state (%) - Multirace
Geographical mobility - Moved from different county within same state (%) - Other Race
Geographical mobility - Moved from different state (%)
Geographical mobility - Moved from different state (%) - White
Geographical mobility - Moved from different state (%) - Black or African American
Geographical mobility - Moved from different state (%) - Asian
Geographical mobility - Moved from different state (%) - Hispanic or Latino
Geographical mobility - Moved from different state (%) - American Indian and Alaska Native
Geographical mobility - Moved from different state (%) - Multirace
Geographical mobility - Moved from different state (%) - Other Race
Geographical mobility - Moved from abroad (%)
Geographical mobility - Moved from abroad (%) - White
Geographical mobility - Moved from abroad (%) - Black or African American
Geographical mobility - Moved from abroad (%) - Asian
Geographical mobility - Moved from abroad (%) - Hispanic or Latino
Geographical mobility - Moved from abroad (%) - American Indian and Alaska Native
Geographical mobility - Moved from abroad (%) - Multirace
Geographical mobility - Moved from abroad (%) - Other Race
Place of birth for the foreign-born population - Ireland (%)
Place of birth for the foreign-born population - Denmark (%)
Place of birth for the foreign-born population - Norway (%)
Place of birth for the foreign-born population - Sweden (%)
Place of birth for the foreign-born population - United Kingdom (%)
Place of birth for the foreign-born population - England (%)
Place of birth for the foreign-born population - Scotland (%)
Place of birth for the foreign-born population - Other Northern Europe (%)
Place of birth for the foreign-born population - Austria (%)
Place of birth for the foreign-born population - Belgium (%)
Place of birth for the foreign-born population - France (%)
Place of birth for the foreign-born population - Germany (%)
Place of birth for the foreign-born population - Netherlands (%)
Place of birth for the foreign-born population - Switzerland (%)
Place of birth for the foreign-born population - Other Western Europe (%)
Place of birth for the foreign-born population - Greece (%)
Place of birth for the foreign-born population - Italy (%)
Place of birth for the foreign-born population - Portugal (%)
Place of birth for the foreign-born population - Spain (%)
Place of birth for the foreign-born population - Other Southern Europe (%)
Place of birth for the foreign-born population - Albania (%)
Place of birth for the foreign-born population - Belarus (%)
Place of birth for the foreign-born population - Bosnia and Herzegovina (%)
Place of birth for the foreign-born population - Bulgaria (%)
Place of birth for the foreign-born population - Croatia (%)
Place of birth for the foreign-born population - Czechoslovakia (%)
Place of birth for the foreign-born population - Hungary (%)
Place of birth for the foreign-born population - Latvia (%)
Place of birth for the foreign-born population - Lithuania (%)
Place of birth for the foreign-born population - North Macedonia (Macedonia) (%)
Place of birth for the foreign-born population - Moldova (%)
Place of birth for the foreign-born population - Poland (%)
Place of birth for the foreign-born population - Romania (%)
Place of birth for the foreign-born population - Russia (%)
Place of birth for the foreign-born population - Serbia (%)
Place of birth for the foreign-born population - Ukraine (%)
Place of birth for the foreign-born population - Other Eastern Europe (%)
Place of birth for the foreign-born population - China (%)
Place of birth for the foreign-born population - Hong Kong (%)
Place of birth for the foreign-born population - Taiwan (%)
Place of birth for the foreign-born population - Japan (%)
Place of birth for the foreign-born population - Korea (%)
Place of birth for the foreign-born population - Other Eastern Asia (%)
Place of birth for the foreign-born population - Afghanistan (%)
Place of birth for the foreign-born population - Bangladesh (%)
Place of birth for the foreign-born population - India (%)
Place of birth for the foreign-born population - Iran (%)
Place of birth for the foreign-born population - Kazakhstan (%)
Place of birth for the foreign-born population - Nepal (%)
Place of birth for the foreign-born population - Pakistan (%)
Place of birth for the foreign-born population - Sri Lanka (%)
Place of birth for the foreign-born population - Uzbekistan (%)
Place of birth for the foreign-born population - Other South Central Asia (%)
Place of birth for the foreign-born population - Burma (%)
Place of birth for the foreign-born population - Cambodia (%)
Place of birth for the foreign-born population - Indonesia (%)
Place of birth for the foreign-born population - Laos (%)
Place of birth for the foreign-born population - Malaysia (%)
Place of birth for the foreign-born population - Philippines (%)
Place of birth for the foreign-born population - Singapore (%)
Place of birth for the foreign-born population - Thailand (%)
Place of birth for the foreign-born population - Vietnam (%)
Place of birth for the foreign-born population - Other South Eastern Asia (%)
Place of birth for the foreign-born population - Armenia (%)
Place of birth for the foreign-born population - Iraq (%)
Place of birth for the foreign-born population - Israel (%)
Place of birth for the foreign-born population - Jordan (%)
Place of birth for the foreign-born population - Kuwait (%)
Place of birth for the foreign-born population - Lebanon (%)
Place of birth for the foreign-born population - Saudi Arabia (%)
Place of birth for the foreign-born population - Syria (%)
Place of birth for the foreign-born population - Turkey (%)
Place of birth for the foreign-born population - Yemen (%)
Place of birth for the foreign-born population - Other Western Asia (%)
Place of birth for the foreign-born population - Eritrea (%)
Place of birth for the foreign-born population - Ethiopia (%)
Place of birth for the foreign-born population - Kenya (%)
Place of birth for the foreign-born population - Somalia (%)
Place of birth for the foreign-born population - Uganda (%)
Place of birth for the foreign-born population - Zimbabwe (%)
Place of birth for the foreign-born population - Other Eastern Africa (%)
Place of birth for the foreign-born population - Cameroon (%)
Place of birth for the foreign-born population - Congo (%)
Place of birth for the foreign-born population - Democratic Republic of Congo (Zaire) (%)
Place of birth for the foreign-born population - Other Middle Africa (%)
Place of birth for the foreign-born population - Egypt (%)
Place of birth for the foreign-born population - Morocco (%)
Place of birth for the foreign-born population - Sudan (%)
Place of birth for the foreign-born population - Other Northern Africa (%)
Place of birth for the foreign-born population - South Africa (%)
Place of birth for the foreign-born population - Other Southern Africa (%)
Place of birth for the foreign-born population - Cabo Verde (%)
Place of birth for the foreign-born population - Ghana (%)
Place of birth for the foreign-born population - Liberia (%)
Place of birth for the foreign-born population - Nigeria (%)
Place of birth for the foreign-born population - Senegal (%)
Place of birth for the foreign-born population - Sierra Leone (%)
Place of birth for the foreign-born population - Other Western Africa (%)
Place of birth for the foreign-born population - Australia (%)
Place of birth for the foreign-born population - New Zealand (%)
Place of birth for the foreign-born population - Fiji (%)
Place of birth for the foreign-born population - Micronesia (%)
Place of birth for the foreign-born population - Bahamas (%)
Place of birth for the foreign-born population - Barbados (%)
Place of birth for the foreign-born population - Cuba (%)
Place of birth for the foreign-born population - Dominica (%)
Place of birth for the foreign-born population - Dominican Republic (%)
Place of birth for the foreign-born population - Grenada (%)
Place of birth for the foreign-born population - Haiti (%)
Place of birth for the foreign-born population - Jamaica (%)
Place of birth for the foreign-born population - St. Vincent and the Grenadines (%)
Place of birth for the foreign-born population - Trinidad and Tobago (%)
Place of birth for the foreign-born population - West Indies (%)
Place of birth for the foreign-born population - Other Caribbean (%)
Place of birth for the foreign-born population - Belize (%)
Place of birth for the foreign-born population - Costa Rica (%)
Place of birth for the foreign-born population - El Salvador (%)
Place of birth for the foreign-born population - Guatemala (%)
Place of birth for the foreign-born population - Honduras (%)
Place of birth for the foreign-born population - Mexico (%)
Place of birth for the foreign-born population - Nicaragua (%)
Place of birth for the foreign-born population - Panama (%)
Place of birth for the foreign-born population - Other Central America (%)
Place of birth for the foreign-born population - Argentina (%)
Place of birth for the foreign-born population - Bolivia (%)
Place of birth for the foreign-born population - Brazil (%)
Place of birth for the foreign-born population - Chile (%)
Place of birth for the foreign-born population - Colombia (%)
Place of birth for the foreign-born population - Ecuador (%)
Place of birth for the foreign-born population - Guyana (%)
Place of birth for the foreign-born population - Peru (%)
Place of birth for the foreign-born population - Uruguay (%)
Place of birth for the foreign-born population - Venezuela (%)
Place of birth for the foreign-born population - Other South America (%)
Place of birth for the foreign-born population - Canada (%)
Place of birth for the foreign-born population - Other Northern America (%)
Place of birth for the foreign-born population - Other (%)
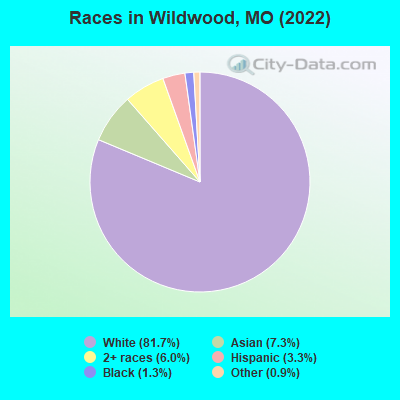
According to 2022 data, the most numerous races in Wildwood, MO are White alone (28,541 residents), Black alone (455 residents), and Two or more races (2,112 residents). 90.5% of Wildwood residents speak English at home. 8.2% of Wildwood, MO residents are foreign-born (5.0% born in Asia, 1.2% born in Europe), which is 51.4% greater than the foreign-born rate of 4.0% across the entire state of Missouri.
Race distribution in Wildwood
2000 2022
4,686,474 83.8% White alone 625,667 11.2% Black alone 118,592 2.1% Hispanic 71,905 1.3% Two or more races 61,041 1.1% Asian alone 23,302 0.4% American Indian alone 5,291 0.09% Other race alone 2,939 0.05% Native Hawaiian and Other
4,733,411 76.6% White alone 656,739 10.6% Black alone 316,300 5.1% Two or more races 291,763 4.7% Hispanic 132,436 2.1% Asian alone 27,467 0.4% Other race alone 12,313 0.2% American Indian alone 7,528 0.1% Native Hawaiian and Other
Income and house value in Wildwood Median household income in 2022 $148,821 White non-Hispanic householders$165,733 Black householders$161,594 Asian householders$132,835 Two or more races householders$142,337 Hispanic or Latino race householdersMedian 2022 house value $483,085 White Non-Hispanic householders$374,090 Black or African American householders$443,469 American Indian or Alaska Native householders $416,269 Asian householders$542,017 Some other race householders$468,106 Two or more races householders$566,654 Hispanic or Latino householders
Median age by race in Wildwood
47.6 Median age for White residents47.8 47.4 39.2 Median age for Black or African American residents39.1 39.2 51.7 Median age for American Indian / Alaska Native residents-644,003,776.5 -505,494,505.0 43.8 Median age for Asian residents40.1 46.2 -710,303,029.6 Median age for Native Hawaiian / Pacific Islander residents-1,449,781,657.9 -752,136,751.4 40.4 Median age for Other race residents33.2 44.5 18.4 Median age for Two or more races residents22.3 16.5 47.6 Median age for White alone residents47.8 47.6 31.6 Median age for Hispanic or Latino residents16.9 35.9
Owner/renter occupied households by race in Wildwood
House owners and renters - White residents 10,009 91.2% Owner occupied966 8.8% Renter occupiedHouse owners and renters - Black or African American residents 113 80.0% Owner occupied28 20.0% Renter occupiedHouse owners and renters - Asian residents 789 96.1% Owner occupied32 3.9% Renter occupiedHouse owners and renters - Other race residents 138 100.0% Owner occupiedHouse owners and renters - Two or more races residents 687 92.8% Owner occupied53 7.2% Renter occupiedHouse owners and renters - White alone residents 9,973 91.1% Owner occupied979 8.9% Renter occupiedHouse owners and renters - Hispanic or Latino residents 271 100.0% Owner occupied
Language usage in Wildwood
English speakers - Total 90.5% of residents of Wildwood speak English at home.
2.1% of residents speak Spanish at home 514 74.2% Speak English very well179 25.8% Speak English less than very well7.4% of residents speak other language at home 1,995 81.1% Speak English very well465 18.9% Speak English less than very well
English speakers - Born in the United States 96.4% of residents of Wildwood speak English at home.
1.2% of residents speak Spanish at home 137 97.2% Speak English very well4 2.8% Speak English less than very well2.3% of residents speak other language at home 218 84.8% Speak English very well39 15.2% Speak English less than very well
English speakers - Native, born elsewhere 82.7% of residents of Wildwood speak English at home.
9.9% of residents speak Spanish at home 27 100.0% Speak English very well10.7% of residents speak other language at home 29 100.0% Speak English very well
English speakers - Foreign-born 33.2% of residents of Wildwood speak English at home.
8.0% of residents speak Spanish at home 140 59.8% Speak English very well94 40.2% Speak English less than very well58.8% of residents speak other language at home 1,380 80.4% Speak English very well336 19.6% Speak English less than very well
White (Caucasian) - Speak only English Native:
98.0% (26,090)Foreign-born:
36.5% (317)
White (Caucasian) - Speak another language Native:
2.0% (524)Foreign-born:
60.4% (525)
Black or African American - Speak only English Native:
82.0% (281)Foreign-born:
70.9% (96)
Black or African American - Speak another language Native:
29.9% (102)Foreign-born:
38.4% (52)
Asian - Speak only English Native:
71.0% (650)Foreign-born:
33.2% (552)
Asian - Speak another language Native:
32.8% (300)Foreign-born:
71.5% (1,190)
Other race - Speak another language Native:
10.2% (27)Foreign-born:
90.6% (79)
Two or more races - Speak only English Native:
89.1% (2,317)Foreign-born:
10.8% (11)
Two or more races - Speak another language Native:
11.6% (301)Foreign-born:
89.5% (91)
White alone - Speak only English Native:
98.3% (26,116)Foreign-born:
38.1% (303)
White alone - Speak another language Native:
1.7% (452)Foreign-born:
58.6% (467)
Hispanic or Latino - Speak only English Native:
76.1% (576)Foreign-born:
13.1% (37)
Hispanic or Latino - Speak another language Native:
26.2% (198)Foreign-born:
85.8% (246)
Foreign-born residents in Wildwood 2,876 residents are foreign born (5.0% Asia , 1.2% Europe ).
This city:
8.2%Missouri:
4.2%
Marital status for residents in Wildwood Marital status - White (Caucasian) population 15 years and over
Males 25.0% Never married67.2% Now married0.5% Separated1.6% Widowed5.7% DivorcedFemales 19.2% Never married67.7% Now married0.1% Separated6.2% Widowed6.7% DivorcedWomen who gave birth in the past 12 months Now married:
92.0% (231)Unmarried:
8.0% (20)
Women who did not give birth in the past 12 months Now married:
53.8% (2,703)Unmarried:
46.2% (2,317)
Marital status - Black or African American population 15 years and over
Males 34.6% Never married50.2% Now married4.1% Separated0.0% Widowed11.1% DivorcedFemales 53.4% Never married46.6% Now married0.0% Separated0.0% Widowed0.0% DivorcedWomen who did not give birth in the past 12 months Now married:
26.7% (30)Unmarried:
73.3% (82)
Marital status - American Indian / Alaska Native population 15 years and over
Males 0.0% Never married100.0% Now married0.0% Separated0.0% Widowed0.0% DivorcedFemales 0.0% Never married0.0% Now married0.0% Separated100.0% Widowed0.0% DivorcedMarital status - Asian population 15 years and over
Males 27.5% Never married70.7% Now married0.0% Separated0.0% Widowed1.7% DivorcedFemales 24.6% Never married67.2% Now married0.0% Separated7.3% Widowed0.8% DivorcedWomen who gave birth in the past 12 months Now married:
100.0% (35)Unmarried:
0.0% (0)
Women who did not give birth in the past 12 months Now married:
62.8% (445)Unmarried:
37.2% (264)
Marital status - Other race population 15 years and over
Males 44.6% Never married55.4% Now married0.0% Separated0.0% Widowed0.0% DivorcedFemales 14.1% Never married73.4% Now married12.5% Separated0.0% Widowed0.0% DivorcedWomen who did not give birth in the past 12 months Now married:
65.8% (54)Unmarried:
34.2% (28)
Marital status - Two or more races population 15 years and over
Males 48.8% Never married40.1% Now married0.0% Separated2.7% Widowed8.4% DivorcedFemales 37.3% Never married48.5% Now married1.6% Separated0.0% Widowed12.6% DivorcedWomen who gave birth in the past 12 months Now married:
100.0% (17)Unmarried:
0.0% (0)
Women who did not give birth in the past 12 months Now married:
30.0% (191)Unmarried:
70.0% (446)
Marital status - White alone, not Hispanic / Latino population 15 years and over
Males 25.0% Never married67.1% Now married0.5% Separated1.6% Widowed5.8% DivorcedFemales 19.3% Never married67.5% Now married0.1% Separated6.2% Widowed6.7% DivorcedWomen who gave birth in the past 12 months Now married:
92.0% (233)Unmarried:
8.0% (20)
Women who did not give birth in the past 12 months Now married:
53.1% (2,638)Unmarried:
46.9% (2,330)
Marital status - Hispanic or Latino population 15 years and over
Males 31.9% Never married61.4% Now married0.0% Separated5.5% Widowed1.2% DivorcedFemales 24.5% Never married68.0% Now married6.1% Separated1.3% Widowed0.0% DivorcedWomen who did not give birth in the past 12 months Now married:
74.5% (185)Unmarried:
25.5% (63)
Ancestries in Wildwood
3,516 23.9% German1,646 11.2% English1,406 9.6% American1,279 8.7% Irish937 6.4% European850 5.8% Italian270 1.8% Polish193 1.3% Dutch148 1.0% Scotch-Irish144 1.0% Iranian118 0.8% Scottish114 0.8% Scandinavian101 0.7% French99 0.7% Romanian96 0.7% Eastern European87 0.6% Russian68 0.5% Norwegian60 0.4% Bulgarian58 0.4% Yugoslavian56 0.4% Swedish53 0.4% Greek49 0.3% Ukrainian37 0.3% Egyptian36 0.2% Ethiopian33 0.2% Canadian31 0.2% Swiss30 0.2% Haitian29 0.2% Danish29 0.2% African27 0.2% British26 0.2% Czech26 0.2% Portuguese25 0.2% Lebanese21 0.1% Hungarian18 0.1% Kenyan14 0.10% Northern European13 0.09% French Canadian13 0.09% Welsh12 0.08% Nigerian10 0.07% Palestinian10 0.07% Croatian7 0.05% Finnish6 0.04% Serbian5 0.03% Lithuanian5 0.03% Slovak5 0.03% Slovene4 0.03% Macedonian
Geographical mobility in Wildwood Same house 1 year ago 25,702 90.3% White (Caucasian)353 77.5% Black or African American22 100.0% American Indian / Alaska Native2,450 95.6% Asian351 94.5% Other race2,673 86.7% Two or more races25,614 90.3% White alone, not Hispanic / Latino1,055 91.2% Hispanic or LatinoMoved within same county 1,668 5.9% White / Caucasian75 16.5% Black or African American147 5.7% Asian251 8.1% Two or more races1,650 5.8% White alone, not Hispanic / Latino37 3.2% Hispanic or LatinoMoved within same state 573 2.0% White / Caucasian11 2.4% Black or African American44 1.7% Asian30 1.0% Two or more races555 2.0% White alone, not Hispanic / Latino15 1.3% Hispanic or LatinoMoved from different state 498 1.7% White / Caucasian19 4.1% Black or African American20 0.7% Two or more races499 1.8% White alone, not Hispanic / LatinoMoved from abroad 9 0.0% White10 0.4% Asian32 1.0% Two or more races9 0.0% White alone, not Hispanic / Latino7 0.6% Hispanic or Latino
Children Nativity (place of birth) in Wildwood
Children under 6 years - Living with two parents Both parents native 1,600 100.0% NativeBoth parents foreign-born 83 100.0% NativeOne native, one foreign-born parent 159 100.0% NativeChildren under 6 years - Living with one parent Native parent 89 100.0% NativeChildren 6 to 17 years - Living with two parents Both parents native 4,461 98.0% Native89 2.0% Foreign-bornBoth parents foreign-born 294 79.3% Native77 20.7% Foreign-bornOne native, one foreign-born parent 300 94.3% Native18 5.7% Foreign-bornChildren 6 to 17 years - Living with one parent Native parent 861 100.0% NativeForeign-born parent 32 48.6% Native34 51.4% Foreign-born
Grandparents responsible for own grandchildren in Wildwood
Grandparents (30 to 59 years) White / Caucasian 35 100.0% Not responsible for grandchildrenOther race 9 100.0% Not responsible for grandchildrenWhite alone, not Hispanic / Latino 35 100.0% Not responsible for grandchildrenHispanic or Latino 6 100.0% Not responsible for grandchildrenGrandparents (60 years and over) White / Caucasian 102 42.4% Responsible for grandchildren139 57.6% Not responsible for grandchildrenOther race 44 100.0% Responsible for grandchildrenWhite alone, not Hispanic / Latino 102 42.0% Responsible for grandchildren141 58.0% Not responsible for grandchildrenHispanic or Latino 34 89.8% Responsible for grandchildren4 10.2% Not responsible for grandchildren